En vue de l'obtention du
DOCTORAT DE L'UNIVERSITÉ DE TOULOUSE
Délivré par :Institut National Polytechnique de Toulouse (Toulouse INP) Discipline ou spécialité :
Photonique et système optoélectronique
Présentée et soutenue par :
M. HARIS APRIYANTO le mercredi 27 février 2019
Titre :
Unité de recherche : Ecole doctorale :
Study, analysis and experimental validation of fiber refractometers based
on single-mode, multimode and photonic crystal fibers for refractive index
measurements with application for the detection of methane
Génie Electrique, Electronique, Télécommunications (GEET) Laboratoire d'Analyse et d'Architecture des Systèmes (L.A.A.S.)
Directeur(s) de Thèse :
M. HAN CHENG SEAT M. OLIVIER BERNAL
Rapporteurs :
M. CHRISTOPHE CAUCHETEUR, UNIVERSITE DE MONS M. PHILIPPE ROY, CNRS
Membre(s) du jury :
M. FRANCK CHOLLET, UNIVERSITE DE FRANCHE COMTE, Président M. DOMINIQUE LEDUC, UNIVERSITE DE NANTES, Membre
M. FREDERIC SURRE, UNIVERSITY OF LONDON, Invité M. GUY PLANTIER, EC SUP ELECTRONIQUE OUEST, Membre
M. HAN CHENG SEAT, INP TOULOUSE, Membre Mme VALERIE CHAVAGNAC, CNRS TOULOUSE, Membre
M. MICHEL CATTOEN, INP TOULOUSE, Invité
Abstract
Refractive index measurement has been studied since Ernest Abbé initially designed a refractometer in 1869, which is named the Abbé refractometer. Since then, numerous types of refractometers have been developed by employing either the optical prism-based refractometer or the optical fiber-based refractometer, due to their wide-ranging applications such as for sensing various physical, biological and chemical parameters. Recently, a large number of researchers have been developing refractometers based on optical fibers, exploiting mechanisms such as surface plasmon resonance (SPR), multimode interference, fiber Bragg gratings (FBG), long-period gratings (LPG), tapered optical fibers, and striped-cladding multimode fibers (MMFs), for their advantages in immunity against electromagnetic interference, electrical passivity at the sensing probe, and capability to long term in situ measurement.
This thesis concerns the development of comprehensively functional and accurate models for optical fiber refractometers based on optical intensity modulation, in particular for stripped-cladding MMF refractometry as well as hybrid systems involving a combination of single-mode-multimode fiber refractometery and the all-fiber hybrid refractometer using photonic crystal all-fibers. A key objective of this work is to characterize the performance of these intensity-based optical fiber refractometers in terms of their power response, sensitivity, resolution, and dynamic range. The simulation results which are corroborated experimentally demonstrate very high sensitivity being obtained in Zone II (i.e. the sensing regime typically employed for measuring a sensing medium index higher than the cladding index but less than or equal to the core index) for all three types of refractometers. However, the sensitivity in Zone III (i.e. the sensing regime for which the sensing medium index is higher than the core index) is very low. A hybrid single-mode fiber - multimode fiber configuration is used to improve the sensitivity in Zone III. On other hand, the sensitivity for Zone I (i.e. the sensing regime typically employed for measuring a sensing medium index lower than the cladding index) has been improved by increasing evanescent wave absorption using the all-fiber hybrid refractometer based on solid-core photonic crystal fibers.
As a further potential of the fiber refractometer for applications in biochemical sensing, the proof-of-concept for a methane gas sensor has been demonstrated using supramolecular cryptophane-A which enables to trap the methane molecules. Cryptophane-A incorporated into a functionalized film of Styrene-Acrylonitrile (SAN) host is applied to a de-cladded region of the sensor as the sensitive region. The refractive index of this functionalized layer increases proportionally with increasing methane concentration, subsequently inducing variations in the transmitted optical power along the fiber sensor.
Keywords: refractometer, refractive index, fiber optic, multimode fiber, photonic crystal fibers, cryptophane-A, methane gas.
Résumé
La mesure de l'indice de réfraction a été étudiée depuis qu'Ernest Abbé aie initialement conçu un réfractomètre en 1869, appelé le réfractomètre d'Abbé. Depuis lors, de nombreux réfractomètres ont été développés tels que le réfractomètre à prisme optique ainsi que le réfractomètre à fibre optique, en raison de leurs applications étendues pour la détection de divers paramètres physiques, biologiques et chimiques. Récemment, un grand nombre de chercheurs ont mis au point des réfractomètres basés sur des fibres optiques, exploitant des mécanismes tels que la résonance des plasmons de surface (SPR), les interférences multimodes, les fibres à réseaux de Bragg (FBG), les fibres à réseaux à longues périodes (LPG), les fibres optiques coniques et la fibre multimode à gaine dénudée. Les capteurs fibrés sont avantageux grâce à leur immunité contre les interférences électromagnétiques, passivité électrique au niveau de la sonde de détection et potentiel de mesure in situ à long terme.
Cette thèse concerne le développement de modèles complets fonctionnels et précis pour les réfractomètres à fibres optiques basés sur la modulation d'intensité optique, en particulier la réfractométrie à fibre multimode à gaine dénudée ainsi que les systèmes hybrides associant fibres monomode et multimode, et un réfractomètre hybride tout fibré utilisant des fibres à cristaux photoniques. L'objectif clé de ce travail est de caractériser les performances de ces réfractomètres à fibres optiques basés sur la modulation d'intensité en termes de réponse en puissance, de sensibilité, de résolution et de dynamique de mesure. Les résultats de simulation qui sont corroborés expérimentalement démontrent que la très grande sensibilité obtenue dans la zone II (c'est-à-dire le régime de détection typiquement utilisé pour mesurer l'indice du milieu supérieur à l'indice de gaine mais inférieur ou égal à l'indice du cœur) pour tous les trois réfractomètres. Cependant, la sensibilité dans la Zone III (c‟est-à-dire le régime de détection pour lequel l‟indice du milieu à mesurer est supérieur à celui du cœur) est très faible. Ainsi, un refractomètre fibré hybride monomode-multimode est utilisé pour améliorer la sensibilité dans la Zone III. D'autre part, la sensibilité pour la zone I (c'est-à-dire le régime de détection pour mesurer l‟indice du milieu inférieur à l'indice de la gaine) a été améliorée en augmentant l'absorption des ondes évanescentes à l'aide du réfractomètre hybride tout fibré à base de fibres à cristaux photoniques à cœur solide.
En termes d'application réelle du réfractomètre à fibre pour la détection biochimique, une preuve de concept pour un capteur du gaz méthane a été démontrée en utilisant les supramolécules de cryptophane-A qui permettent de piéger les molécules du méthane. Le cryptophane-A incorporé dans un film hôte à base de styrène-acrylonitrile (SAN) est appliqué sur la zone dénudée du capteur comme une région fonctionnalisée. L'indice de réfraction de cette couche sensible augmente proportionnellement avec l'augmentation de la concentration du méthane, ce qui induit une variation de la puissance optique transmise dans le capteur fibré.
Mots clés: réfractomètre, indice de réfraction, fibre optique, fibre multimode, fibres à cristaux photoniques, cryptophane-A, gaz méthane.
Acknowledgements
I would first like to thank Prof. Thierry Bosch for giving me the opportunity to joint the OSE research group. I would like to express my sincere gratitude to my supervisor Dr. Han Cheng Seat, for his continuous guidance, support, patience and motivation throughout my PhD program. He showed always enthusiasm during many unexpected short meeting in his office, and suggested to me ideas concerning the technical aspect of work. I would also thank my co-supervisor Dr. Olivier Bernal, for his advices. He helped me many times to solve some programming problems. I take this opportunity to express my thankfulness to Prof. Franck Chollet as the president of jury. I would also like to thank Dr. Phillipe Roy (Research Director at XLIM Limoges) and Prof. Christophe Caucheteur (Professor in University of Mons, Belgium), for accepting to be the reviewers of my thesis. I‟m thankful for any advice and suggestions from all the jury members (Dr. Valérie Chavagnac, Dr. Dominique Leduc, Prof. Guy Plantier, Prof. Michel Cattoen, and Dr. Frédéric Surre).
I‟m grateful to all researchers and staffs of OSE group (Marc Lescure, Michel Cattoen, Françoise Lizion, Francis Bony, Hélène Tap, Julien Perchoux, and Adam Quotb) for their kindness. I‟m also grateful to Francis Jayat et Clement Tronche for their help in experimental stuff, and Emmanuelle Tronche for her help in administrative stuff. I would also like to thank my colleagues (Yu Zhao, Gautier Ravet, Fernando Urgiles, Mengkoung Veng, Raul da Costa Moreira, Clement Deleau, Einar Knudsen, Bastian Grimaldi, and Farouk Amish) for their friendship and help.
I must express my most profound gratitude to my parents in Indonesia, my wife and my lovely children (Affan and Sofyan) for their support in most difficult moments. I acknowledge the financial support from the Indonesia Endowment Fund for Education (LPDP), Ministry of Finance, Republic of Indonesia. Without this financial support, I would not finish this thesis.
CONTENTS
Abstract ... ii Résumé ...iii Acknowledgements ... iv CONTENTS ... v General Introduction ... 1 Chapter I Refractive Index Measurement ... 61.1. Introduction ... 6
1.2. Refractive index measurements ... 7
1.2.1. The Abbé refractometer ... 8
1.2.2. The Pulfrich refractometer ... 11
1.2.3. The immersion refractometer ... 13
1.2.4. Hand-held refractometers ... 14
1.2.5. Hand-held digital refractometers ... 15
1.2.6. Fiber optic surface plasmon resonance refractometers ... 16
1.2.7. Multimode interference-based refractometers ... 18
1.2.8. Fiber Bragg grating-based refractometers ... 22
1.2.9. Long-period grating-based refractometers ... 23
1.2.10. Fiber-tip reflection-based refractometers ... 25
1.2.11. Tapered optical fiber-based refractometers ... 27
1.2.12. D-shaped fiber-based refractometers ... 28
1.2.13. Stripped-clad multimode fiber (MMF)-based refractometer ... 30
1.3. Comparison and conclusion ... 33
CHAPTER II Stripped-cladding Multimode Fiber-based Refractometer ... 36
2.1. Introduction ... 36
2.2. Theory of propagation in multimode fibers ... 38
2.2.1. Sensing mechanism and modeling in Zone I ... 39
2.2.2. Sensing mechanism and modeling in Zone II ... 44
2.2.3. Sensing mechanism and modeling in Zone III ... 47
2.3. Experimental set-up ... 48
2.4. Simulation and experimental results ... 50
2.5. Discussion ... 55
2.6. Conclusions ... 59
CHAPTER III Hybrid Single Mode – Multimode Fiber-based Refractometer ... 61
3.1. Introduction ... 61
3.2. Modeling of hybrid SMF-MMF refractometer ... 62
3.2.2. Sensing mechanisms ... 66
3.3. Experimental investigation and validation ... 74
3.4. Results and discussions ... 75
3.5. Conclusion ... 80
CHAPTER IV All-Fiber Hybrid Refractometer using Photonic Crystal Fibers ... 81
4.1. Introduction ... 81
4.2. Sensing mechanism and modeling ... 84
4.2.1. Determination of MFD and NA ... 84
4.2.2. All-fiber PCF sensing mechanism and modeling ... 87
4.3. Results and discussions ... 93
4.3.1. Fusion splicing of SMF-ESM-12B PCF-MMF ... 93
4.3.2. Fusion splicing of SMF-MMF1-LMA-20 PCF-MMF2 ... 100
4.4. Conclusions ... 106
CHAPTER V Application of Fiber Optic-based Refractometer in Methane Detection: Preliminary results .. 107
5.1. Introduction ... 107
5.2. Sensor fabrication ... 111
5.3. Hybrid SMF-MMF set-up of for CH4 measurement ... 114
5.4. Results and discussions ... 117
5.5. Conclusions ... 120
Conclusions and Perspectives ... 122
Conclusions ... 122
Perspectives ... 125
List of publications... 127
General Introduction
In the 1960s, Charles Kuen Kao led some revolutionary and ambitious work in developing and experimentally investigating the low-loss glass-based optical fiber by technically removing most of the existing impurities in Quartz which was employed as the key component material in the fiber [1]. His successful accomplishment in the realization of the low-loss optical fiber led Kao to being regarded as “the father of fiber optics” for which he was later awarded one half of the Nobel Prize in Physics in 2009 for “groundbreaking achievements in the transmission of light in fibers for optical fiber communication”. The other co-Laureates of the Nobel Prize were Willard S. Boyle and George E. Smith for “the invention of an imaging semiconductor circuit – the CCD sensor”.
The aftermath of this successful trial experiment on low-loss optical fiber has since motivated researchers to exploit fiber optics not only in applications for broadband telecommunications, but also for numerous sensing and measurement domains. This motivation can also, in large part, be attributed to certain advantages intrinsic to the optical fiber over more conventional electro-mechanical sensor technologies, such as its immunity to electromagnetic interference, small size and light weight, electrical passivity at the sensing probe or head, multiplexing potential, and remote sensing capability[2-4].
Optical fiber sensors (OFSs) have been successfully exploited, either as extrinsic devices where the optical fiber simply acts as a waveguide to transmit a useful optical signal from the measurement point to the photodetector, or as an intrinsic sensor with the fiber acting directly as the sensing element subject to a modulation of the interrogating lightwave's optical properties (such as optical intensity, phase, refractive index, propagation direction and velocity, etc.) as a function of the physical quantity being measured [2, 5]. OFSs have been developed for many applications such as for sensing various physical, biological, and chemical parameters. As a chemical sensor, the OFS is commonly employed for sensing chemical processes, monitoring environmental conditions, and pollution parameters
due to its robustness to relatively harsh ambient conditions and its chemical inertness while offering explosion-free security since the sensor requires no electrical power at the sensing point [5]. In addition, the OFS offers rapid continuous real-time in situ measurement potential for remote sensing.
In chemical sensing, one sensor type that is frequently employed is the bulk refractive index (RI) sensor or refractometer for quantifying the concentration level of various aqueous solutions, such as sucrose, salt, glycerol, dimethyl sulfoxide (DMSO), methanol, aceto-nitrile, etc[6], in addition to measuring other parameters like temperature since the RI of a medium is generally temperature-dependent[7-11]. Further, the advent of the sol-gel technique has facilitated the synthesis of bespoke sensitized coatings that can be deposited on the surface of an optical fiber as a thin film in replacement of the cladding[12-14]. This approach can allow the fiber-based refractometer to selectively measure specific organo-chemical species. For example, using a thin film of Polydimethylsiloxane (PDMS) functionalized by incorporating cryptophane-A or cryptophane-E supramolecules as the sensitive region [15], the
refractometer can be used to detect methane (CH4) concentration. The
cryptophane-based molecular traps will absorb or entrap the CH4 molecules and reversibly
produce a bond in the bulk polymeric material that will induce variations in the RI of the sensitized region as a function of CH4 concentration [15].
Various operating principles have been exploited for fiber RI sensing schemes such as surface plasmon resonance (SPR) [16-20], multimode interference (MMI) [21-24], fiber Brag gratings (FBGs) [25-28], long-period gratings (LPGs) [29-32], etc. These techniques exploit spectral or wavelength modulation-based measurements, generally requiring a spectrometer or an optical time-domain reflectometer (OTDR) to extract the RI values as a function of the variation in the measured spectrum. Sensor instrumentation employing the expensive but high-precision spectrometer and/or the OTDR is thus not very cost-effective and practical for field measurements, in addition to the relative fragility of these instruments.
However, a simple and relatively cost-effective OFS-based refractometer can potentially be realized by exploiting intensity modulation-based schemes in which the variation of RI values will induce a variation in the measured optical power.
Several techniques for fiber refractometry based on intensity modulation have been successfully developed using Fresnel reflection at the end face of a single-mode fiber (SMF) [33], tapered optical fibers [34-35], and a totally or partially stripped cladding as the sensing region in a multimode fiber (MMF) [36-39].
This thesis concerns the development of comprehensively functional and accurate models for OFRs based on intensity modulation, in particular for stripped-cladding type MMF refractometry as well as hybrid systems involving a combination of SMFs, MMFs, and photonic crystal fibers (PCFs). One key objective of this work is to characterize the performance of these intensity-based OFRs in terms of their power response, sensitivity, resolution, and dynamic range. As a further demonstration of the potential of the fiber refractometer for applications in biochemical sensing, in particular in selective gas sensing, a CH4 gas sensor has been
realized using a thin (~12 µm) functionalized film of Styrene-Acrylonitrile (SAN) incorporating cryptophane-A supramolecular traps as the sensing region (de-cladded area). This PhD thesis, entitled “Study, analysis and experimental validation of fiber refractometers based on single-mode, multimode and photonic crystal fibers for refractive index measurements with application for the detection of methane”, is composed of five chapters briefly summarized below. Some conclusions and a discussion on perspectives for future work conclude this thesis.
Chapter I introduces the refractive index as a key optical parameter for refractometric applications while also giving an overview of the existing techniques behind refractive index measurements, using both the optical fiber and non-optical fiber-based sensor systems. In this chapter, the general principles of refractive index measurement using various sensor types based on intensity modulation as well as those employing wavelength modulation-based techniques are discussed.
In Chapter II the stripped-cladding MMF refractometer together with its operating principles for refractive index sensing are described. In particular, the classification of the sensing zones as a function of the different sensing mechanisms involved is comprehensively studied. In addition, the accurate operational models henceforth developed to estimate the power response of these fiber sensors for each zone are
detailed. The models are then validated experimentally by employing a combination of glycerol-water solutions and calibrated oils.
Chapter III discusses the design of a hybrid fiber refractometer based on fusion splicing an SMF to an MMF to further improve the sensor performance, particularly by reducing parasite mechanical vibration noise and by improving the sensitivity in two of the higher RI regions (Zone II and Zone III). The development of the actual models for this hybrid system is carried out by adapting those developed in Chapter II to accurately estimate the optical power response of the refractometric sensor. Further experimental corroboration for this refractometer is also performed by a similar measurement procedure as carried out in Chapter II.
Chapter IV is dedicated to investigating the prospect of exploiting solid core PCFs in RI measurements. Two different schemes for injecting the interrogating laser beam into a PCF are investigated theoretically and experimentally, one of which uses a hybrid SMF-PCF-MMF architecture while the second involves an SMF-MMF-PCF-MMF hybrid design. The key objective is to achieve a significant increase in evanescent wave absorption (EWA), thus leading to several fold improvements in the measurement sensitivity in the lower index region (Zone I). It is found that EWA can be increased in solid-core PCFs by controlling or configuring their ability to guide injected lightwaves in the outer silica cladding of the fiber. Experimental measurements are next performed on solid-core PCFs with their coating removed. These fiber sections are then employed as the sensing element for probing an aqueous medium whose RI is varied, similar to the experiments carried out in Chapters II and III.
Chapter V demonstrates the proof-of-concept of the developed fiber optic-based refractometers for CH4 detection. Here, the procedure to realize the CH4 sensor
involves employing a thin polymeric film of SAN incorporating Cryptophane-A supramolecules as the sensitized region or layer of the sensor. Methane gas is subsequently detected by the supramolecular traps (Cryptophane-A) which selectively absorb or entrap the CH4 molecules, and reversibly produce a bond in the
bulk polymeric material of SAN that induces a variation in the RI of the sensitized region as a function of CH4 concentration. The preliminary results demonstrate the
capability of this sensor to detect CH4 with a resolution of 174 ppm, but have an
issue with repeatability, i.e. the sensor has only good sensitivity during the first measurement while degradation in performance (sensibility) occurs when the same sensor is re-used in subsequent measurements.
Conclusions and Perspectives concludes the work performed in this thesis, offers some recommendations with regard to improving the performance of the CH4 sensor
as well as discusses further prospective applications of the fiber refractometers developed in this research.
Chapter I
Refractive Index Measurement
1.1. Introduction
The refractive index (RI) or index of refraction n of a substance is defined as the ratio of the speed of an electromagnetic wave in vacuum c (= 2.99792458 × 10⁸ m/s) to its velocity in that substance v, or n = c/v [40]. According to this definition, RI could be used to describe “the optical velocity density” of a medium, since the light velocity propagating through a medium depends on the RI value of that medium. RI can also determine the deviation of the light‟s ray path when traversing or refracting into another medium. This is described by Snell‟s law, given by n1 sin1 = n2 sin2,
where n1 and n2 are the indices of the first and second medium, while 1 and 2
represent the incident and refracted angles, respectively, as schematically illustrated by Figure 1.1 [41].
Figure 1.1. Refraction occurring when light passes from one medium into another.
The RI value is an important optical property in a dielectric medium for studying the laws of reflection and refraction. The law of reflection was introduced by Euclid in 300 B.C.E., while the refraction law was initiated in 50 B.C.E. by Cleomedes which was then continued by Claudius Ptolemy (130 C.E.) who realized a precise tabulation of the angles of incidence and refraction for several media through experimental measurements [41]. Abu Sa`d al-`Alā‟ Ibn Sahl (940–1000 C.E.), a mathematician and physicist who worked at the Abbasid court in Baghdad, introduced a
diagrammatical illustration of refraction. He also described both parabolic and ellipsoidal burning mirrors, as well as analyzed the hyperbolic plano-convex and biconvex lenses. Further, Abu Ali al-Hasan ibn al-Haytham, known also in the western world as Alhazen (965–1039 C.E.), elaborated the Law of reflection using spherical and parabolic mirrors. In the 17th century, a Dutch spectacle maker, Hans Lippershey, applied for a patent on a refracting telescope in October 1608, while in 1609 Galileo Galilei, inspired by this invention, then built his own version of telescope. In 1611, Johannes Kepler discovered total internal reflection, and described the detailed operating principles for both the Keplerian (positive eyepiece) and Galilean (negative eyepiece) telescopes. Willebrord Snel, more commonly known as Snell and Professor at Leiden University, in 1621 empirically discovered the Law of Refraction. The Law of Refraction was then simplified by René Descartes into the current sine form in 1637, which today is known as Snell-Descartes' law or Snell‟s law [41].
Since then Snell-Descartes‟ law has been universally exploited in various optical measurements, in particular for RI measurement (refractometry), to study the optical properties of materials. Additionally, according to Maxwell‟s equation, RI represents the relationship between the permittivity and permeability (with 𝑛 = 𝜀𝜇 ) of a dielectric material or medium. Therefore, RI is a unique intrinsic optical property of a specific material in relation with the propagation characteristics. By measuring RI, one can, for example, investigate the presence of impurities or contaminants in a medium for quality control purposes [42-45]. In addition, accurate knowledge of this parameter is important to enable the manipulation of lightwave propagation through any dielectric medium in a form of a waveguide or an optical fiber. In this context, various measurement techniques, including those most widely-exploited currently in both research and in the industry, are briefly discussed in the following sections.
1.2. Refractive index measurements
The measurement of RI (refractometry) is typically carried out using an optical glass-based prism where an incoming light beam is made to incident on one of the inclined sides of the prism. By varying the index of the target medium which is in direct
contact with the prism, the critical or refraction angle will vary following Snell-Descartes‟ law, as a function of the incident angle and the medium index being investigated. The angular variation is then quantified and translated into the desired RI value.
In 1869, Ernest Abbé designed the first refractometer which was then known as the Abbé refractometer. This refractometer was subsequently commercialized in 1881 by Carl Zeiss, a Swiss Company which became the first and only manufacturer of the refractometer for over 40 years [46]. The Abbé refractometer is both simple and quick to use for measuring RIs of both solid and liquid media. In 1887, a second critical-angle refractometer was designed by Carl Pulfrich which became known as the Pulfrich refractometer [46]. Hereafter, in 1899, Pulfrich succeeded in designing an immersion refractometer which allowed direct quick measurement of the RI of liquids under storage [47]. Another refractometer type is a hand-held device which was designed as a low-cost and portable refractometer using prism optics for measuring the RI of liquids [48]. This refractometer has since been further developed into a digital refractometer using an LED source and a photoelectric sensor to replace the traditional eye observation technique [49].
In addition to the prism optic-based refractometer, other refractometer types, such as the interference-based [50-52] and optical fiber-based devices [53-63], have also been developed. Interference-based refractometers allow for measuring the RI value of a medium which is usually in gaseous form by observing the movement of the interference pattern across a calibrated scale through an optical microscope [50]. For the optical fiber-based refractometer, the variation in RI values of the medium can be measured using optical intensity modulation as well as wavelength or spectral modulation. Some widely-exploited principles and techniques for RI measurements are discussed below.
1.2.1. The Abbé refractometer
The Abbé refractometer was the first refractometric device constructed by Ernest Abbé (Figure 1.2) in 1869. In 1874, Abbé then published a comprehensive booklet
which described the operating principle of his invention, as well as the construction process [46, 64].
Figure 1.2. Ernest Abbé, inventor of the Abbé refractometer [65].
Despite its first construction in 1869, the Abbé refractometer, illustrated in Figure 1.3(a), was only commercialized in 1881 by Carl Zeiss [66]. Until the beginning of the twentieth century, Carl Zeiss exclusively manufactured the Abbé refractometer [64]. Nevertheless, the enduring success of the Abbé refractometer could be measured through the existence of different variants of refractometric devices derived from the original Abbé design (Figure 1.3(b)).
Figure 1.3. The Abbé refractometer: a) the first Abbé refractometer designed by Ernest Abbé [66], and b) variants of the Abbé instrument [65].
This refractometer works in the visible wavelength range and measures the RI of a substance by observing the variation of the angle of refraction as a function of RI using prism optics. Although many variants of the Abbé refractometer exist, their basic operating principle is similar and is based on the measurement of the refraction angle of a light beam through a thin layer of sample medium sandwiched between two glass prisms. The light source is incident from a lower or illuminating prism which is directly above a mirror reflector as the light source. Above the illuminating prism, a sample medium is placed in direct contact between this prism and a measuring prism (or an upper prism). This allows the refracted light from the sample medium to be refracted again in the latter measuring prism (Figure 1.4(a)).
Figure 1.4. Schematic of the Abbé refractometer, illustrating a) basic principle of the instrument [67], b) integrating Amici prisms within the telescope tube to compensate diffraction effects [67], and c) schematic of Abbé refractometer with Vernier displacement
(V), telescope (T), scale (S), compensator (C), mirror (M), and prism (P) with its rotating holder [66].
a) b)
Here, the input light is incident at the illuminating glass prism (with index ng) at an
angle i1. This is refracted into the sample medium with a refracted angle r1. The RI
of the sample medium nsm can thus be calculated using Snell‟s law as a function of ng, i1, and r1 via
𝑛𝑔𝑠𝑖𝑛𝜃𝑖1 = 𝑛𝑠𝑚𝑠𝑖𝑛𝜃𝑟1 (1.1)
The refracted light within the sample will again be refracted into the measuring prism (of index ng) with a refracted angle r2 according to
𝑛𝑔𝑠𝑖𝑛𝜃𝑟2 = 𝑛𝑠𝑚𝑠𝑖𝑛𝜃𝑟1 (1.2)
Since ng is known, nsm can thus be calculated using Equations (1.1) and (1.2) for a
given i1 corresponding to the refracted angle r2. In practice, the mathematical
calculation is not necessary since the Abbé refractometer has a holder beneath a telescope (T) (Figure 1.4(c)) with a set of crosshairs which can gradually be rotated for scanning the light exiting the measuring prism. This telescope is mounted with a displacing Vernier (V) which is connected to the turning knob of the prism holder along a fixed scale as illustrated in Figure 1.4(c). The measurement is thus realized by sandwiching the sensing medium between the illuminating prism and measuring prism. This is then observed with a small magnifying lens attached to the Vernier. The point at which half of the visual field is light and the other half is dark is next obtained by turning the telescope holder to give the measured RI scale as illustrated in the inset of Figure 1.4(b) [65].
The basic principle of the Abbé refractometer described above could, however, only function for a monochromatic light due to dispersion at other wavelengths. To reduce or eliminate dispersion, two compensating Amici prisms are added to the design as shown in Figure 1.4(b). This complete design also has the advantage that both the telescope position and that of the Amici prisms can be adjusted to correct the dispersion effects [67].
1.2.2.
The Pulfrich refractometerThe Pulfrich refractometer is another refractometer that was developed around 1887 by Carl Pulfrich (Figure 1.5), a German physicist who worked at Carl Zeiss for most
of his career. This refractometer used only a single optical prism (the measuring prism), while the Abbé refractometer in the previous section (1.2.1) employed a dual prism system (i.e. illuminating and measuring prisms) [65].
Figure 1.5. Carl Pulfrich, inventor of the Pulfrich refractometer and the immersion refractometer [65].
In the Pulfrich refractometer, the measured sample medium is placed on top of the measuring glass prism. Monochromatic light is then positioned almost horizontally to the sample medium from which the incident beam arrives at the prism face at grazing incidence (Figure 1.6(a)). The light is focused onto the sample medium and the exit angle on the adjacent prism face is measured using a telescope which can be turned along the circular transit (Figure 1.6(b)). Similar to the Abbé refractometer, the measurement of the sample index is performed by taking the point at which half of the optical field is dark and half is light. This position is subsequently translated into RI units by the circular transit.
Figure 1.6. a) Schematic of the basic principle of the Pulfrich refractometer [65], and b) simplified cross-section of the Pulfrich refractometer, with thermometer (T), sample compartment (S), prism (P), light source (L), transit circle (C), and telescope (T‟) [65].
a)
To compensate the influence of temperature, a hollow metal jacket with flowing water is used to surround the measuring prism and is equipped with a top cover which is also of hollow metal as illustrated in Figure 1.7.
Figure 1.7. Metal water-jacket to control temperature in the Pulfrich refractometer [68].
These are connected in series with a thermometer which is immersed into a cell for holding the target liquids. Thus, both the measuring prism and the substance experimented upon are entirely jacketed, except the vertical prism face from which the light emerges and a small rectangular aperture by which the light enters the prism. Therefore, by pumping a stream of water at constant temperature through the system, a very constant temperature can be maintained [69].
1.2.3. The immersion refractometer
The immersion or dipping refractometer was initially designed by Carl Pulfrich, and then commercialized by Carl Zeiss in 1899. This original design was then modified by Lowe in 1902 [70]. The immersion refractometer was designed primarily for determining and measuring solution concentrations, such as in the sugar industry, pharmaceutical products, milk serum, and alcohol. This refractometer is also very useful, in particular, for measuring the RI of acids since only the inert glass prism is immersed and therefore in contact with the corrosive acid solution.
The original Pulfrich immersion refractometer can detect RI variation (resolution) down to 4.2 × 10⁻⁵ RIU over a dynamic range of 1.325 to 1.367 RIU. Despite a relatively high resolution, the accuracy of the immersion refractometer was limited since a calibration process was necessary through a known sample for every new measurement [70]. Similar to the Abbé and Pulfrich refractometers, the immersion
refractometer measurement is based on the critical angle represented by the bordering dark and light regions. Nevertheless, unlike the Abbé and Pulfrich refractometers, the immersion device is not supported by the moveable telescope incorporating a Vernier for reading the RI value. In its place, a calibrated micrometer screw is employed to measure the fractional distance required to displace the border to the nearest scale division. The dark and light regions will thus be projected onto the linear scale-reading to determine the corresponding index of the measured liquid (Figure 1.8(a)) [65].
Figure 1.8. Immersion refractometer [65]: a) schematic of immersion refractometer with eye-piece (E), scale (S), micrometer (M), Amici prism (A), and prism (P), and b) image of Zeiss
immersion refractometer with a turning collar.
The immersion refractometer exploits ambient light as the illuminating source by employing a reflector mirror below the refractometer as illustrated in Figures 1.8(a) and 1.8(b). Since white light is used as the light source, an Amici prism (A) is needed to compensate the diffraction effects. This prism can be adjusted by turning a collar on the telescope barrel, below the eye-piece (see Figure 1.8(b)).
1.2.4. Hand-held refractometers
Hand-held refractometers are one of the most popular analog instruments used for determining the RI of a liquid due to their relatively low cost and portability. These
a) b) turning
refractometers were initially produced by Carl Zeiss in 1955 for applications in the fruit and food processing industry for measuring fruit culture, sugar concentration, moisture content of honey as well as in other related industries [71]. These refractometers employ only a single measuring prism incorporating an illuminator flap with matted surface to hold the target liquid, as illustrated in Figure 1.9.
Figure 1.9. Typical example of hand-held refractometer [72].
The basic measurement principle of hand-held refractometers is by measuring the variation of the refraction angle in relation to the target liquid index and is similar to the immersion refractometer which commonly exploits ambient light as the source for illumination. Thus the illuminating light will be refracted in the illuminator flap, the measured liquid medium, as well as the measuring prism and will be projected onto a measuring scale. The measured liquid index can then be read by observing the position of a shadow boundary on the measuring scale which displaces with variation of the refracted angle. In addition, as the RI value is a function of temperature, a bimetallic strip is coupled to the measuring index scale to compensate temperature variation by adjusting the calibration screw.
1.2.5. Hand-held digital refractometers
The hand-held digital refractometer was developed as a result of the successful development in low-cost integrated optoelectronic devices such as, in particular, the light-emitting diode (LED) and photodetector or photoelectric sensor. This refractometer uses an LED as the illuminating source and a photoelectric sensor to
replace the eye observation technique which could be subject to operator-induced errors as illustrated in Figure 1.10(a).
Figure 1.10. Hand-held digital refractometer [49] with a) schematic of the measurement principle, and b) sketch of the hand-held digital refractometer.
For measuring the RI of a sample, the target liquid is first placed above a measuring prism. An LED source radiates the light into the measuring prism, which then arrives at the interface between the prism and the liquid under investigation within a certain range of incident angle. The proportion of reflected light into the photoelectric sensor and the refracted light into the liquid then depends on the liquid index since the incident beam angle and the measuring prism index are constant. Furthermore, this refractometer is supported by a digital temperature compensator for measurement correction when the temperature is beyond that specified for the measurement range. The measured RI value and temperature are then displayed on an LCD monitor as illustrated in Figure 1.10(b).
1.2.6. Fiber optic surface plasmon resonance refractometers
The surface plasmon resonance (SPR)-based optical fiber device can typically be realized as illustrated in Figure 1.11. The cladding and coating of a plastic-clad silica (PCS) multimode fiber (MMF) with a relatively large numerical aperture (NA), for example 0.40, must first be removed over a certain length (e.g. 1 cm). The unclad MMF is then coated with a thin metal particle layer (typically silver nano-particles) of several 10's of nm thick. This metal layer could be followed by a very
thin silicon layer of several nm thick (e.g. 5 nm) to increase the sensitivity and to protect the metal layer from oxidation [73]. This coated section will serve as the sensing region which is surrounded by the target or sensing medium. Polychromatic light with a fixed angle of incidence is next launched into the system via a microscope objective and guided along the fiber by the phenomenon of total internal reflection (TIR) [73, 74]. If this incident angle is accordingly matched to a pre-determined propagation condition, resonance will occur at a specific wavelength known as the resonance wavelength [73, 74]. Spectral or wavelength interrogation is typically used for measuring the refractive index value by exploiting a spectrometer or an equivalent system.
Figure 1.11. Schematic of a typical fiber optic SPR-based refractometer [74].
Any index variation of the sensing medium will thus induce a shift of the resonance wavelength which will be indicated by a sharp dip of the transmitted power over the interrogated wavelength range as represented in Figure 1.12. The SPR curves in Figure 1.12(a) show that the resonance wavelength increases and shifts towards the longer wavelength with increasing index values for a constant silicon layer thickness. Figure 1.12(b), on the other hand, illustrates the resonance wavelength variation when this thickness is varied from 0 nm, 5 nm, 7 nm, and 10 nm, respectively. Hence, for a fixed RI value, increasing the thickness of the silicon layer will induce an increasing resonance wavelength as well as an increase in the sensitivity (as seen from the curves' slope or gradient in Figure 1.12(b)). Nevertheless, the silicon layer
thickness cannot be increased indefinitely since this will increasingly broaden the SPR response and reduce the system accuracy [73].
Figure 1.12. Typical results from SPR-based fiber optic refractometer [73]: a) SPR spectra with 5 nm thick silicon layer for RI variation from 1.333 to 1.353, and b) resonance wavelength shift with sensing medium index for different thickness of silicon layer.
1.2.7. Multimode interference-based refractometers
A multimode interference (MMI)-based refractometer can be realized by splicing step-index MMFs to obtain a hybrid structure consisting of an unclad MMF joint at its extremities by two clad MMFs as illustrated in Figure 1.13(a) [75]. Another possible configuration is an unclad MMF sandwiched between two single-mode fibers (SMFs) by fusion splicing shown in Figure 1.13(b) [23].
a)
The basic principle of fiber-based MMI refractometry is based on observing or tracking the shifting wavelength which is induced by the resulting optical interference in the multimode fiber. Interference occurs when light from the lead-in SMF or smaller-diameter MMF diffracts into the larger-diameter unclad MMF. The light is then reflected by total internal reflection (TIR) several times at the outer surface of the unclad MMF and subsequently interferes at the extreme end of the unclad MMF. The resulting shifting of the output wavelength can thus be observed in the presence of variations in the surrounding medium index due to the multimode interference effects [75, 76]. A typical measurement scheme to monitor the SPR-induced shift in the wavelength is illustrated in Figure 1.13(c).
Figure 1.13. Fiber-based MMI refractometry, a) using MMF-unclad MMF-MMF structure [75], b) using SMF-unclad MMF-SMF structure [24], and c) schematic diagram of complete
refractometer set-up [24].
In the SMF-unclad MMF-SMF configuration (Figure 1.13(b)), the radiated light from the lead-in or input SMF is diffracted into the MMF from which multiple modes are excited. These modes will interfere while propagated along the MMF,
a)
b)
c)
subsequently resulting in a phase difference () between the LP0m and LP0n modes
which can be expressed as [76]
n n L neffmnL n eff m eff n m , , 2 2 (1.3)where m and n are positive integers, L is the length of the unclad MMF, 𝑛𝑒𝑓𝑓𝑚 ,𝑛 the effective refractive index difference between the LP0m and LP0n modes and is the
free-space wavelength. Further, the wavelength spacing between two adjacent minima can be determined by [76]
L neffmn , 2 (1.4)
Thus, will increase for decreasing length of unclad MMF. Concurrently, the variation of RI around the MMF sensing region will also modify the effective index difference between the LP0m and LP0n modes. This effect will induce changes in the
coupling conditions between the core and cladding modes to further result in a shift of the interference fringes as illustrated in Figure 1.14.
Figure 1.14. Transmission spectra for 20 mm and 40 mm sensor lengths in surrounding medium of air [76].
A spectral interference fringe for the 20 mm sensing length is observed at 1571.7 nm with 19.5 dB of power transmission, while for the 40 mm sensor, two spectral interference fringes are observed at 1539.33 nm and 1582.08 nm with power transmissions of 20 dB and 25 dB, respectively. A single-fringe signal is observed for the shorter MMF sensing length since, according to Equation (1.3), the phase difference between the guided modes is small, while the longer MMF sensor has a larger phase difference between the modes and being smaller according to
Equation (1.4) [76]. Hence, more interference fringes can be observed for the longer sensor. Further, Equation (1.4) predicts that a wider interference pattern spectrum will be obtained by the shorter sensor since it induces a weaker interference fringe amplitude compared to the longer MMF, as validated by Figure 1.14.
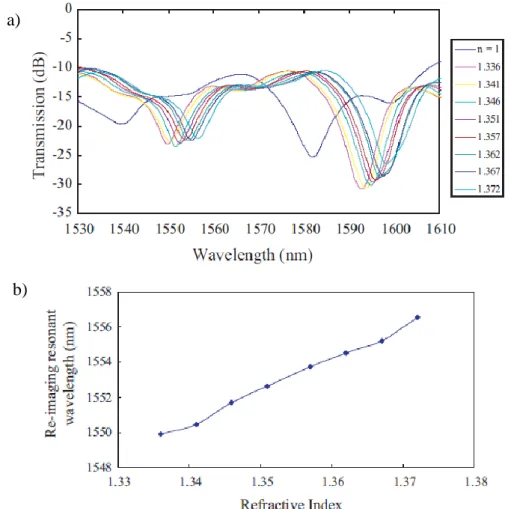
Figure 1.15 shows the response of the longer 40-mm refractometer employed for RI measurement having a better sensitivity (187.78 nm/RIU) with a fringe shift of 6.76 nm for a dynamic range from 1.336 to 1.372 RIU. The 20-mm sensor, as a comparison, has a fringe shift of 5.72 nm which is equivalent to 158.89 nm/RIU of sensitivity. From Figure 1.15(a), when the sensor is exposed to air, resonant wavelengths at 1539.33 nm and 1582.08 nm are observed. These then shift toward the longer wavelength spectrum for increasing medium index from 1.336 to 1.372 RIU. The resulting spectral response from the 40-mm sensor is plotted in Figure 1.15(b).
Figure 1.15. Experimental results from 40-mm MMI-based refractometer demonstrating [76] a) transmission spectra for different RIs, and b) resonant wavelength responses for different
RIs. a)
1.2.8. Fiber Bragg grating-based refractometers
A fiber Bragg grating (FBG) is an optical fiber whose core has been subject to a periodic refractive index modulation, resulting in a grating structure being permanently inscribed in the fiber core [27]. This grating functions as a wavelength-selective reflector or optical filter hence, only a particular wavelength is reflected into a backward propagating mode or signal while the remaining wavelengths are transmitted along the fiber after the grating to result in a forward-propagating mode. The reflected wavelength, which is also called the Bragg resonance wavelength, can be expressed by [77]
𝜆𝐵 = 2𝑛𝑒𝑓𝑓Λ (1.5)
where neff and are the effective modal index for the guided mode and the
periodicity or pitch of the core RI modulation, respectively. Any changes to neff
and/or due to external perturbations will thus modify B. Hence, a response to
longitudinal strain and temperature variations along the FBG can be estimated as a function of the shift in the Bragg wavelength (B) such that [78]
T T n T n l l n l n eff eff eff eff B 2 2 (1.6)
The first term on the right of Equation (1.6) represents the strain sensitivity (l/B),
while the second term represents the influence of temperature variation on B.
Therefore, the FBG can be employed for strain as well as temperature sensing. Under normal conditions, neff and, hence, B are not influenced by the external
environment since it is shielded by the cladding index. However, when the cladding is reduced or removed such as by an etching process, neff will become highly
sensitive to the surrounding medium in contact with the uniform FBG. Thus, any variation in the medium index will induce a shift in B as predicted by Equation
(1.5). Figure 1.16(a) illustrates a typical experimental set-up employed for RI measurement in which B is detected against variation in the surrounding medium
Figure 1.16. FBG-based refractometer [25]: a) schematic of experimental set-up, and b) response of Bragg wavelength shift to variation in surrounding index.
The FBG-based refractometer typically employs a broad-band superluminescent diode (SLD) operating at 1550 nm which is connected to the input arm of a directional coupler. Light is then transmitted to the sensor probe in the form of a Bragg grating which is immersed in the medium under investigation. The coupler's return arm is employed to collect the reflected spectrum from the FBG that can be subsequently analyzed by an optical spectrum analyzer (OSA) for a medium index ranging from 1.333 to 1.4547 RIU. As illustrated by Figure 1.16(b), B shifts toward
the shorter wavelength range for decreasing sensing medium index. This is a consequence of the diminution of neff as well as of the power of the fundamental
mode. Thus, for an OSA resolution of 1 pm at 1550 nm, a potential RI resolution of the order of ~10-5 to ~10-4 RIU could be achieved [25].
1.2.9. Long-period grating-based refractometers
Fiber gratings are classified into FBGs which have a smaller uniform sub-micron grating period or pitch , and long-period gratings (LPGs) which have much larger non-uniform grating periods or pitch [79]. Although FBG-based refractometers can
a)
demonstrate attractive RI sensing characteristics, they need to be suitably configured through cladding processing and by isolating the grating from temperature and strain perturbations in order to achieve the necessary performance since under normal operation, FBGs are intrinsically insensitive to external medium index variation [80, 81]. However, processing the cladding typically reduces the fiber diameter rendering the device very thin and fragile.
LPGs, on other hand, do not require any modification to the fiber cladding since the grating structure basically couples light from the fiber core into modes in the cladding. These cladding modes are hence inherently sensitive to external index variations. As illustrated in Figure 1.17, the light coupling between the propagating core mode and the co-propagating cladding modes occurs in the gating structure. Upon satisfying the phase matching condition between the fundamental core mode and cladding mode, a resonance wavelength res can be obtained, given by [81]
𝜆𝑟𝑒𝑠 = 𝑛𝑐𝑜 𝑒𝑓𝑓
− 𝑛𝑐𝑙 ,𝑚 𝑒𝑓𝑓
Λ (1.7)
Figure 1.17. Coupling of fundamental core mode into cladding modes in LPG [81].
In the LPG, 𝑛𝑐𝑜𝑒𝑓𝑓 represents the fundamental core mode and is principally isolated against the external sensing medium index while the cladding modes, defined by 𝑛𝑐𝑙 ,𝑚𝑒𝑓𝑓 , are exposed to the external medium. These will thus be influenced by its index variation. The sensitivity of 𝑛𝑐𝑙 ,𝑚𝑒𝑓𝑓 to external index variation, for example, of an LPG immersed in a medium (see Figure 1.18(a)), thus induces a shift in res according to
Equation (1.7). The transmission attenuation of the coupling mode is also concurrently altered, as measured experimentally in Figure 1.18(b).
Figure 1.18. LPG-based refractometer [79]: a) experimental set-up, and b) measurement results with a 20 mm LPG sensor.
The experimental results demonstrated a shift of res to the left by 1.4 nm (i.e. toward
the lower wavelength range) for an RI variation from 1 to 1.4 RIU or equivalent to 3.5 nm/ RIU of sensitivity, coupled with an increase in the optical power attenuation for increasing index [79].
1.2.10. Fiber-tip reflection-based refractometers
A simple and cost-effective RI measurement scheme can also be performed by exploiting Fresnel reflections at the tip of an optical fiber [33, 82-84]. Due to the index difference between the fiber core and the sensing medium, which can be given by [84]
𝑛𝑠𝑚 = 𝑛𝑐𝑜 1−10𝑅𝑒𝑛𝑑 /20
1+10𝑅𝑒𝑛𝑑 /20 , 𝑛𝑐𝑜 > 𝑛𝑠𝑚 (1.8)
a)
where nsm and nco represent the measured index and the fiber core index, respectively.
Also, Rend is the reflected power coefficient (in dB) due to Fresnel reflections at the
fiber end and can be calculated as a function of nco and the air index na through [84]
𝑅𝑒𝑛𝑑 = 𝑛𝑐𝑜−𝑛𝑎 𝑛𝑐𝑜+𝑛𝑎
2
(1.9)
A simple experimental set-up illustrated in Figure 1.19(a) can typically be employed for measuring liquid RI based on Fresnel's reflection principles. Lightwave from a tunable laser source is modulated by an optical/electrical (O/E) converter. This light is transmitted via an SMF coupler to the fiber tip which is immersed in the liquid being studied. The light is then reflected at varying degrees of intensity as a function of the liquid index, as predicted by Equations (1.8) and (1.9). Simulation and experimental results are also presented in Figure 1.19(b) to illustrate the response of the fiber-tip refractometer.
Figure 1.19. Fiber-tip refractometer based on Fresnel reflections [84]: a) experimental set-up, and b) simulation and experimental results.
Figure 1.19(b) shows very good agreement being achieved between simulation and the experimental measurements of Fresnel reflections at the fiber tip. Furthermore,
a)
this sensor has been found to have good repeatability over three measurements, with a standard deviation of 1.7 × 10⁻⁴ RIU [84].
1.2.11. Tapered optical fiber-based refractometers
Tapering an MMF is realized by reducing the MMF diameter into a “taper waist” form. A conventional MMF can thus be "linked" to two fiber tapers through a conical tapered sector called the "taper transition", as illustrated in Figure 1.20 [34]. At the taper transition, core modes are excited into cladding modes, which could then be guided within the cladding when the surrounding medium index is lower than that of the cladding. As these cladding modes are in direct contact with the sensing medium the subsequent evanescent waves generated in the cladding can be absorbed by the sensing medium. Furthermore, since the multimode fiber-based sensing section has a smaller diameter, higher evanescent wave absorption (EWA) can be achieved thus leading to an improved sensitivity [34].
Figure 1.20. Tapered MMF [34].
Results for three different tapered-fiber waist diameters with the same waist length L0 are reproduced in Figure 1.21 showing more losses occurring for increasing
medium index up to the cladding index value. In the lower index range, the smallest-diameter taper exhibits the highest sensitivity. However, for measured indices close
to the cladding index the highest sensitivity is obtained from the taper waist with the largest , together with the best resolution of 10-4 RIU.
Figure 1.21. Transmission output of tapered fiber-based refractometer for three different waist diameters [34].
1.2.12. D-shaped fiber-based refractometers
These refractometers measure RIs by exploiting EWA induced at the surface of a D-shaped fiber section in contact with the target medium. Any index variation in the medium will thus result in an attenuation of the transmitted optical power or intensity [37-39, 63]. Such a fiber can be fabricated by removing the outer surface of a plastic optical fiber (POF) over a specific length up to a certain depth to form a "D-shape" section. A typical D-shaped fiber obtained by the side-polishing method is illustrated in Figure 1.22 [38].
Figure 1.22. D-shaped optical fiber sensor [38].
Since the cylindrical fiber section is transformed into a D-shape, the effective V-parameter VD for this fiber can be expressed by [38]
𝑉𝐷 = 2𝜋𝑟𝑒𝑓𝑓(𝑑)
𝜆 𝑛𝑐𝑜 2− 𝑛
where reff represents the effective radius of the D-shaped fiber with respect to the
side-polished depth of the zone, while nco and nsm are the core and sensing medium
indices, respectively. Therefore, when nsm varies, VD will be modified according to
Equation (1.10). Consequently, the optical power ratio between the power confined in the core and that penetrated into the sensing medium as evanescent fields varies with nsm [38]. A typical experimental set-up for measuring RIs using a D-shaped
fiber-based refractometer is illustrated in Figure 1.23(a) while Figure 1.23(b) plots the subsequent response curves (transmission loss) as a function of RI variation in the sensing medium.
Figure 1.23. D-shaped optical fiber-based refractometer [38]: a) experimental set-up, and b) transmission loss occurring in 350 um groove depth.
The results obtained indicate that, for a sensor with a 350 µm groove depth, the optical power loss increases linearly with increasing nsm. Such a response occurs
since more evanescent waves penetrate into the sensing medium when its index increases, i.e. optical power is increasingly absorbed by the medium. Here, different concentrations of sucrose solutions were used to induce nsm variation from 1.333 to
1.455 RIU. a)
1.2.13. Stripped-clad multimode fiber (MMF)-based refractometer
Refractometers based on stripped-clad multimode fiber are realized by removing a certain length of the MMF cladding as the sensitive region [36, 57-62]. This device is similar to the dielectric rod refractometer [53-55]. Typically, the refractometer employs a plastic-clad silica (PSC) fiber due to the ease in removing the cladding part using a thermal stripper as illustrated in Figure 1.24.
Figure 1.24. Stripped-clad MMF as the sensing region in multimode fiber refractometer [61].
The sensing region is subsequently immersed in a liquid measurand as illustrated in Figure 1.25.
Figure 1.25. Experimental set-up to measure RI values of liquids using stripped-clad MMF [61].
Cole et al. propose 4 mathematical models to predict the guided power exploiting geometrical optic analysis [61]. The first model is used to calculate the guided power (Pt) along the MMF when the sensing medium index nsm is lower than the cladding
2 2
2 0 a 2 2 0 a cl co r t I n n D r I D dr rd I P
(1.11)where I is the light intensity, and ra/D represents the fiber‟s numerical aperture for
which ra represents the outer ray radius, while D represents the outer ray hypotenuse.
Further, when ncl nsm < nco, the mathematical model to estimate Pt under this
condition is influenced by mode loss due to the modified numerical aperture (NAmod
= (nco²-nsm²)0.5), and the corresponding reflectivity (R) from Fresnel reflections which
originate from the mode loss. The second model is represented by
R
n n
dr D r D I n n I dr d n n R D r I D dr rd I P r N r r sm co i cl co r t L r r sm co i t m m ) ( 2 2 2 2 0 an 2 2 2 0 2 2 0 a a i a , , 2 , ,
(1.12)where R(i, nco, nsm) = R(r, nco, nsm) is reflectivity from the mode loss by Fresnel
reflections as a function of r, nco, and nsm, while N(r) represents the number of
reflections along the sensitive region, given by N(r) = L/(2 tan i). The third model
predicts the guided power along the sensor when nsm = nco, which can be expressed
as 22 L I Pt (1.13)
Here, L and represent the sensing length and the MMF radius, respectively. The final or fourth model describes the power guided when nsm > nco. Under this
condition, the guiding mechanism is uniquely due to Fresnel reflections, and, hence, the model can be expressed as
R n n
dr D r D I dr d n n R D r I D dr rd I P r N r r sm co i r r N r r sm co i t m m ) ( 2 2 0 ) ( 2 2 0 2 2 0 a a a , , 2 , ,
(1.14)Using the models in Equations (1.12), (1.13) and (1.14), simulations have been realized and validated experimentally as illustrated in Figure 1.26.
Figure 1.26. Simulation and experimental results from a stripped-clad MMF refractometer [61].
When ncl nsm < nco, good agreement is obtained between the experimental and
simulation results. However, when nsm > nco a relatively high discrepancy occurs
between simulation and experiment. In addition, the first model in Equation (1.11) predicts that when nsm < ncl, the guided power does not change with varying nsm. In
this study [61] as well as in another by Arie et al. [57-59], the models proposed, in particular the first and second models, did not consider evanescent wave absorption. Nevertheless, under this condition (nsm < ncl), evanescent waves exist since the
lightwaves propagate along the MMF by total internal reflection (TIR). These evanescent waves will be absorbed by the sensing medium, and, hence, will contribute to the reduction in the guided optical power along the MMF.
In this thesis, therefore, 3 functional and accurate models will be developed to estimate the power response in MMF-based as well as in photonic crystal fiber (PCF)-based refractometers. Here, the mathematical models will exploit a combination of the ray optics approach, Gaussian beam analysis, and the EWA-related analytical equation. Ray optics is used in a similar manner to previous studies [57, 58] since it can represent the mode loss phenomenon for increasing nsm.
Gaussian beam analysis, on the other hand, is employed to accurately analyze the injected optical power distribution into the MMF. This thesis will therefore strive to reinforce existing work in MMF refractometry, for example that by Arie et al. who
proposed a relatively accurate approximation to determine the injected optical power distribution, albeit for beams launched from a lens system. In addition, Gaussian beam analysis can be employed for any launch conditions, i.e. for coupling condition using a lens through beam coupling from an SMF. The analytical equation of EWA is also employed since the propagation modes in the MMF occur principally by TIR, resulting in the generation of evanescent waves. Therefore, EWA must be considered to comprehensively describe the power response in the MMF as well as the PCF refractometers.
1.3. Comparison and conclusion
Refractometers based on prism optic are typically used for measuring the RI of sample media in the laboratory. They cannot, however, be used for continuous in situ measurements over long periods. For in situ and remote measurements, optical fiber-based refractometers are the most suitable alternative and can be divided into broad categories, those based on spectral interrogation and intensity measurement, respectively. Table 1.1 below gives a brief comparison of optical fiber refractometers exploiting spectral-based measurements.
Table 1.1. Optical fiber refractometers based on spectral measurements with OSAs having a typical resolution of ~1 pm.
Type of refractometer Cost Fabrication
difficulty Resolution (RIU) Dynamic range (RIU) SPR-based [18, 19, 73] +++ +++ 4×10⁻⁶ [18] 6.25×10⁻⁷ [19] 1.92×10⁻⁷ [73] 1.5375 - 1.5515 [18] 1.3353 - 1.3653 [19] 1.333 - 1.353 [73] MMI-based [23, 24, 76] ++ + 6×10⁻⁶ [23] 6.8×10⁻⁶ [24] 5.32×10⁻⁶ [76] 1.33 - 1.36 [23] 1.33 - 1.36 [24] 1.336 - 1.372 [76] FBG-based [25, 26, 28] ++ ++ 10-5 [25] 1.4×10⁻⁶ [26] 1.4×10⁻⁴ [28] 1.333 -1.4547 [25] 1 - 1.378 [26] 1.324 - 1.439 [28] LPG-based [31, 79] ++ ++ 7.69×10 -5 [31] 1.92×10⁻⁴ [79] 1.404–1.452 [31] 1.33 - 1.45 [79]
![Figure 1.3. The Abbé refractometer: a) the first Abbé refractometer designed by Ernest Abbé [66], and b) variants of the Abbé instrument [65]](https://thumb-eu.123doks.com/thumbv2/123doknet/2967980.82245/16.892.151.739.726.1064/figure-abbé-refractometer-refractometer-designed-ernest-variants-instrument.webp)
![Figure 1.4. Schematic of the Abbé refractometer, illustrating a) basic principle of the instrument [67], b) integrating Amici prisms within the telescope tube to compensate diffraction effects [67], and c) schematic of Abbé refractometer with Vernier dis](https://thumb-eu.123doks.com/thumbv2/123doknet/2967980.82245/17.892.151.767.443.1001/schematic-refractometer-illustrating-instrument-integrating-compensate-diffraction-refractometer.webp)
![Figure 1.6. a) Schematic of the basic principle of the Pulfrich refractometer [65], and b) simplified cross-section of the Pulfrich refractometer, with thermometer (T), sample compartment (S), prism (P), light source (L), transit circle (C), and telescop](https://thumb-eu.123doks.com/thumbv2/123doknet/2967980.82245/19.892.157.735.832.1070/schematic-principle-pulfrich-refractometer-simplified-refractometer-thermometer-compartment.webp)
![Figure 1.10. Hand-held digital refractometer [49] with a) schematic of the measurement principle, and b) sketch of the hand-held digital refractometer](https://thumb-eu.123doks.com/thumbv2/123doknet/2967980.82245/23.892.158.753.212.501/figure-digital-refractometer-schematic-measurement-principle-digital-refractometer.webp)
![Figure 1.13. Fiber-based MMI refractometry, a) using MMF-unclad MMF-MMF structure [75], b) using SMF-unclad MMF-SMF structure [24], and c) schematic diagram of complete](https://thumb-eu.123doks.com/thumbv2/123doknet/2967980.82245/26.892.160.681.447.908/figure-refractometry-unclad-structure-structure-schematic-diagram-complete.webp)
![Figure 1.16. FBG-based refractometer [25]: a) schematic of experimental set-up, and b) response of Bragg wavelength shift to variation in surrounding index](https://thumb-eu.123doks.com/thumbv2/123doknet/2967980.82245/30.892.185.715.124.539/figure-refractometer-schematic-experimental-response-wavelength-variation-surrounding.webp)
![Figure 1.19. Fiber-tip refractometer based on Fresnel reflections [84]: a) experimental set-up, and b) simulation and experimental results](https://thumb-eu.123doks.com/thumbv2/123doknet/2967980.82245/33.892.225.641.550.986/figure-refractometer-fresnel-reflections-experimental-simulation-experimental-results.webp)
![Figure 1.21. Transmission output of tapered fiber-based refractometer for three different waist diameters [34]](https://thumb-eu.123doks.com/thumbv2/123doknet/2967980.82245/35.892.255.656.199.496/figure-transmission-output-tapered-fiber-refractometer-different-diameters.webp)
![Figure 1.23. D-shaped optical fiber-based refractometer [38]: a) experimental set-up, and b) transmission loss occurring in 350 um groove depth](https://thumb-eu.123doks.com/thumbv2/123doknet/2967980.82245/36.892.157.688.425.817/figure-shaped-optical-refractometer-experimental-transmission-occurring-groove.webp)
