O
pen
A
rchive
T
OULOUSE
A
rchive
O
uverte (
OATAO
)
OATAO is an open access repository that collects the work of Toulouse researchers and
makes it freely available over the web where possible.
This is an author-deposited version published in :
http://oatao.univ-toulouse.fr/
Eprints ID : 16801
To link to this article : DOI : 10.1038/NMAT4318
URL :
http://dx.doi.org/10.1038/NMAT4318
To cite this version :
Griffin, John M. and Forse, Alexander C. and
Tsai, Wan-Yu and Taberna, Pierre-Louis and Simon, Patrice and
Grey, Clare P. In situ NMR and electrochemical quartz crystal
microbalance techniques reveal the structure of the electrical
double layer in supercapacitors. (2015) Nature Materials, vol. 14
(n° 8). pp. 812-819. ISSN 1476-1122
Any correspondence concerning this service should be sent to the repository
administrator:
staff-oatao@listes-diff.inp-toulouse.fr
In situ NMR and electrochemical quartz crystal
microbalance techniques reveal the structure of
the electrical double layer in supercapacitors
John M. Griffin
1, Alexander C. Forse
1, Wan-Yu Tsai
2,3, Pierre-Louis Taberna
2,3, Patrice Simon
2,3and Clare P. Grey
1,4*
Supercapacitors store charge through the electrosorption of ions on microporous electrodes. Despite major efforts to understand this phenomenon, a molecular-level picture of the electrical double layer in working devices is still lacking as few techniques can selectively observe the ionic species at the electrode/electrolyte interface. Here, we use in situ NMR to directly quantify the populations of anionic and cationic species within a working microporous carbon supercapacitor electrode. Our results show that charge storage mechanisms are different for positively and negatively polarized electrodes for the electrolyte tetraethylphosphonium tetrafluoroborate in acetonitrile; for positive polarization charging proceeds by exchange of the cations for anions, whereas for negative polarization, cation adsorption dominates. In situ electrochemical quartz crystal microbalance measurements support the NMR results and indicate that adsorbed ions are only partially solvated. These results provide new molecular-level insight, with the methodology offering exciting possibilities for the study of pore/ion size, desolvation and other effects on charge storage in supercapacitors.
T
he mechanism of charge storage in supercapacitors has traditionally been attributed to the electrosorption of ions on the surface of a charged electrode to form an electrical double layer. However, in recent years a number of empirical observations have shown that the mechanism is more complex, with factors such as relative pore/ion sizes1–3and desolvation effects4,5playingimportant roles. Theoretical studies have led the way in under-standing supercapacitor charging on the molecular level6,7, and have
demonstrated that charge screening8–10, ionic rearrangement11and
confinement12, and pore surface properties13 can have significant
effects on the capacitance and charging dynamics. Nevertheless, theoretical simulations necessarily depend on assumptions and sim-plifications, and many questions concerning details of the charging mechanisms in real devices remain unanswered. In particular, it is not clear whether charging is a purely adsorptive process, or whether exchange of one set of ions by those with opposite charge (referred to in this paper as ‘ion exchange’) and co-ion expulsion from the charged electrodes also contribute to the formation of the electrical double layer. Recently, in situ experimental methodolo-gies based on electrochemical quartz crystal microbalance (EQCM) techniques14,15and infrared spectroscopy16,17have started to address
these questions. These methods can observe ion adsorption and expulsion in charged electrodes, and have been able to distinguish purely adsorptive regimes from ion mixing during charging. How-ever, neither of these techniques alone permits the direct quantifica-tion of species within the electrical double layer in absolute terms, with EQCM measuring total mass changes in the electrode and infrared spectroscopy measuring only the ions outside the pores, and so an unambiguous picture of the charging mechanism has not yet been obtained.
One approach that has recently shown promise for the study of supercapacitors is nuclear magnetic resonance (NMR) spectroscopy. NMR has the advantage that it is element selective, thereby allowing individual ionic species to be observed independently18,19. Ex situ
NMR measurements on disassembled supercapacitor electrodes have revealed changes in the populations and local environments of ionic species that result from charging20. In situ NMR and magnetic
resonance imaging methods have also been developed, which allow changes in the local environments of the ions in the electric double layer to be observed for working devices21–24. These approaches
have provided qualitative insight into the charging mechanism for a range of electrolyte systems. However, in principle, NMR is fully quantitative and should enable the measurement of absolute ion populations at the electrode/electrolyte interface. In particular, the combination of NMR with EQCM, which tracks the displacement of all electrolyte species including solvent molecules, should provide a full description of the structure of the electric double layer.
Here, we use tetraethylphosphonium tetrafluoroborate(PEt4–BF4)
salt dissolved in acetonitrile (ACN) as the electrolyte, employing
31P and19F NMR experiments to enable the selective observation of
the PEt4cations and BF4anions, respectively. Deuterated ACN was
also used to enable the observation of solvent species by2H NMR
(as described in Supplementary Information). Experiments have been performed on commercial YP-50F activated carbon, for which gas sorption measurements show an average pore size of 0.9 nm with 92% of pores being smaller than 2 nm. The specific surface area is 1,730 m2g−1and the total pore volume is 0.75 cm3g−1(see
Supplementary Information).
Supercapacitor bag cells were constructed following a shifted ‘overlaid’ design, allowing a single electrode to be studied
1Department of Chemistry, University of Cambridge, Lensfield Road, Cambridge CB2 1EW, UK.2Université Paul Sabatier Toulouse III, CIRIMAT,
UMR-CNRS 5085, F-31062 Toulouse, France.3Réseau sur le Stockage Electrochimique de l’Energie (RS2E), FR CNRS 3459, France.4Department of
Ex-pore Ex-pore In-pore In-pore 1.5 M 0.75 M 0.5 M
Cations observed Anions observed
a b c −150 −160 −140 −170 −150 −160 −140 −170 50 40 δ31P (ppm) δ18F (ppm) 30 20 In-pore δ31P (ppm) δ31P (ppm) δ19F (ppm) 50 40 30 20 d −150 −160 −140 −170 δ19F (ppm) In-pore e f In-pore 50 40 30 20 In-pore
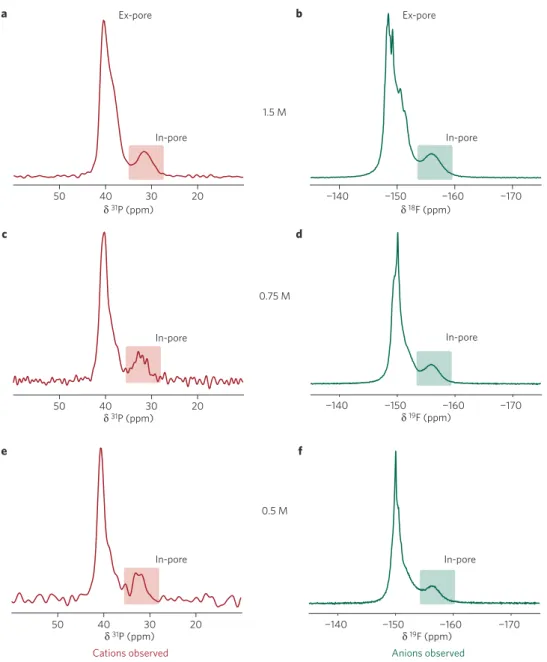
Figure 1 | NMR spectra of individual supercapacitor electrodes showing in- and ex-pore cation and anion environments. a–f,31P (a,c,e) and19F (b,d,f)
NMR spectra were recorded for electrolyte concentrations of 1.5 M (a,b), 0.75 M (c,d) and 0.5 M (e,f). Supercapacitors were held at a cell voltage of 0 V. The in-pore resonances in each spectrum are highlighted.
independently inside the NMR coil whilst maintaining good capacitive properties22. Electrodes were fabricated using 95 wt%
YP-50F and 5 wt% PTFE binder (see Methods). Figure 1 shows
31P and19F NMR spectra of individual supercapacitor electrodes
in cells held at 0 V with electrolyte concentrations of 1.5, 0.75 and 0.5 M. In each spectrum, intense ‘ex-pore’ resonances are observed at 40 ppm (31P) and −150 ppm (19F), corresponding to ions located
in voids between carbon particles and in electrolyte that resides in a small reservoir between the two electrodes. Small features visible in the ex-pore resonances are due to susceptibility effects associated with the bag cell components and geometric anisotropy of the cell21,22. Weaker ‘in-pore’ resonances corresponding to ions
inside the micropores close to carbon surfaces are also observed, shifted to lower frequency by 5–7 ppm. The shift of the in-pore resonance from that of the ex-pore resonance is due to diamagnetic nucleus-independent chemical shift (NICS, often referred to as ‘ring current’) effects associated with the delocalized electrons in the predominantly sp2-bonded carbon surface22,25. Calculations
indicate that the NICS effect should be significant for species within
a few ångstroms from the carbon surface. However, the effects of dynamics must also be considered as fast exchange between different positions within a pore will result in an averaging of the observed chemical shift. Taking this into account, NICS values of around 5 ppm have been predicted for species inside pores up to 2 nm in width, consistent with the shifts observed here25.
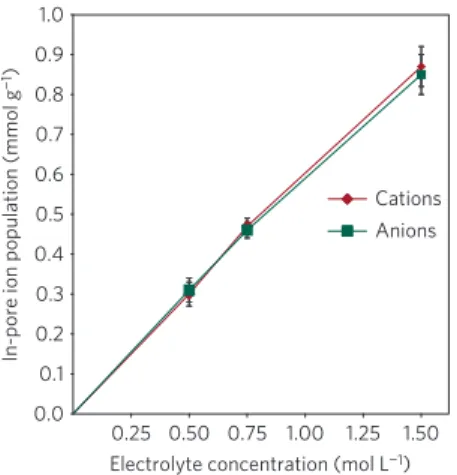
Through comparison of the in-pore resonance intensities with calibration samples, it is possible to quantify the number of in-pore species in absolute terms and gain insight into the adsorption properties. In-pore ion populations are plotted as a function of electrolyte concentration in Fig. 2. For the three electrolyte concentrations studied, in-pore anion and cation populations at 0 V are balanced and vary approximately linearly with the concentration. Using estimated solvated ion diameters of 1.35 nm (PEt4
+
) and 1.16 nm (BF4 −
; ref. 26; see Supplementary Information) and the measured ion uptakes at 0 V, we find that the in-pore ions should occupy a total volume of 1.12 cm3(1.5 M electrolyte),
0.56 cm3(0.75 M electrolyte) and 0.37 cm3 (0.5 M electrolyte) per
0.25 0.1 0.2 0.3 0.4 0.5 0.6 0.7 0.8 0.9 0.50 0.75 1.00 1.25 1.50 Cations Anions 1.0 0.0
Electrolyte concentration (mol L−1)
In-pore ion population (mmol g
−1)
Figure 2 | In-pore ion populations per gram of YP-50F at 0 V plotted as a function of concentration for the PEt4-BF4/ACN electrolyte. Error bars represent the range of values obtained from measurements performed on two separate electrodes within each calibration cell (see Supplementary Information). For each concentration, equal populations of cations and anions are adsorbed and the total in-pore ion population varies approximately linearly with electrolyte concentration.
in-pore ions estimated on this basis is significantly larger than the total pore volume of 0.75 cm3g−1for YP-50F. This indicates that for
this concentration, the assumption of each ion having a complete ACN solvation shell is not valid; instead, the ions must be more densely packed inside the micropores, with partial desolvation or overlap of their solvation shells.
To investigate changes in the in-pore ion behaviour during charging, in situ NMR experiments were performed as the supercapacitor cells were charged sequentially from total cell voltages of 0 to 1.5 V in steps of 0.25 V. They were then discharged in a single step to 0 V, before being charged in steps of −0.25 to −1.5 V. 19F and 31P in situ NMR spectra were acquired at each
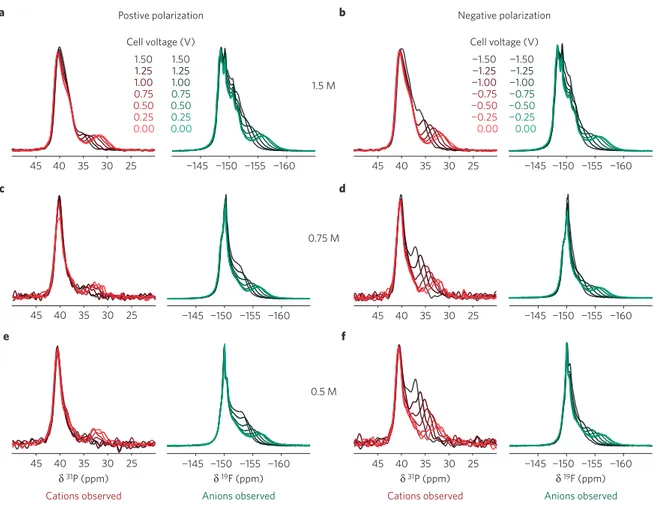
voltage (Fig. 3) after cells had been held for 60 min (1.5 and 0.75 M electrolyte) or 90 min (0.5 M electrolyte), until a negligible constant residual current was obtained (see Supplementary Information). In both voltage ranges, the in-pore cation and anion resonances move to higher frequency in the NMR spectra as the cells are charged. This is consistent with previous results21–23and is due to changes in the
NICSs that result from the electronic charge that is developed within the carbon electrode: charging of π-bonded carbon systems gives rise to so-called paratropic or anti-aromatic ring currents, which result in positive NICSs for nearby species22.
Whereas the frequencies of the in-pore resonances depend on the electronic charge state of the electrode surface, importantly, the intensities of the in-pore resonances correspond to the number of in-pore ions within the electrode. As the cell potentials are varied, changes in the in-pore resonance intensities reflect the changing ion populations within the electrical double layer that is formed at the electrode/electrolyte interface within the micropores. In the positive voltage range, the in-pore resonances in the 19F NMR
spectra increase in intensity as the cell is charged, showing that anions are absorbed into the micropores during charging. For the negative voltage range, an increase in the in-pore cation population is observed in the31P NMR spectra as cations are absorbed into
the micropores. These results provide a qualitative picture that is consistent with the accepted view of supercapacitor charging: as electronic charge accumulates within the electrode, ions of opposite charge are adsorbed onto the surface to form an electric double layer. Absolute ion populations determined from the deconvoluted in-pore resonance intensities, plotted in Fig. 4, offer more quantitative insight and provide a detailed compositional picture of the electrical double layer during charging. Interestingly, for the positive cell
voltage range, we find that the charging mechanism is not a purely adsorptive process. For all electrolyte concentrations, the in-pore anion population increases together with a simultaneous decrease in the in-pore cation population. This shows that charge storage is actually driven by ion exchange, whereby anions are absorbed into the micropores while cations are simultaneously ejected. This leads to an overall negative ionic charge, which forms an electrical double layer with the positive electronic charge that accumulates on the electrode surface. Over the voltage range studied, the number of cations ejected from the micropores is approximately equal to the number of anions adsorbed, meaning that the total number of in-pore ions does not change significantly. For the 0.5 M electrolyte, an apparent increase in in-pore cation population is observed between 1.0 → 1.5 V. However, for these voltages we note that there are larger uncertainties in deconvoluting the very low-intensity in-pore resonances in the experimental31P NMR spectra. In the
negative voltage range, a different charging mechanism is observed: between 0 → −1.5 V, the in-pore cation population increases for all electrolyte concentrations, but there are no significant changes in the in-pore anion populations. For each electrolyte concentration, the relative change in the cation population is approximately double that observed in the positive charging regime, thus preserving electroneutrality. Therefore, charge storage in the negative voltage range is dominated by counter-ion adsorption, with an overall increase in the number of in-pore ions. Note that whereas the electrochemical stability window of ACN-based electrolytes can be as large as 3 V, the potential range studied here was limited to ±1.5 V owing to the significant overlap of the in-pore and ex-pore resonances at >1.5 V.
It is straightforward to determine the total ionic charge within the carbon electrode at each voltage step by summing the positive and negative charges associated with the in-pore ion populations. For the three concentrations studied, we find good overall agreement between the ionic charge inside the micropores and the stored electronic charge (Fig. 5), the latter being determined from integration of the current versus time plots at each voltage step. At high voltages between 1 and 1.5 V for the 0.5 M electrolyte, a noticeable deviation is observed; this is, at least in part, related to the difficulty in accurately deconvoluting the weak 31P
in-pore resonance intensity at these voltages, with the weak signal overlapping with the stronger signal from the ex-pore ions. The overall agreement between the ionic and electronic charge shows that the ions in the in-pore environment (within a few nanometres from the electrode surface) are primarily responsible for charge storage.
To probe the local environments of the solvent molecules, in situ 2H NMR spectra were recorded for a supercapacitor cell containing 1.5 M electrolyte (see Supplementary Information). The resonances corresponding to in-pore and ex-pore/ACN solvent molecules are much broader, probably as a result of faster exchange processes affecting the highly mobile solvent molecules, precluding an accurate deconvolution of in-pore resonance intensities. Instead, to gain further information about the charging mechanisms and behaviour of the solvent molecules, the same system was studied in situ using an EQCM. Particles of YP-50F carbon were deposited on a piezoelectric quartz crystal resonator whose resonance frequency can be related to the mass of the crystal electrode through the Sauerbrey equation27, thus providing information
about the ion and solvent molecule fluxes during the charging of the porous carbon electrode. The carbon-coated resonator was used as a working electrode in a three-electrode EQCM cell containing PEt4–BF4/ACN electrolyte at the intermediate concentration of
0.75 M. In contrast to previous EQCM studies, which probed dynamic charging using cyclic voltammetry experiments14,15,
measurements were performed under steady-state conditions (that is, at fixed voltages) to mirror the NMR experimental methodology.
Cell voltage (V) Cell voltage (V) Postive polarization Negative polarization
1.25 1.50 1.00 0.75 0.50 0.25 0.00 −1.25 −1.50 −1.00 −0.75 −0.50 −0.25 0.00 1.25 1.50 1.00 0.75 0.50 0.25 0.00 −1.25 −1.50 −1.00 −0.75 −0.50 −0.25 0.00 −145 −150 −155 −160 45 40 35 30 25 −145 −150 −155 −160 45 40 35 30 25 −145 −150 −155 −160 45 40 35 30 25 −145 −150 −155 −160 45 40 35 30 25 −145 −150 −155 −160 45 40 35 30 25 −145 −150 −155 −160 45 40 35 30 25 a b c d e f δ31P (ppm) δ19F (ppm) δ31P (ppm) δ19F (ppm)
Cations observed Anions observed Cations observed Anions observed
1.5 M
0.75 M
0.5 M
Figure 3 | In situ31P and19F NMR spectra of individual supercapacitor electrodes at different states of charge. a–f, Spectra recorded in the range 0 to 1.5 V (a,c,e) and in the range 0 to −1.5 V (b,d,f). Electrolyte concentrations are 1.5 M (a,b), 0.75 M (c,d) and 0.5 M (e,f). In-pore anion intensities increase for positive charging, whereas in-pore cation intensities increase for negative charging.
These steady-state experiments should be less influenced by the kinetics of adsorption; rather, a complete reorganization of the ions and solvent molecules in the pores to approach the lowest-energy arrangements is possible.
The electrode was polarized from the open-circuit voltage (OCV) of 0.43 V versus the Ag reference electrode up to +0.7 V versus Ag in steps of 0.1 V. The electrode was then discharged to the OCV before being charged to 0 V versus Ag in steps of −0.1 V. The electrode was held at each voltage for 120 s until a constant residual current was obtained (Supplementary Fig. 9 in Supplementary Information). The initial OCV was close to the point of zero charge (PZC) of the electrode (0.49 V versus Ag), with the PZC being measured in a separate experiment (see Supplementary Information). The sequence was repeated several times to ensure reproducibility of the results. The low carbon loading on the resonator (tens of micrograms) restricts the electrochemical window such that purely capacitive behaviour is observed only in the potential range 0 ↔+0.7 V versus Ag. Outside this window, there are significant redox contributions to the total current (see Supplementary Fig. 10 in Supplementary Information). Measured mass changes (normalized by the electrochemically active area of the quartz resonator, 1.27 cm2) are plotted as a function
of the electrode potential in Fig. 6a. The mass of the electrode is observed to increase at negative potentials relative to the OCV. This behaviour is qualitatively consistent with the adsorption-driven charging mechanism inferred from the NMR data, the absorption of cations into the micropores with no significant change in the anion population resulting in an increase in the total number of ions and hence mass of the electrode. For positive potentials relative to OCV,
the electrode mass is found to decrease slightly over the potential range studied. This behaviour is consistent with the ion exchange-driven charging mechanism determined from the NMR data. The adsorption of anions and simultaneous expulsion of cations from the electrode can result in an overall decrease in the total in-pore ionic mass because the BF4anions have a significantly smaller mass
(86.8 g mol−1) than the PEt
4cations (147 g mol−1).
It is possible to gain a more quantitative interpretation of the EQCM results by comparing the experimental mass changes with theoretical values calculated assuming different models for the charging mechanism. Figure 6b shows the experimental mass changes plotted as a function of the capacitive charge stored on the electrode, calculated by integrating current versus time plots using Faraday’s law15. Theoretical mass changes based on
two different charging mechanisms are also shown. For the first model, a purely adsorptive mechanism is considered, based on the traditional assumption that one negative (positive) charge stored in the electrode is balanced by the adsorption of a single cation (anion) on the electrode surface. For the second model, an ion exchange mechanism was assumed whereby for positive (negative) electrode polarization, two charges stored on the electrode surface are compensated by the adsorption of one anion (cation) and desorption of one cation (anion). For negative polarization, the purely adsorptive model (green triangles) predicts the largest mass change, although the measured mass changes are much higher than those predicted by either model across the entire potential range. In contrast to the NMR data shown in Fig. 3, which selectively observe in-pore cation and anion populations, mass changes measured by EQCM originate from all electrolyte species
a b 0.0 −0.5 0.2 0.4 0.6 0.8 1.0 1.2 1.4 0.2 0.4 0.6 0.8 1.0 1.2 1.4 0.5 1.0 1.5 −1.0 −1.5 Cell voltage (V) 0.0 −0.5 0.5 1.0 1.5 −1.0 −1.5 Cell voltage (V) 0.0 −0.5 0.5 1.0 1.5 −1.0 −1.5 Cell voltage (V) In-por e ion population (mmol g −1) In-por e ion population (mmol g −1) In-por e ion population (mmol g −1) Anions Cations Anions Cations c 0.2 0.4 0.6 0.8 1.0 1.2 1.4 Anions Cations 1.5 M 0.75 M 0.5 M
Figure 4 | In-pore ion populations for supercapacitor electrodes at different states of charge in the range −1.5 V to +1.5 V. a–c, In-pore ion populations
for electrolyte concentrations of 1.5 M (a), 0.75 M (b) and 0.5 M (c). Values are given as milimoles per gram of YP-50F carbon in a single electrode. Error bars represent the range of values obtained from four independent fits of each dataset. Lines joining the data points are a guide to the eye. Ion exchange is observed for positive charging whereas cation adsorption dominates for negative charging.
(including solvent molecules) that enter and leave the porous electrode. As the NMR data show that the anion population remains approximately constant during negative polarization (that is, a purely adsorptive mechanism is operating), the additional mass observed experimentally must originate from the co-absorbed solvent molecules. The slope of a linear fit of the experimental mass change versus charge gives an experimental molar mass of 369 g mol−1 per adsorbed species (from Faraday’s law). Assuming
that the adsorbed species are PEt4cations (justified on the basis of
the NMR results), we can estimate a cation solvation number of 5.4. This value is slightly lower than the solvation number of 7 predicted for chemically similar NEt4cations in bulk solution26, indicating that
cations are partially desolvated when they enter the pores of the microporous carbon.
For positive polarization, Fig. 6b shows that the purely adsorptive model again predicts a mass increase as BF4anions are absorbed
into the micropores. This is not in agreement with the experimental data, where a slight mass decrease is observed. In contrast, the ion exchange model (orange squares) predicts a slight decrease in electrode mass during charging. This is because heavier PEt4cations
(147.2 g mol−1) are replaced by an equal number of lighter BF 4
anions (86.8 g mol−1) in the electrode. This model gives better
agree-ment with the experiagree-mental values, where a mass decrease is also observed. Although it was not possible to extract clear information regarding the solvation number because of the limited accessible voltage window at positive potentials (up to 0.7 V versus Ag) and low deposited mass of carbon, the fact that change of the electrode mass follows that predicted by the NMR results confirms that the charging mechanism is driven by ion exchange in the potential range studied. For the 0.75 and 0.5 M electrolyte concentrations, a large fraction of the cations are expelled at the highest potential studied by NMR (+1.5 V, see Fig. 4b,c). As a consequence, the purely adsorptive mechanism must start to become important at higher potential when all cations have been expelled from the electrode. However, the restricted potential range of the EQCM measurements (from 0 to 0.7 V versus Ag) prevents high polarization states from being reached. We note that in this regime (>1.5 V), the EQCM response would be expected to change to show increasing mass for the positive electrode (reflecting a purely adsorptive mechanism). This behaviour should be contrasted with previous EQCM studies of a range of organic and aqueous electrolytes under dynamic charging conditions14,15,28,29. In general, a minimum in the mass change curve
(referred to as the potential of zero mass change, PZMC) was ob-served close to the PZC. In such cases, the PZMC can be attributed
to the transition between anion adsorption-dominated and cation adsorption-dominated charge storage mechanisms in positive and negative charging regimes, respectively. For the PEt4-BF4/ACN
elec-trolyte studied here, the larger mass of the cations compared with the anions, together with the ion exchange mechanism in the positive charging regime, means that there is a significant disparity between the PZMC and PZC (that is, the PZMC ≫ PZC), and so the PZMC is not observed in the potential range studied.
The combined NMR–EQCM approach provides a full picture of the charge storage mechanism over the potential range studied. At a cell voltage of 0 V, the electrode is wetted by equal numbers of anions and cations, which are densely packed inside the micropores and partially desolvated for high electrolyte concentrations. On charging, for negative potentials the electronic charge stored on the electrode surface is balanced by the absorption of cations into the micropores. For positive potentials, the stored electronic charge is balanced by the absorption of anions into the micropores and simultaneous expulsion of cations.
The asymmetry in ion sizes may be one reason for the different mechanisms in the two charging regimes. Ion and solvent reorganization inside the micropores may play a role in determining this: packing inside the pores may be more efficient with excess cations than for excess anions, so that more charge can be accommodated at negative potentials without having to expel the co-ions. Of note, the EQCM measurements for the current system indicate that the adsorbed cations also carry additional solvent molecules into the pores, which means that even more space has to found inside the micropores as the electrode is charged. Under the steady-state conditions employed here, and in contrast to dynamic measurements performed in other EQCM studies, solvent molecules will have time to reorder so that they can take up less space. We note that the ordering of propylene carbonate solvent molecules within micropores has recently been observed by X-ray total scattering experiments30.
Pair distribution function analysis identified a shortening of the average intermolecular distance by approximately 0.05 Å as compared with bulk solution, interpreted as a densification of the packing of the propylene carbonate molecules through vertical alignment. It is also possible that the micropores may expand during charging to accommodate the additional adsorbed species. Indeed, the expansion of micropores during charging has recently been proposed on the basis of electrochemical dilatometry experiments31.
Electrochemical quartz crystal admittance measurements, which sense mechanical changes in the carbon electrode, have also revealed
a 20 40 60 80 |T otal char ge| ( C g −1) 0.0 −0.5 0.5 1.0 1.5 −1.0 −1.5 Cell voltage (V) 1.5 M Ionic charge Electronic charge b 20 40 60 80 |T otal char ge| ( C g −1) Cell voltage (V) 0.0 −0.5 0.5 1.0 1.5 −1.0 −1.5 0.75 M Ionic charge Electronic charge c 20 40 60 80 Cell voltage (V) |T otal char ge| ( C g −1) 0.0 −0.5 0.5 1.0 1.5 −1.0 −1.5 Ionic charge 0.5 M Electronic charge
Figure 5 | Comparisons of the magnitudes of ionic and electronic charge stored on supercapacitor electrodes in the range −1.5 V to +1.5 V. a–c, Charge comparisons for electrolyte concentrations of 1.5 M (a),
0.75 M (b) and 0.5 M (c). Values are given as coulombs per gram of YP-50F carbon in a single electrode. Error bars are derived from the combination of errors in the anion and cation populations at each voltage. Lines joining the data points are a guide to the eye. Good overall agreement between the stored electronic charge and ionic charge is observed across the voltage range studied.
distortion of microporous carbon particles during charging, possibly indicating an increase in pore volume29. The results
presented here should be contrasted with our earlier work on a 1.5 M tetraethylammonium tetrafluoroborate (NEt4–BF4)/ACN
electrolyte22. In that work, only the anions were monitored by19F
NMR; for negative potentials the in-pore anion population changed only slightly on charging to −0.5 V (as seen here), after which it dropped to approximately 20% of the initial value at −1.25 V. At positive potentials, the in-pore anion population remained constant until approximately 0.75 V before increasing steadily. Although we can only indirectly infer NEt4cation behaviour, these results suggest
that charge is stored through the cation adsorption mechanism now in a different potential window (−0.5 to +0.75 V (NEt4+)
versus −1.5 to 0 V (PEt4 +
)). It is possible that the screening between cations may be worse for the smaller, less polarizable NEt4cations, disfavouring dense cation packing, and reducing the
negative voltage threshold at which anions are expelled from the pores. Differential solvation effects for the two types of cation may also be important.
Kinetic phenomena cannot be totally excluded. Unlike the current study that was performed on a pristine cell, the cells in
a b 0 1 4 6 2 3 5 0.0 0.1 0.2 0.3 0.5 0.7 Experimental
Calculated (purely adsorptive) Calculated (exchange) Linear fit
0.4 0.6 Electrode voltage versus Ag (V)
OCV PZC ∆ m ( µ g cm −2) ∆ m ( µ g cm −2) Capacitive charge (mC cm−2) 0.0 −0.5 −1.0 0.5 −1.5 0 4 5 3 1 6 2
Figure 6 | EQCM data for a YP-50F electrode in 0.75 M PEt4–BF4/ACN
electrolyte. a, Electrode mass change, 1m, plotted as a function of
potential during polarization. The vertical dashed lines denote the open-circuit voltage (OCV) and point of zero charge (PZC). A mass increase is measured for negative polarization, whereas a mass decrease is measured for positive polarization. b, Comparison of experimental and calculated electrode mass changes plotted as a function of capacitive charge during polarization. Calculated mass changes are based on a purely adsorptive mechanism (green triangles) and an ion exchange mechanism (orange squares). The grey horizontal line denotes zero mass change. For negative polarization, a linear fit to the data (dashed line) shows that experimental mass changes are larger than predicted by the purely adsorptive model, indicating that solvent molecules are also adsorbed. For positive polarization, the ion exchange mechanism gives best agreement with the negative mass change observed experimentally.
the previous study22were cycled multiple times between 0–2.3 V
before the NMR measurements. Furthermore, magnetic resonance imaging experiments, albeit under non-steady-state conditions, have indicated that changes in in-pore ion populations can occur in the first several cycles24; this will further affect ion transport
and ordering in the electrode during charging. In the current study, the adsorption of larger cations at negative polarizations could present steric hindrance to anions leaving the pores. However, the steady-state conditions employed in this work, and the rapid mobility of both the cations and anions, should allow ions and
solvent molecules to reorganize within the pores (and within the electrolyte) to approach the lowest-energy state. Hence, it is unlikely that kinetic effects are dominant in determining the in-pore ionic populations at different charge states, unless the differences in energy between ion exchange and ion adsorption are very small. Experiments are underway to study an even wider range of systems under both static and dynamic charging conditions to explore these phenomena further.
The experiments provide definitive evidence that over most potential ranges the electrical double layer formed during charging is not composed of a single counter-ionic species, with the NMR results showing that significant numbers of co-ions can remain inside the micropores during charging in both the positive and negative voltages ranges. However, for the positive electrode in the 0.5 M concentration electrolyte the cations are almost completely ejected from the electrode at a cell voltage of around 1 V while anions continue to be adsorbed. Mean field theory and simulations have shown that for certain pore/ion size ratios, a ‘jump’ in capacitance can be expected for such a case, that is, where the applied potential is sufficiently high to drive the co-ions out of the pore but is not high enough to fill the pores completely with counter-ions10,32. No significant capacitance increase was measured
for the 0.5 M concentration electrolyte as compared to the 1.5 M electrolyte (both yielding capacitances of approximately 100 F g−1
(see Supplementary Information)); however, it may be that factors such as charge screening by solvent molecules or the appreciable pore-size distribution of YP-50F mask any effects in this case. Future investigations will enable a better fundamental understanding of the relative importance of these effects for the optimization of capacitive properties.
In conclusion, we have used in situ NMR spectroscopy to quantify fully the cationic and anionic species within the electrical double layer in a working supercapacitor electrode. The combination of in situ NMR and EQCM measurements also gives further information on solvent uptake during charging that is not possible using either technique alone. Our results provide a direct molecular-level insight into the charge storage process in microporous carbon electrodes, and show that the charging mechanisms differ depending on the polarization of the electrode surface. The methodology introduced here opens the way for the study of factors such as relative pore/ion size, and concentration and solvent effects on the ionic composition of the electric double layer during charging, questions that are at the heart of current efforts to optimize and improve the energy storage capabilities of supercapacitors.
Methods
Methods and any associated references are available in theonline version of the paper.
References
1. Salitra, G., Soffer, A., Eliad, L., Cohen, Y. & Aurbach, D. Carbon electrodes for double layer capacitors. I. Relations between ion and pore dimensions. J. Electrochem. Soc. 147, 2486–2493 (2000).
2. Chmiola, J. et al. Anomalous increase in carbon capacitance at pore sizes less than 1 nanometer. Science 313, 1760–1763 (2006).
3. Largeot, C. et al. Relation between the ion size and pore size for an electric double-layer capacitor. J. Am. Chem. Soc. 130, 2730–2731 (2008).
4. Vix-Guterl, C. et al. Electrochemical energy storage in ordered porous carbon materials. Carbon 43, 1293–1302 (2005).
5. Chmiola, J., Largeot, C., Taberna, P.-L., Simon, P. & Gogotsi, Y. Desolvation of ions in subnanometer pores and its effect on capacitance and double-layer theory. Angew. Chem. Int. Ed. 47, 3392–3395 (2008).
6. Fedorov, M. V. & Kornyshev, A. A. Ionic liquids at electrified interfaces. Chem. Rev. 114, 2978–3036 (2014).
7. Burt, R., Birkett, G. & Zhao, X. S. A review of molecular modeling of electric double layer capacitors. Phys. Chem. Chem. Phys. 16, 6519–6538 (2014).
8. Feng, G. & Cummings, P. T. Supercapacitor capacitance exhibits oscillatory behaviour as a function of nanopore size. J. Phys. Chem. Lett. 2,
2859–2864 (2011).
9. Wu, P., Huang, J., Meunier, V., Sumpter, B. G. & Qiao, R. Complex capacitance scaling in ionic liquids-filled nanopores. ACS Nano 5, 9044–9051 (2011). 10. Kondrat, S. & Kornyshev, A. Superionic state in double-layer capacitors
with nanoporous electrodes. J. Phys. Condens. Matter 23, 022201 (2011).
11. Merlet, C. et al. On the molecular origin of supercapacitance in nanoporous carbon electrodes. Nature Mater. 11, 306–310 (2012).
12. Merlet, C. et al. Highly confined ions store charge more efficiently in supercapacitors. Nature Commun. 4, 2701 (2013).
13. Kondrat, S., Wu, P., Qiao, R. & Kornyshev, A. A. Accelerating charging dynamics in subnanometre pores. Nature Mater. 13, 387–393 (2014). 14. Levi, M. D., Salitra, G., Levy, N., Aurbach, D. & Maier, J. Application of a
quartz-crystal microbalance to measure ionic fluxes in microporous carbons for energy storage. Nature Mater. 8, 872–875 (2009).
15. Tsai, W.-Y., Taberna, P.-L. & Simon, P. Electrochemical quartz crystal microbalance (EQCM) study of ion dynamics in nanoporous carbons. J. Am. Chem. Soc. 136, 8722–8728 (2014).
16. Richey, F. W., Dyatkin, B., Gogotsi, Y. & Elabd, Y. A. Ion dynamics in porous carbon electrodes in supercapacitors using in situ infrared
spectroelectrochemistry. J. Am. Chem. Soc. 135, 12818–12826 (2013). 17. Richey, F. W., Tran, C., Kalra, V. & Elabd, Y. A. Ionic liquid dynamics in
nanoporous carbon nanofibers in supercapacitors measured with in operando infrared spectroelectrochemistry. J. Phys. Chem. C 118, 21846–21855 (2014).
18. Forse, A. C. et al. Nuclear magnetic resonance study of ion adsorption on microporous carbide-derived carbon. Phys. Chem. Chem. Phys. 15, 7722–7730 (2013).
19. Borchardt, L., Oschatz, M., Paasch, S., Kaskel, S. & Brunner, E. Interaction of electrolyte molecules with carbon materials of well-defined porosity: Characterization by solid-state NMR spectroscopy. Phys. Chem. Chem. Phys.
15,15177–15184 (2013).
20. Deschamps, M. et al. Exploring electrolyte organization in supercapacitor electrodes with solid-state NMR. Nature Mater. 12, 351–358 (2013). 21. Wang, H. et al. Real-time NMR studies of electrochemical double-layer
capacitors. J. Am. Chem. Soc. 133, 19720–19273 (2011).
22. Wang, H. et al. In situ NMR spectroscopy of supercapacitors: Insight into the charge storage mechanism. J. Am. Chem. Soc. 135, 18968–18980 (2013). 23. Griffin, J. M. et al. Ion counting in supercapacitor electrodes using NMR
spectroscopy. Faraday Discuss. 176, 49–68 (2014).
24. Ilott, A. J., Trease, N. M., Grey, C. P. & Jerschow, A. Multinuclear in situ magnetic resonance imaging of electrochemical double-layer capacitors. Nature Commun. 5, 4536 (2014).
25. Forse, A. C., Griffin, J. M., Presser, V., Gogotsi, Y. & Grey, C. P. Ring current effects: Factors affecting the NMR chemical shift of molecules adsorbed on porous carbons. J. Phys. Chem. C 118, 7508–7514 (2014).
26. Kim, Y.-J., Masutzawa, Y., Ozaki, S., Endo, M. & Dresselhaus, M. S. PVDC-based carbon material by chemical activation and its application to nonaqueous EDLC. J. Electrochem. Soc. 151, E199–E205 (2004).
27. Sauerbrey, G. Verwendung von Schwingquarzen zur Wägung dünner Schichten und zur Mikrowägung [The use of resonance quartz crystals for weighing thin layers and as a microbalance]. Z. Phys. 155, 206–222 (1959).
28. Levi, M. D. et al. Electrochemical quartz crystal microbalance (EQCM) studies of ions and solvents insertion into highly porous activated carbons. J. Am. Chem. Soc. 132, 13220–13222 (2010).
29. Levi, M. D., Sigalov, S., Aurbach, D. & Daikhin, L. In situ electrochemical quartz crystal admittance methodology for tracking compositional and mechanical changes in porous carbon electrodes. J. Phys. Chem. C 117, 14876–14889 (2013).
30. Fukano, M. et al. Vertically oriented propylene carbonate molecules and tetraethyl ammonium ions in carbon slit pores. J. Phys. Chem. C 117, 5752–5757 (2013).
31. Hantel, M. M., Presser, V., Kötz, R. & Gogotsi, Y. In situ electrochemical dilatometry of carbide-derived carbons. Electrochem. Commun. 13, 1221–1224 (2011).
32. Kondrat, S., Georgi, N., Fedorov, M. V. & Kornyshev, A. A. A superionic state in nano-porous double-layer capacitors: Insights from Monte Carlo simulations. Phys. Chem. Chem. Phys. 13, 11359–11366 (2011).
Acknowledgements
A.C.F., J.M.G. and C.P.G. acknowledge the Sims Scholarship (A.C.F.), EPSRC (through the Supergen consortium for J.M.G.) and the EU ERC (through an Advanced Fellowship
to C.P.G.) for financial support. P.S. and W.-Y.T. acknowledge support from the European Research Council (ERC, Advanced Grant, ERC-2011-AdG, Project 291543–IONACES). P.S. also acknowledges financial support from the Chair ‘Embedded Multi-Functional Nanomaterials’ from the Airbus Group Foundation. A.C.F. and J.M.G. thank the NanoDTC Cambridge for travel funding. We also thank A. Kornyshev, S. Kondrat and C. Merlet for useful discussions.
Author contributions
J.M.G., A.C.F. and C.P.G. designed the research. J.M.G. made supercapacitor cells and electrolytes, performed NMR experiments and analysed the NMR data. W.-Y.T., P.-L.T. and P.S. designed the EQCM work. W.-Y.T. carried out the EQCM experiments and
W.-Y.T., P.-L.T. and P.S. analysed the data. All authors contributed to discussion of the data and writing the paper.
Methods
All carbon electrodes were prepared from YP-50F activated carbon (Kuraray Chemical). Freestanding carbon films were prepared as reported in ref. 23 by mixing carbon powder (95 wt%) with polytetrafluoroethylene (5 wt%;
Sigma-Aldrich, 60 wt% dispersion in water). Films were rolled to an approximate thickness of 0.25 mm. Before sample preparation, carbon film pieces were dried under vacuum at 200◦C overnight and then transferred to an argon glove box with H2O and O2levels less than 0.1 ppm. Inside the glove box, the film pieces were cut to a mass of 7.4±0.1 mg. Tetraethylphosphonium tetrafluoroborate salt (>98%) was obtained from Tokyo Chemical Industries. Supercapacitor bag cells were prepared as previously described22. NMR experiments were performed using a Bruker Avance spectrometer operating at a magnetic field strength of 7.05 T, corresponding to19F and31P Larmor frequencies of 284.2 and 121.5 MHz, respectively. A Bruker HX double-resonance static probe was used, with a solenoid coil of 6.8 mm inner diameter.19F NMR spectra are referenced relative to neat hexafluorobenzene (C6F6) at −164.9 ppm, and31P NMR spectra are
referenced relative to 85 wt% H3PO4(aq)at 0 ppm. More details on the in situ methodology and deconvolution of the NMR spectra are given in Supplementary Information.
For EQCM measurements, a slurry composed of 80–90% of YP-50F activated carbon and 10–20% of polyvinylidene fluoride (Arkema) in
N -methyl-2-pyrrolidone (Sigma-Aldrich) was prepared and a few droplets were deposited on a Maxtek 1-inch-diameter Au-coated quartz crystal resonator (with a fundamental frequency of 5 MHz). The carbon-coated quartz resonator was then dried at 60◦C overnight in air. The Maxtek RQCM system was combined with an Autolab PGSTAT101 potentiostat for simultaneous EQCM and electrochemical measurements. Details of the cell assembly were reported previously15.
Chronoamperometry tests were conducted at room temperature with simultaneous recording of the quartz resonance frequency. The capacitive charge stored on the electrode was calculated by integrating the current versus step duration time during the potential hold (see Supplementary Fig. 9). Further details are given in Supplementary Information.