Resolution Mass Spectrometry:
Optimizing data processing for untargeted workflows and targeted
analysis of carotenoids in algal samples
DISSERTATION
PRESENTED IN PARTIAL FULFILLMENT
OF MASTER OF SCIENCE IN CHEMISTRY
BY
ATEFEH RAFIEI
Avertissement
La diffusion de ce mémoire se fait dans le respect des droits de son auteur, qui a signé le formulaire Autorisation de reproduire et de diffuser un travail de recherche de cycles supérieurs (SDU-522 - Rév.01-2006). Cette autorisation stipule que «conformément à l'article 11 du Règlement no 8 des études de cycles supérieurs, [l'auteur] concède à l'Université du Québec à Montréal une licence non exclusive d'utilisation et de publication de la totalité ou d'une partie importante de [son] travail de recherche pour des fins pédagogiques et non commerciales. Plus précisément, [l'auteur] autorise l'Université du Québec à Montréal à reproduire, diffuser, prêter, distribuer ou vendre des copies de [son] travail de recherche à des fins non commerciales sur quelque support que ce soit, y compris l'Internet. Cette licence et cette autorisation n'entraînent pas une renonciation de [la] part [de l'auteur] à [ses] droits moraux ni à [ses] droits de propriété intellectuelle. Sauf entente contraire, [l'auteur] conserve la liberté de diffuser et de commercialiser ou non ce travail dont [il] possède un exemplaire.»
à la Spectrométrie de Masse à Haute Résolution:
Optimisation de traitement des données pour les
analyses métabolomique non ciblées et l'analyse ciblée des caroténoïdes
dans les échantillons d'algues
MÉMOIRE
PRÉSENTÉ
COMME EXIGENCE PARTIELLE
DE LA MAÎTRISE EN CHIMIE
PAR
ATEFEH RAFIEI
encouragement, which have been inspirational in the successful completion of this thesis. 1 am thankful for her support in developing the practical ideas in each step of this research.
It was my pleasure to be a member of the Bio-analytical Mass Spectrometry laboratory, and 1 am sincerely thankful to the members of the lab for their help and assistance in handling the !ab affairs during my M.Sc. program. My very special thanks to Leanne Ohlund, Andre LeBlanc, Makan Golizeh, Dr. Michel Wagner and Biao Ji for their outstanding collaboration in developing new ideas and techniques and for their tremendous discussion and support.
1 would like to thank the financial support offered by Université du Québec à Montréal (UQAM), in the form of different awards and fellowships during the M.Sc. program. 1 am thankful to ail the support staff at UQAM specially Ms Sonia Lachance from the chemistry department for steering me through the logistics of my M.Sc. program. 1 am also thankful to Dr Laura Pirastru for supplying algal samples for study of carotenoids presented in chapter 4. I would also like to thank Dr René Roy and Tze Chieh Shiao for their assistance in providing the synthetic compounds used for the carotenoid study.
Above all, 1 would like to express my deep gratitude to my parents Mr. Hassan Rafiei and Mrs. Tahereh Mohamadi and my spouse Mr. Amir Sanati-Nezhadi for their encouragement and support during my M.Sc. and my whole life.
Dedicated to my beloved parents,
LIST OF TABLES ... viii
LIST OF ABBREVIA TI ONS AND ACRONYMS ... xv
RÉSUMÉ ... xvii ABSTRACT ... xviii CHAPTERI INTRODUCTION TO METABOLOMICS ... 1 1.1 Metabolomics definitions ... 1 1.1.1 Metabolome ... 3
1.1.2 Metabolomics and other omics ... 4
1.2 Different types of metabolomics approaches ... 5
1.3 Metabolomics platforms ... 6
1.3.1 NMR spectroscopy ... 7
1.3.2 FT-IR spectroscopy ... 7
1.3 .3 Mass spectrometry ... 8
1.4 HPLC-MS based metabolomics workflow ... 9
1.4.1 Sample preparation ... 9
1.4.2 HPLC-MS analysis ... 10
1.4.3 Data processing ... 15
1.4.4 Metabolite identification ... 23
LC-HRMS METABOLOMICS DATA ANALYSIS ... 28 2.1 Abstract ... 28 2.2 Introduction ... 29 2.3 Experimental ... 31 2.3.1 Materials ... 31 2.3.2 Sample preparation ... 32 2.3.3 HPLC-MS analysis ... 33
2.3.4 Data Processing ... 33
2.4 Results and discussion ... 37
2.4.1 Standard inixture ... 37
2.4.2 Biological samples (bile and urine) ... 39
2.5 Conclusions ... 48
Supplementary data for chapter 2 ... 49
CHAPTER III ENHANCING UNTARGETED METABOLOMIC DATA ANALYSIS BY A NOVEL DATA REDUCTION WORKFLOW ... 63
3 .1 Abstract ... 63
3 .2 Introduction ... 63
3.3 Material and Methods ... 66
3.3.1 MATLAB processing ... 66
DataReduction Matlab script ... 75
CHAPTERIV CAROTENOID QUANTITATION IN ALGAL SAMPLES BY LIQUID CHROMATOGRAPHY-HIGH RESOLUTION MASS SPECTROMETRY ... 84
4.1 Abstract ... 84
4.2 Introduction ... 84
4.3 Experimental ... 88
4.3.1 Materials ... 88
4.3 .2 Al gal samples ... 88
4.3.3 Carotenoid extraction and sample preparation ... 889
4.3.4 Standard mixture ... 889 4.3.5 HPLC-UV-MS analysis ... 900 4. 3. 6 Data Processing ... 911 4.4 Method development. ... 922 4.5 Results ... 100 4.6 Conclusions ... 1088 CHAPTER V CONCLUSION ... 110 REFERENCES ... 112
Figure 1.2 A simple schematic of HPLC components ... 11 Figure 1.3 A simple diagram representing the main parts of mass spectrometer (the source is not under vacuum for LC-MS systems, since these use atmospheric pressure ionization techniques) ... 12 Figure 1.4 Schematic representation of an electrospray ionization (ESI) source.
Reprinted from (Hoffmann and Stroobant 2007) with pennission ... 13 Figure 1.5 Schematic of a QqTOF hybrid instrument. Reprinted from (Hoffmann and Stroobant 2007) with permission ... 15 Figure 1.6 Peak detection process used to extract bounded infonnation of mass signal (mlz), retention time (RT) and intensity of detected ions ... 18 Figure 2.1 Method used in this study to compare four peak picking workflows. Raw LC-MS data were processed with one of the following software: MetabolitePilot, MarkerView, PeakView and XCMS online. The overlaps between results were then found using an in-house "Venn-pro" MATLAB script followed by METLIN online metabolomics database searching ... 36 Figure 2.2 The overlaps between detected standard metabolites (confirmed by
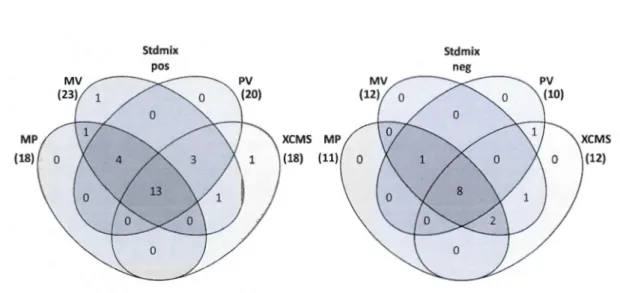
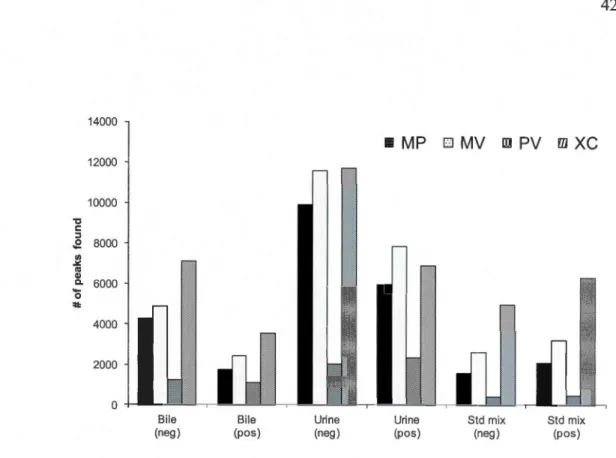
MS/MS spectral matching) using four peak picking workflows (MetabolitePilot (MP), MarkerView (MV), PeakView (PV) and XCMS online) for a standard mixture of 84 compounds in positive and negative ionization modes ... 38 Figure 2.3 Total ion chromatogram (TIC) for bile in positive and negative modes (A and B respectively) and urine in positive and negative modes (C and D respectively). For added clarity, TICs from bile samples were scaled down 3-fold from 18-22 minutes in the above chromatograms ... 40 Figure 2.4 Number of peaks found by different software: PeakView (PV),
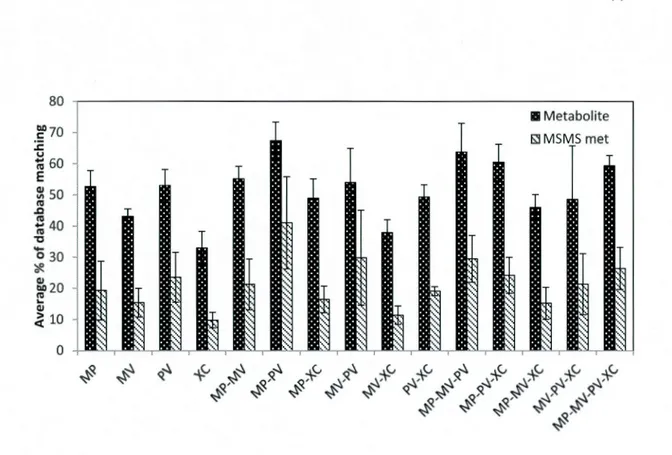
MarkerView (MV), MetabolitePilot (MP) and XCMS online for each sample type (bile, urine and standard mixture) in both positive and negative modes ... 42 Figure 2.5 Venn diagram representation of the average percent of overlaps between the results of four peak picking workflows; MetabolitePilot (MP), MarkerView (MV), PeakView (PV) and XCMS online ... 42 Figure 2.6 Average % of peaks with at least one hit in METLIN database
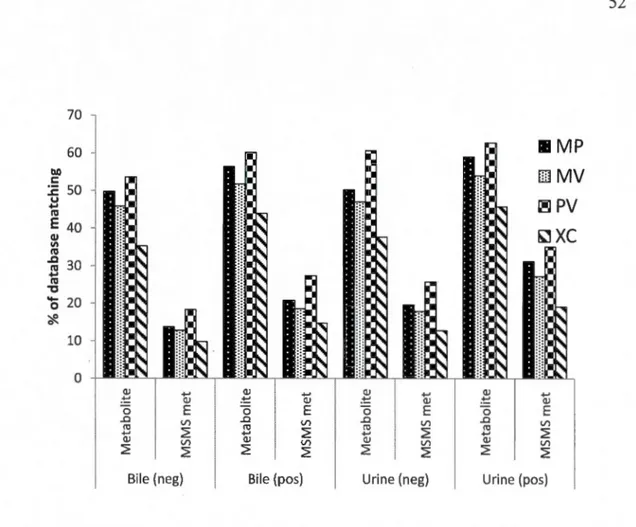
Figure S 1 Venn diagram representation of the overlaps between the results from four peak picking software (MetabolitePilot (MP), MarkerView (MV), PeakView (PV), XCMS online) used to filter LC-MS data from bile and urine in positive and negative modes ... 51 Figure S2 Percentage of metabolome database matching for the results of four peak picking workflows (MetabolitePilot (MP), MarkerView (MV), PeakView (PV), XCMS online (XC)) from bile and urine sample in positive and negative modes, peaks with at least one hit in METLIN database are shown as metabolites and those with at least one MSMS spectra (to be inspected in Metlin) are presented as MS/MS met. ... 52 Figure S3 Venn diagram representation of the overlaps between the results of MS/MS spectrum match (METLIN score>60) from four peak picking software
MetabolitePilot (MP), MarkerView (MV), PeakView (PV), XCMS online on raw LC-MS data from bile and urine in positive and negative modes ... 53 Figure S4 The average percent of peaks found by different number of workflows in each region of chromatogram ... 62 Figure 3.1 "DataReduction" MATLAB script was used in this study to identify and remove isotope peaks, radical ions, adducts and in-source fragments ... 67 Figure 3 .2 Number of peaks found by MA TLAB data reduction script for different workflows: PeakView (PV), MarkerView (MV), MetabolitePilot (MP) and XCMS online for each sample type (bile, urine and compound mixture) in both positive and negative modes ... 69 Figure 3.3 Venn diagram representation of the results of comparison between 13C isotope peaks found by MarkerView (MV) and developed DataReduction (DR) MA TLAB script. ... 70 Figure 3 .4 Pie chart representation of the percentage of redundant peaks found by DataReduction MA TLAB script for the results of four peak picking workflows (MetabolitePilot (MP), MarkerView (MV), PeakView (PV), XCMS online (XC)) from bile sample in positive and negative modes ... 71 Figure 3 .5 Pie chart representation of the percentage ofredundant peaks found by DataReduction MA TLAB script for the results of four peak picking workflows (MetabolitePilot (MP), MarkerView (MV), PeakView (PV), XCMS online (XC)) from urine sample in positive and negative modes ... 72
Figure S5 Sample excel sheet containing peak detection information to be imported to MA TLAB DataReduction workflow ... 83 Figure 4.1 Four carotenoid compounds studied in this work ... 87 Figure 4.2 Sample preparation used for carotenoid quantification in algal samples. It starts with filtration of the algal culture followed by bead beating extraction of carotenoids. Less solvent consumption and faster sample preparation was achieved with this optimized extraction method ... 90 Figure 4.3 Gradient elution used for HPLC-UV -MS analysis. Mobile phase A was (90% MeOH/10% H20/0.1% FA) and B was (85% MTBE/15% MeOH/0.1% FA). 91 Figure 4.4 UV trace at 450 nm (top) and extracted ion chromatograms (bottom) of standards used in this study: 1) echinenone, 2) astaxanthin, 3) lutein, 4)
canthaxanthin, 5) P-apo-8 '-carotenal (IS), 5 ') methylated P-apo-P '-carotenal, 6) echinenone, 7) P-carotene (Meier 2012, unpublished data) ... 93 Figure 4.5 Candidate internai standard compounds tested for this study including a-Tocopherol (vitamin E), Menaquinone (vitamin K2) and P-apo-8'-carotenol. P-apo-8 '-carotenal was the internai standard previously used for quantification of
carotenoids in al gal samples ... 94 Figure 4.6 Evaluation of purity and coelution of P-apo-8 '-carotenol (50 µg/ml) to be used as internai standard. A) Total ion chromatogram (TIC), B) Mass spectrum (from 8.3 to 8.6 min), C) Mass spectrum (from 9.2 to 9.3 min) ... 95 Figure 4.7 Evaluation of purity and co-elution ofvitamin E (50 µg/ml) tested as internai standard. A) Total ion chromatogram (TIC), B) Mass spectrum (from 10.8 to 11.0 min) ... 96 Figure 4.8 Evaluation of purity and coelution of vitamin K2 (50 µg/ml) to be used as internai standard. A) Total ion chromatogram (TIC), B) Mass spectrum (from 10.2 to
10.4 min), C) Extracted ion chromatograms (XICs) which shows perfect co-elution of two observed ions (protonated molecule and ammonium adduct) ... 97 Figure 4.9 Peak areas detected for internai standard when it was added (to the sample in different stages of sample preparation, during filtration, during extraction and right before the injection to HPLC-HRMS system (n=9) ... 98 Figure 4.10 Evaluating the influence of sample preparation on peak area for four standard compounds, A) astaxanthin, B) lutein, C) P-Carotene, D) canthaxanthin.
Figure 4.11 Extracted ion chromatograms of standards used in this study: 1-astaxanthin, 2-lutein, 3-canthaxanthin, 4-Vitamin K2 (IS), 5-p-carotene. Extracted m/z are also presented for each peak ... 101 Figure 4.12 The change in carotenoid concentration in Haematococcus algae induced by stress condition ( culturing time ). The quantity of beta-carotene and lutein exist in
Haematococcus green are higher than the limit of detection of our method for these compounds. The cellular density in al! cultures was initially determined by optical microscope counting and analytical calculation was performed accordingly. Average concentration (µg/cell) and standard deviation are also shown in the figure (n=3). 103 Figure 4.13 Change in carotenoid concentration in Muriellopsis algae induced by stress condition (culturing time). The quantity of cantaxanthin exist in Muriellopsis orange and also ~-carotene exist in Mureillopsis green are higher than the limit of detection The cellular density in al! cultures was initially determined by optical microscope counting and analytical calculation was performed accordingly. Average concentration (µg/cell) and standard deviation are also shown in the figure (n=3) . 104 Figure 4.14 The change in carotenoid concentration in Oocystis algae induced by stress condition ( culturing time ). The quantity of P-carotene, cantaxanthin and lutein in Oocystis orange, and also P-carotene and lutein in Oocystis green is higher than the limit of detection The cellular density in ail cultures was initially determined by optical microscope counting and analytical calculation was perfonned accordingly. Average concentration (µg/cell) and standard deviation are also shown in the figure (n=3) ... 105 Figure 4.15 Carotenogenesis pathway. It was observed that in Haematococcus and Muriellopsis algae species, astaxanthin and cantaxanthin were up-regulated (tick up arrows) and decreases of lutein and P-carotene levels were revealed under stress treatment (tick down arrows) (adapted representation based on (Alvarez et al. 2006)) ... 106 Figure 4.16 Calibration curve obtained for Astaxanthin using linear least squares regression analysis. It covers 0.2 to 10 µg/ml of Astaxanthin in standard solutions (IS concentration was lµg/rnl) ... 106 Figure 4.17 Calibration curve obtained for P-Carotene using linear least squares regression analysis. It covers 0.02 to 0.2 µg/ml of P-Carotene in standard solutions (IS concentration of lµg/ml) ... 107
regression analysis. lt covers 0.2 to 10 µg/ml of Lutein in standard solutions (IS concentration was lµg/ml) ... 108
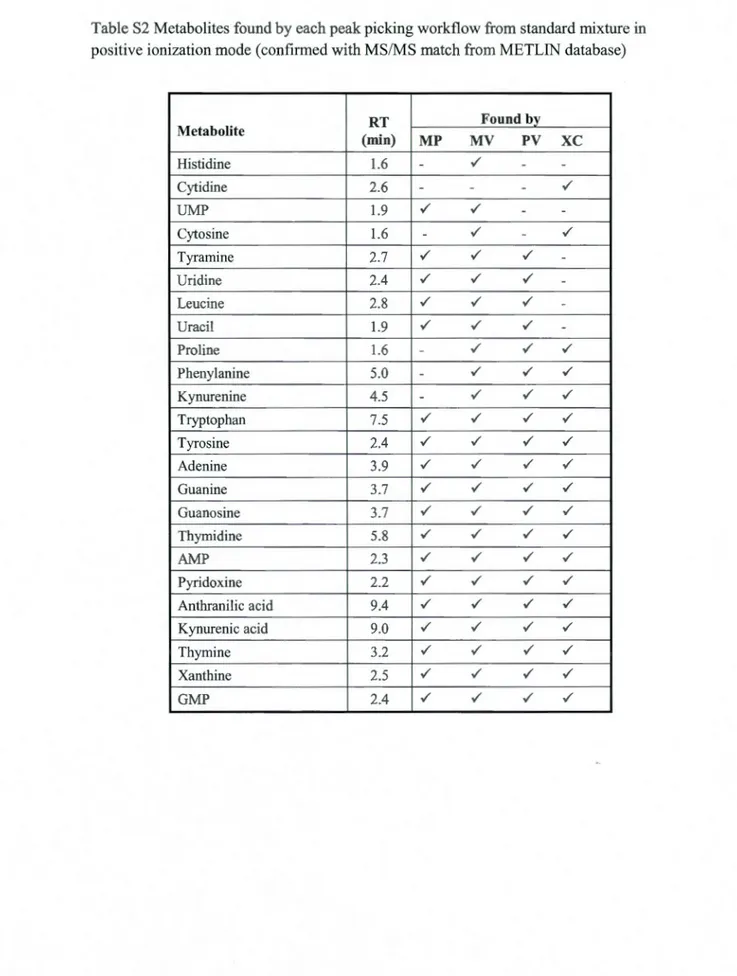
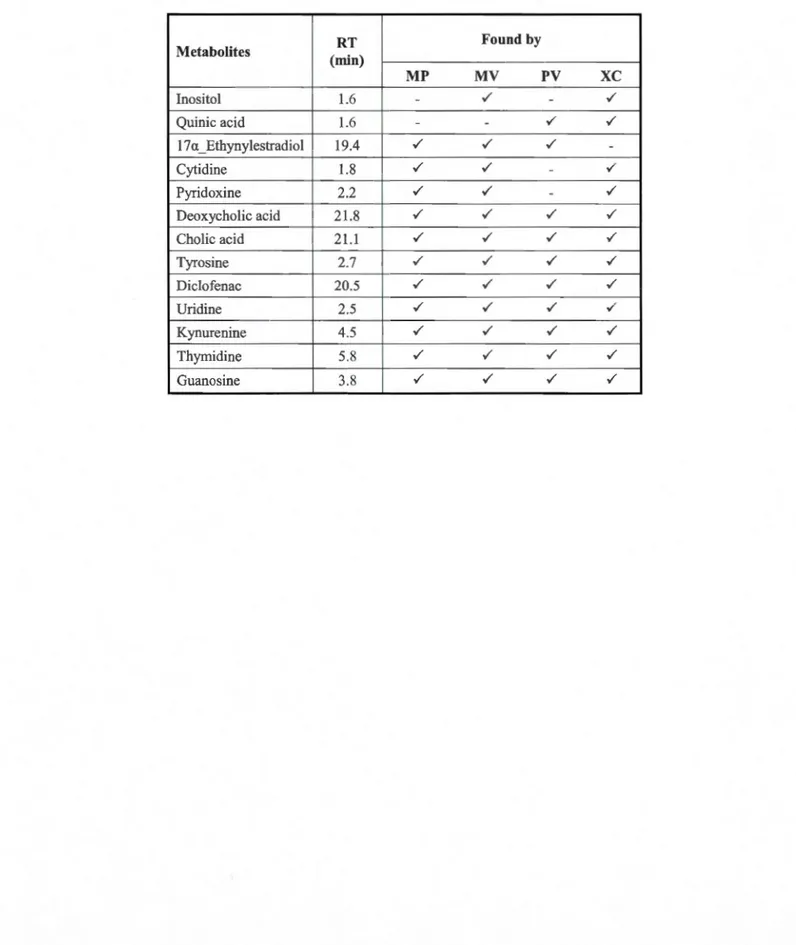
Table S2 Metabolites found by each peak picking workflow from standard mixture in positive ionization mode (confirmed with MS/MS match from METLIN database). 54 Table S3 Metabolites found by each peak picking workflow from standard mixture in negative ionization mode (confirmed with MS/MS match from METLIN database) 55 Table S4 Metabolites identified by targeted approach in standard mixture (pos) with METLIN MS/MS matching which had not been detected by any of the automated peak detection workflows ... 56 Table SS Metabolites identified by targeted approach in standard mixture (neg) with METLIN MS/MS matching which had not been detected by any of the automated peak detection workflows ... 56 Table S6 Identified metabolites in urine (pos) with METLIN MS/MS matching score of higher than 60 (each individual peak might results in several possible metabolites, al! of which are presented here). Metabolites found in standard mixture with matching retenti on times are assigned with a star ... 57 Table S7 ldentified metabolites in urine (neg) with METLIN MS/MS matching score ofhigher than 60 (each individual peak might results in several possible metabolites which are al! presented here). Metabolites found in standard mixture with matching retenti on times are assigned with a star ... 59 Table S8 ldentified metabolites in bile (pos) with METLIN MS/MS matching score ofhigher than 60 (each individual peak might results in several possible metabolites which are al! presented here). Matched metabolite with standard mixture is assigned with a star ... 60 Table S9 Identified metabolites in bile (neg) with METLIN MS/MS matching score of higher than 60 ( each individual peak might results in several possible metabolites which are all presented here) ... 61 Table 3 .1 Comparison of the total number of 13C isotope peaks and the overlap between two filtering algorithms: ("DataReduction" and MarkerView) in bile and urine sample in both positive and negative modes ... 70
Muriellopsis and Haematococcus showed an up-regulation (Up) of astaxanthin and canthaxanthin while P-carotene and lutein were down-regulated (Down). All four studied carotenoids were down-regulated in Oocystis (fold changes are shown in the table and p-values were all below 0.05) ... 105
API CWT El ESI FA FT-IR FT-ICR GC GMP HPLC HRMS HMDB IS IT LC LC-MS LC-MS/MS LLE MMD MV MS MP MeOH MTBE NMR PV QqTOF SNR SPE TOF QqQ
Atrnospheric Pressure Ionization Continuous Wavelet Transform Electron (Impact) Ionization Electrospray Ionization Formic Acid
Fourier Transform Infrared spectroscopy Fourier Transform-Ion Cyclotron Resonance Gas Chromatography
Guanosine MonoPhosphate
High Performance Liquid Chromatography High Resolution Mass Spectrometry Human Metabolome Database
Interna! Standard Ion Trap
Liquid Chromatography
Liquid Chromatography -Mass Spectrometry
Liquid Chromatography - tandem mass spectrometry Liquid-Liquid Extraction
Manchester Metabolomics Database MarkerView
Mass Spectrometry MetabolitePilot Methanol
Methyl Tert-Butyl Ether Nuclear Magnetic Resonance PeakView
Quadrupole-Time-Of-Flight mass analyzer Signal to Noise Ratio
Solid Phase Extraction
Time-Of-Flight mass analyzer Triple quadrupole analyzers
etc. Aux flux de travail non ciblées, l'acquisition d'une vue globale de tous les
métabolites d'un échantillon biologique est souhaitée. En raison de la grande
complexité des échantillons biologiques, des données brutes doivent être traitées
soigneusement pour arriver aux résultats significatifs. La première étape de l'analyse
non ciblée de données métabolomique est de générer des pics de premières données
LC-MS. Dû à l'application des plusieurs algorithmes avec les différents flux de travail
pour la sélection de pic, les résultats peuvent varier largement les uns des autres.
L'autre défi est également à filtrer les pics redondants tels que 13C isotopes, les
produits d'addition et des fragments de source provenant de métabolites lors de
l'analyse MS. Et malheureusement la plupart logiciels automatisé pour ramasser les
pics sont incapables de détecter ces pics redondants. En ce travail, nous avons étudié
systématiquement l'effet d'employer les différents flux de travail des pics pour les
mêmes ensembles de données brutes. Un mélange standard (84) et composés de deux
échantillons biologiques (biliaires et urine) ont été analysés par HPLC-MS-QqTOF
aux deux modes positif et négatif. Les données brutes LC-MS ont été traitées avec
quatre flux de travail différents pour gérer le pic, y compris Peakview®, Markerview
TM, MetabolitePilotTM et XCMS Online. Ensuite, les chevauchements entre les
résultats des flux de travail pour gérer le pic ont été obtenus pour chaque ensemble de
données en appliquant un code basé sur MA TLAB. Enfin, les métabolites potentiels
identifiables ont été étudiés en utilisant la base de données en ligne METLIN. Dans
un autre effort pour améliorer la performance de l'analyse des données non ciblée de
la métabolomique, un flux de travail de réduction de données basé sur MA TLAB a
été développé pour identifier et supprimer les isotopes 13C, ions radicaux, adduits et
et-source-fragments. D'un autre projet, une approche métabolomique ciblée a été
développée pour quantifier la modification introduite au contenu caroténoïde des
échantillons d'algues par le stress.
Mots-clés: métabolomique, la spectrométrie de masse, LC-MS, cueillette Peak,
Due to the high complexity of biological samples, raw data should be processed carefully to yield meaningful results. The first step in untargeted metabolomics data analysis is to generate peaks from raw LC-MS data. Due to the use of various algorithms by different peak picking workflows, results can differ widely from each other. The other challenge is also to filter out redundant peaks such as 13C isotopes, adducts and in-source fragments originating from metabolites during MS analysis and unfortunately, most automated peak picking software are unable to combine all signals belonging to a single metabolite. In this work, we systematically investigated the effect of employing different peak picking workflows for the same raw data sets. A standard mixture (84 compounds) and two biological samples (bile and urine) were analyzed by HPLC-QqTOF-MS in both positive and negative modes. Raw LC-MS data were processed with four different peak generating workflows including Peakview®, Markerview™, MetabolitePilot™ and XCMS Online. Then the overlaps between the results of peak generating workflows for each data set were obtained using a custom-built MATLAB-based code. Finally, the potential identifiable metabolites were investigated using the online METLIN database. In another effort for enhancing the performance of untargeted metabolomics data analysis, a MATLAB-based data reduction workflow was developed to identify and remove 13C isotopes, radical ions, adducts and in-source-fragments. In a separate project, a targeted metabolomics approach was developed to quantify the change introduced to carotenoid content of al gal samples by stress.
1.1 Metabolornics definitions
Analysis of biological samples for identification and quantification of small
molecules bas been done for many years, e.g. measurement of glucose for diabetes (Group 1979) and plasma homocysteine for vascular disease (Elevated et al. 1997). These studies were initially limited to srnall number of target compounds and far
from what we currently define as metabolomics. The fact that individual molecules in biological samples are part of a large network of metabolic pathways magnified the need for a more comprehensive and global approach toward analysis of
biological specimens (Ryan and Robards 2006).
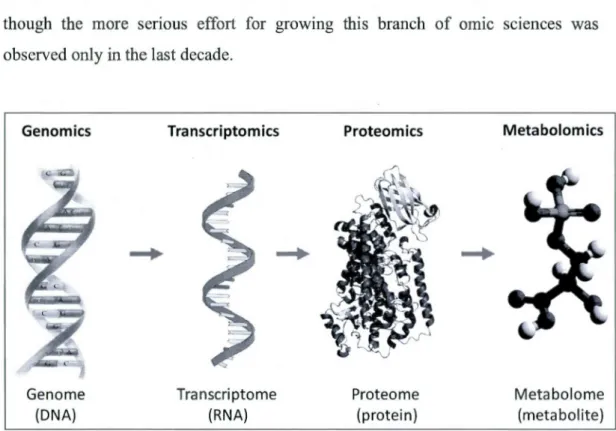
Metabolomics is defined as the quantitative characterization of small molecules (metabolites) present in a biological sample (Lindon et al. 2011). This kind of terminology arises from other "omic" sciences such as genomics, transcriptomics and proteomics, in which genome, transcriptome and proteome content of living organisms are studied, respectively (Figure 1.1 ). Accordingly, metabolomics refers to the study of metabolome, the word first suggested at 1998 by Stephen Oliver
(University of Manchester, UK; http://www.man.ac.uk/), assigned to the set of al!
low-molecular-mass compounds synthesized by an organism (Oliver et al. 1998). Soon afterward, a detailed proposai review on this subject was presented to
scientific community by Oliver Fiehn (Max Plank Institute, Golm, Germany; http://www.mpg.de) (Fiehn 2002). It should be mentioned that one of the first metabolite profiling experiments had been performed long before by Linus Pauling
and colleagues in 1971 in which metabolite content of human urine vapor and
though the more senous effort for growmg this branch of omic sciences was observed only in the last decade.
Genomics Genome (DNA) Transcriptomics Transcriptome (RNA) Proteomics Proteome (protein) Metabolomics Meta bol orne (metabolite)
Figure 1.1 Genomics, transcriptomics, proteomics and metabolomics study genome (DNA), transcriptome (RNA), proteome (proteins) and metabolome (metabolite) content of
biological samples
Another term used along with metabolomics that creates confusion in the corresponding literature, is metabonomics. Initially, metabolomics referred to the measurement of the pool of cell metabolites (Nicholson et al. 1999), while metabonomics was defined as the quantitative measurement of the dynamic multiparametric metabolic response of living systems to pathophysiological stimuli or genetic modification (Nicholson et al. 1999; Beger et al. 2010). These two tenns are often used interchangeably, however bath procedure and bulk of literature support metabolomics as more comprehensive study of the metabolome (Ryan and Robards 2006).
Metabolomics investigations are used in different research areas such as drug discovery (Wishart 2008), medical diagnosis and therapeutic monitoring (Gowda et
al. 2008), toxicology (Ramirez et al. 2013) as well as food science (Wishart 2008),
agriculture (Dixon et al. 2006) and environmental studies (Ramirez et al. 2013).
1.1.1 Metabolome
The metabolome is defined as the set of small molecular mass organic compounds,
metabolites, found in a given biological sample. Small peptides are considered as
metabolites while polymerized structures such as proteins and DNA are beyond the
accepted definition for metabolites. Considering the important biochemical roles of
metabolites as intermediates of biochemical reactions, their quantitative level
(concentration) in living cells can be affected by different processes such as
regulation of transcription and translation or protein-protein interactions. Hence,
studying metabolite levels has great potential to inform us about cellular function
and its response to various genetic or environmental changes (Roux et al. 2011 ).
Metabolites are generally divided into two groups, based on their origin being either
exogenous or endogenous (Roux et al. 2011 ). Endogenous metabolites are either
primary, which are common organic molecules found in broad category of living
cells, or secondary metabolites, referred to the species-specific compounds. The
first group has a direct contribution to essential life processes such as growth and
maintenance, e.g. molecules such as amino acids or glycolysis intennediates. On the
other hand, secondary metabolites have limited distribution among living organisms
and metabolites belonging to this group have more specific biological functions,
e.g. hormones in mammalians and alkaloids in plants (Herbert 1989).
Exogenous metabolites are the product of biotransformation of exogenous
compounds caused by phase I or phase II metabolism. In phase I, the original
while phase II represents the formation of a conjugation product (Shargel et al. 2005).
The complexity of metabolomics analysis is due to the diverse chemical properties as well as wide concentration range, estimated to be 7-9 orders of magnitude (pmol - mmol) (Dunn and Ellis 2005). Most importantly, the large number of metabolites makes an analytical approach much more complicated. For instance, estimates include > 1000 metabolites present in Escherichia coli (Feist et al. 2007) , >4000 for human serum (Psychogios et al. 2011), and between 5000 and 25000 for higher plants (Trethewey 2004).
1.1.2 Metabolomics and other omics
Although the metabolome is a complex system, it is still smaller than the proteome and genome ofliving cells (Watkins and German 2002). In addition, the change and variation in metabolome is more associated with altered phenotype which affects growth, development and health; while the change in proteome and genome does not always result in biochemical change. Thus, it is believed that metabolomics bas the potential to provide the most functional infonnation of all omic science (Sumner et al. 2003).
On the other hand, in genom1cs and proteomics, complete or near complete assessment of related biological content (genome and proteome) is normally achieved, while metabolomics is still far behind them from this aspect (Bouatra et al. 2013). For instance, publications on human metabolomics studies by liquid chromatography coupled to tandem mass spectrometry (LC-MS/MS) instruments, often con tains identification of fewer than 1 OO metabolites (Metz et al. 2007; Rou su et al. 2009; Lim et al. 2010; Zhang et al. 2010) representing a tiny fraction (less than 1 % ) of the human metabolome (Wishart et al. 2012). In order to cover a larger
portion of the metabolome, several systematic efforts were made for detailed analysis of human biofluids, such as cerebrospinal (Wishart et al. 2008; Mandal et al. 2012), saliva (Takeda et al. 2009), serum (Psychogios et al. 2011 ), plasma (Lawton et al. 2008) and urine (Bouatra et al. 2013).
1.2 Different types of metabolomics approaches
Metabolomics investigations are divided to three broad categories, including targeted, fingerprinting and profiling approaches (Ryan and Robards 2006). The last two are also refeJTed to as untargeted metabolomics.
In targeted metabolomics, a pre-defined list of compounds is quantified in samples. For instance, quantification of selected carotenoid compounds in algal samples is a targeted metabolomics approach to study changes as a result of a specific stress condition (Chu et al. 2011 ).
In a fingerprinting approach, a global view of all spectral features is obtained for samples with different biological conditions, (e.g. samples from healthy and diseased individuals), followed by applying statistical methods to identify metabolites with significant differences in concentration levels among studied samples. Identifying the biomarker molecules for early detection of breast cancer is defined in this category (Nam et al. 2009).
Another type of metabolomics investigation is metabolite profiling, which involves the identification and quantification of predefined set of metabolites of known or unknown identity, related to a metabolomic pathway or a class of compounds (Dettmer and Hammock 2004; Dunn and Ellis 2005), for instance, identification and quantification of all amino acids. Although this approach is the oldest and the most established type of metabolomics (Ryan and Robards 2006), it suffers from
the disadvantage of not being universal or a "real" omic science (Dettmer and Hammock 2004).
Thus, the major difference between targeted and untargeted approaches, is in the stage which identification of metabolites is performed.
In
a targeted approach, the investigation is on pre-defined metabolites whose identity is known, while only metabolites with significant differences are identified in the final steps of data analysis in an untargeted workflow.It seems that no common agreement is made in the literature regarding the classification of metabolomics studies yet. Sorne reviewers exclude metabolomics profiling due to not being universal and or a "real" omic science (Griffiths et al. 2010; Preet et al. 2012; Varghese et al. 2012) and some others ignore targeted approach in metabolomics classifications (Dettmer and Hammock 2004) and refer to it as multi-analyte methods instead (Theodoridis et al. 2012).
Based on sample types investigated in metabolomics, footprinting metabolomics is also defined which by definition is "the measurement of metabolites secreted from the intracellular complement of an organism (or biological system) into its extracellular medium or matrix." (Tugizimana et al. 2013). This approach is commonly used in microbiology (Mapelli et al. 2008), tissue engineering (Seagle et al. 2008) and stem cell studies (Turner et al. 2008).
1.3 Metabolomics platforms
Since the metabolome consists of a wide variety of metabolites with different physicochemical properties, it is impossible to use one single technique to analyze the entire metabolome content. Severa! analytical techniques have been used, including three main platforms, proton nuclear magnetic resonance (lH NMR),
mass spectrometry (MS) and fourier transform infrared (FT-IR) spectroscopy. In addition, chromatographie techniques, such as gas chromatography (GC) and liquid chromatography (LC), are often coupled to mass spectrometry for further separation of compounds present in a complex sample (Varghese et al. 2012).
1.3.1 NMR spectroscopy
Nuclear magnetic resonance (NMR) is one of the major analytical tools used in metabolomics studies since 1990 (Lindon et al. 2003). The non-destructive and non-discriminative nature of this method, as well as fast and robust analytical performance (Roux et al. 2011) make it a suitable platform for metabolomics investigation. Another advantage of NMR is that minimal sample preparation is needed, hence, there is less chance for metabolites to be changed or lost during sample preparation. However, NMR suffers from low sensitivity and only medium to high abundance metabolites will be detected by this technique. In addition, identification of individual metabolites is very challenging in complex mixtures since signais from different metabolites could overlap (Dettmer et al. 2007; Lawton
et al. 2008), however, some efforts were done for developing mathematical platforms for quantification of metabolites using NMR spectroscopy (Weljie et al. 2006). Moreover, the sensitivity of NMR to chemical environment (pH, ionic strength, temperature, etc.) and differential sensitivity of molecules to such changes is considered as a major downfall for this technique (Weljie et al. 2006).
1.3.2 FT-IR spectroscopy
Fourier transform-infrared spectroscopy (FT-IR) is also used for analyzing biological samples for metabolomics, nevertheless the number of publications on this subject is much Jess than NMR and MS-based metabolomics. It offers advantages such as low cost, simplicity of sample preparation and low sample
volume needed (Harrigan et al. 2004), however, this method suffers from lack of reproducibility, as sample preparation could cause changes in the continuous intensity data (Roscini et al. 2010). Another disadvantage of this method is that signal interference due to a strong absorbance band of water, makes analysis of aqueous solutions problematic. Although, attenuated total reflectance sampling tools and short path-length transmission cells are employed for analysis of water-based samples, these methods only minimize water signal interference without completely alleviating the problem, therefore this could still cause serious errors in the detection of some metabolites (Botros et al. 2008).
1.3.3 Mass spectrometry
Mass spectrometry-based methods are widely used for metabolomics studies, and are often coupled to gas chromatography or liquid chromatography. High sensitivity, accuracy and coverage has made this technique a promising tool for metabolomics investigations (Varghese et al. 2012). Analysis of the metabolome with MS-based techniques provides the possibility of identification of individual metabolites (Want et al. 2007), the task which is much more complicated in other type of instruments, such as NMR and FT-IR. In addition, the number of MS facilities worldwide in comparison to high field NMR instruments is higher, partly because of it being less expensive instrumentation. Furthermore, man y more experts are working in this area compared to specialists operating state-of-the-art NMR facilities (Theodoridis et al. 2012).
Gas chromatography was the first chromatographie method to be coupled to MS detection and has been used as far back as l 960's for metabolomics applications (Brooks et al. 1968). GC-MS provides high resolution separations and reproducible El spectra, which facilitates identification of metabolites by database searching of known compound spectra. Meanwhile, this technique is only applicable to
molecules which are volatile and thermostable, or need to be derivatized (Roux et al. 2011). The major challenge in the hyphenation of liquid chromatography to mass spectrometery due to the large difference in operating pressures was resolved by the introduction of atmospheric pressure-based ionization methods (API), such as electrospray ionization (ESI) (Plumb et al. 2004) and atmospheric pressure chemical ionization (APCI) (Huang et al. 1990). In LC-MS, lower temperature is needed in comparison to GC-MS and metabolites don't need to be volatile, hence less sample preparation is usually necessary. In addition to the high dynamic range and sensitivity which are considered as main advantages of LC-MS systems (Roux
et al. 2011 ), soft ionization techniques provide information on the intact molecular mass of metabolites (Roux et al. 2011 ), compared to mostly fragment ions seen in El spectra from most GC-MS systems.
1.4 HPLC-MS based metabolomics workflow
A typical HPLC-MS based metabolomics pipeline typically consist of four steps,
sample preparation, HPLC-MS analysis, data processing and metabolite identification. Bach step is explained in detail below.
1.4.1 Sample preparation
For metabolomics studies by LC-MS, minimum sample preparation is typically performed in order to prevent unwanted change or removal of metabolites. For most non-pharmaceutical experiments such as plant, microbial or mammalian biomarker research, intracellular extraction and/or protein precipitation is performed followed by dilution in a suitable solvent (Dunn and Ellis 2005). Additional sample preparation could be employed, including solid phase extraction (SPE), liquid-liquid extraction (LLE) or supercritical fluid extraction, and have been used in pharmaceutical applications (Rossi and Sinz 2001; Bakhtiar et al. 2002; Bamba et
al. 2008). Unlike GC-MS studies, which require derivatization for adding suitable
functional groups to molecules to make them more volatile, derivatization is not necessary in LC-MS-based studies, however, it could be used in certain cases to
enhance sensitivity and chromatographie resolution (Leavens et al. 2002).
1.4.2 HPLC-MS analysis
1.4.2.1 HPLC
High performance liquid chromatography (HPLC) is one of the leading methods
used for separation of different compounds present in solution. This method works
based on the interaction between a liquid (mobile phase) and a solid or fixed gel (stationary phase). Firstly, a small volume of the sample containing the analytes, is
introduced into the mobile phase. Then, the mobile phase is pumped through a chromatographie column filled with small sorbent particles. Based on the type of
HPLC method used, different affinities of the compounds being analyzed with
mobile and stationary phase cause their separation. For example, for reversed phase
chromatography, a polar solvent and non-polar stationary phase are used, resulting in differentiation between different class of molecules present in sample based on their polarity (or hydrophobicity).
In
this case, more polar compounds elute first,while non-polar compounds are retained more within the stationary phase and will elute later. Mobile phase normally consists of a mixture of solvents, and elution is either isocratic (constant ratio of sol vents) or gradient ( changing composition over
time) for improving separation efficiency. A simple diagram of a HPLC system is presented in Figure 1.2. Various detection methods could be used for identification
of separated analytes eluting from the chromatographie column, one of the most
Chromatogram Pump HPLC column
···
~
i - - - - t Detector 0 (cj11; ,--1-. ~ 1 Sample/!
150
\
! t \. Computer processingFigure 1.2 A simple schematic of HPLC components
For metabolomics studies, chromatographie separation is typically carried out using columns between in 2-4.6 mm internai diameter (i.d,), with lengths ranging from 5 to 25 cm, and packed with particles from 3-5 µm i.d, (Lindon et a/, 2011), though smaller particles are being used more and more for increased efficiencies (with corresponding increase in operating pressures). Reversed-phase chromatography is a popular method for metabolomics investigation, however, in order to cover the large diversity of metabolites present in biological samples, other types of chromatography can be used with different stationary phases
e
,
g.
hydrophilic interaction chromatography (HILIC). Due to the complementary nature of HILIC and reversed phase chromatography, they could be combined in two dimensional applications (Huang et al. 1990). It should be mentioned no standard LC-MS method is currently recommended for profiling the complete metabolome due to the chemical diversity of metabolites (Theodoridis et al. 2008).1.4.1.2 Mass spectrometry
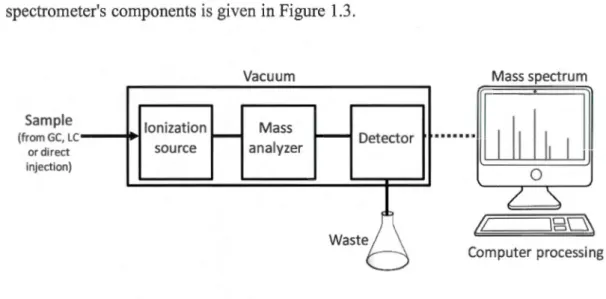
Mass spectrometry is a powerful analytical technique widely used for biochemical applications. The main steps of it are ionizing compounds present in a sample, separating the resulting ions based on their mass-to-charge ratio and finally detecting and reporting their abundance. These steps performed by an ionization
source, mass analyzer and detector, respectively. A simple diagram of the mass
spectrometer's components is given in Figure 1.3.
Sam pie lonization
(from GC, Lc- - . . . i or direct source injection) Vacuum Mass analyzer Mass spectrum Detector
WiliJ
0(!
12'0\
Computer processingFigure 1.3 A simple diagram representing the main parts of mass spectrometer (the source is not under vacuum for LC-MS systems, since these use atmospheric pressure ionization techniques)
In the ion source, molecules of analytes undergo ionization to produce gas phase ions. Although different ionization sources are available, electrospray ionization
(ESI) is the most frequently used method for LC-MS based metabolomics. In this method, the chromatographie eluent passes through a capillary nebulizer tube that is
connected to a strong electric field. This field causes charge accumulation at the
surface of liquid placed at the end of tube, transfen-ing electrical charge to drop lets leaving this tube. Charged droplets then lose the remaining solvent by evaporation
using heat and inert gas flow. The desorption of ions from the surface of droplets
will occur when the solvent is evaporated and electrical charge is large enough at
the surface of tiny droplets, to produce a Coulombic explosion into individual
gas-phase ions. Produced ions are then guided, by differential potentials, toward the mass analyzer (Hoffmann and Stroobant 2007). A simple representation of an ESI
N2 (80°C)
~e;v
,,,
,.
~ ~
1
1~
:
:~
1
A~y
oe
•
1 El&\<OOP"Yw..-Met.L oapm"<y
r
~~~
/
r
t
+ +
Lens Pump N2 (80°C)Figure 1.4 Schematic representation of an electrospray ionization (ESI) source. Reprinted from (Hoffmann and Stroobant 2007) with permission
In order to cover a greater portion of metabolites by mass spectrometry, analysis is usually performed in both positive and negative ionization modes. Sorne metabolites are detected in only one ionization mode (Dunn and Ellis 2005) while some metabolites could be detected in both ionization modes. Ions are created by protonation (M+Ht (in positive mode) or deprotonation, (M-Hf (in negative
mode) and also possibly adductions are formed, as well as in-source fragment ions.
Fragmentation is referred to as the dissociation of molecules to smaller parts, and fragments (or product ions) will be detected afterwards. Adducts are the result of
the addition of sodium, potassium, ammonium, chloride, acetate or other ionic species to the molecule. There is also the possibility for multiply charged species to be formed as well as clusters ( dimers, trimers, etc.), ail of which can have the effect of adding complexity to the mass spectra.
Produced gas phase ions need to be separated based on mass-to-charge ratio (m/z).
A wide variety of analyzers can be used for LC-MS based metabolomics including time-of-flight (TOF), Orbitrap, Fourier transform-ion cyclotron resonance
(FT-ICR), ion trap
(IT)
,
and triple quadrupole (QqQ) analyzers. In the first three, high resolution and accurate mass measurements are possible. In addition, hybridanalyzers such as quadrupole-time of flight (QqTOF) systems, provide high
resolution measurements as well as the potential for tandem mass spectrometry (MS/MS). Accurate mass measurement and MS/MS analysis help in the structural elucidation of metabolites (Roux et al. 2011 ). Since the MS used in this thesis is a
QqTOF system, its main operating concepts will be explained in more detail.
QqTOF systems are in fact similar to triple quadrupole, in which a time-of-flight
(TOF) analyzer replaces the "third" quadrupole. In QqTOF analyzers, two quadrupoles are operated in series, namely Q 1, q2 followed by a time of flight tube. A qO quadrupole (or multipole) is often added before the Ql ion filter to provide
collisional cooling and focusing of the ions (Chemushevich et al. 2001 ).. A schematic representation of a typical QqTOF is shown in Figure 1.5
Two main types of experiments can be done with QqTOF analyzers, TOF-MS or
MS/MS analysis. In TOF-MS mode, the Ql works in rf-only mode, meaning that it transmits all ions to the high resolution TOF analyzer to be separated. In the TOF, entering ions are separated based on their velocity, since ail ions enter with the
same kinetic energy, giving information regarding their m/z. On the other band, in MS/MS analysis, Ql will actas an ion filter, only passing a specific precursor ion to the collision cell ( q2), where it is fragmented by collisional-induced dissociation
(CID). The product (or fragment) ions are then sent to the TOF to obtain product
pmnp 1urbo p11111p 1 1 T.· turbo .... p11111p collision cell onhogon~I nccclcrator TOF
-'
~ ckt~ctor ret1ectronFigure 1.5 Schematic of a QqTOF hybrid instrument. Reprinted from (Hoffmann and
Stroobant 2007) with permission
1 A.3 Data processing
Data treatment workflows for MS-based metabolomics consist of several stages of processing including: noise filtering, peak detection, ion annotation, alignment and normalization, and statistical analysis, followed by metabolite identification (Castillo et al. 2011).
Noise filtering is used primarily to eliminate the background signais and instrumental interferences from true biologically-related signais (Castillo et al. 2011 ). Peak detection is referred to as the representation of ion signais as "features" with specific mlz, retention time and peak area information (Varghese et al. 2012). De-isotoping and ion annotation is used afterward to cluster peaks related to the same metabolites such as isotopes, adducts, and in-source-fragment ions (Varghese
et al. 2012). For quantification purposes (or comparing peak intensities between different samples ), normalization of signals is also required to prevent errors caused by instrumental or sample preparation-related variations (Katajamaa and Oresic 2007). Statistical analysis is then performed to select signals representing significant differences among sample groups,
e.
g.
for biomarker discovery. Identification of compounds is the next step, which is usually challenging and time-consuming (Scalbert et al. 2009; Hall 2011; Zhou et al. 2012). This pipeline represents the usual workflow of data processing in fingerprinting and profiling metabolomics. Depending on the specific type of study, whether it is targeted, fingerprinting or profiling, some steps would not be necessary or could be modified.For example, for metabolomics fingerprinting, statistical analysis to find discriminative signals is followed by identification of corresponding metabolites (Roux et al. 2011). Each of these steps will be explained in more detail in the following sections.
1.4.3.l Noise filtering
The very first step in the treatment of LC-MS data, whether it is used for metabolomics or proteomics, is to filter the noise and baseline correct the data. This step has the potential to improve the quality of peak detection by reducing detection of false positive features (Castillo et al. 2011 ), since raw LC-MS data suffers from both chemical and random noise (Katajamaa and Oresic 2007). Chemical noise is normally very evident at the beginning and end of the elution gradient and often originates from molecules of solvents and buffers used for sample preparation or chromatographie separation, as well as column bleed (Hilario et al. 2006). Random noise is generally caused by imperfect detector function (Zhang et al. 2009).
Several different methods are used for this purpose including Savitzky-Golay type of local polynomial fitting (Wang et al. 2003) and wavelet transformation (Li et al.
2005) which are both applied in m/z direction or filtering with moving averages in
chromatographie trend (Radulovic et al. 2004).
Baseline correction 1s usually performed by finding the baseline shape and
subtracting it from LC-MS raw data (Katajamaa and Oresic 2007). Several
approaches have been done namely low-order polynomial Savitzky-Golay filter
(Wang et al. 2003), linear regression for lowest point of smoothed spectrum (Haimi
e
t
al. 2006) or iterative asymmetric least-squares estimation (Eilers and Boelens2005), which are one-dimensional background estimations.
The filtering and baseline removal is implemented in some peak detection software such as XCMS (Smith et al. 2006), MAYEN [21] and apLCMS [18], while some
other software such as OpenMS (Sturm et al. 2008) offer several filters for the user to choose from.
1.4.3.2 Peak detection
Peak detection, also known as feature detection or peak picking, is the process of extracting signais of MS peaks (m/z) and chromatographie signal (retention time) as
well as peak area or intensity measurement of all detected peaks (Figure 1.6) (Varghese et al. 2012).
From a signal processing perspective, peak detection is carried out based on one or more of the following parameters: signal-to-noise ratio (SNR), intensity threshold,
slopes of peaks, local maximum, shape ratio, ridge lines, model-based criterion and
peak width (Yang et al. 2009). Typically, a combination of methods is used in order
to increase the quality of peak detection and lower the chance for identification of false positive peaks. For instance, the basic version of XCMS [33] bins the data to 0.1 m/z windows, then by considering the maximum intensity at each RT, it
identifies the signal in each slice. A second filtering criteria based on peak shape is used followed by the final selection of peaks using signal-to-noise ratio eut-off
Detailed information about peak detection algorithms is beyond the scope of this
chapter. For more informatics content, you can refer to the comprehensive review
article by Zhang et al. (Zhang et al. 2009).
~~·· ~ ,.,., . l ~-7. ~~·; l.~·,. ~{l,,r 11 ... r ·~·· ... f J(>,,1" '""'
·-""'....
....
,.,.., '""' Raw LC-MS data ·~ 1) ... ' "f•ft>~ "~" Peak-picking workflow 1 ''"";','~'~.·....,1<>.M..,...O.rr<;1 . .,,.,,. • .,....,.11•V"""'"'"C-•••,ç, •""IJJ -,,_.,~.,.,.,, 01•.,o;.11;1 ~,io..1 ~~7 21•'' l ~-7 "•' ,(;.,. ·~r .~ ,...,,. ,,,.,. q;.,.r ~Uo>I>
.
...
,_
... ~ ~(.,..(; ,,,......
,,_ ''"" m/z: 123.3421 RT: 5.2 min lntensity :2.5e4~
m/z: 123.3421 RT: 9.6 min lntensity :1.9e4 / m/z: 587.9091JJL_J
,,__
_j){
..,._/
RT: 13.1 min lntensity :1.5e4Figure 1.6 Peak detection process used to ex tract bounded information of mass signal (m/z),
retention time (RT) and intensity of detected ions
Two general types of software and workflows are available for this purpose,
including commercial and freely-available software. Commercial software are
usually provided by MS instrumentation vendors, such as MarkerView (AB Sciex),
PeakView (AB Sciex), MarkerLynx (Waters), SIEVE (Thermo), MassProfiler
algorithms for these software is often not clear due to the commercial considerations. In addition, there are some free and/or open access software such as MetaboAnalyst (Xia et al. 2009; Xia et al. 2012), MZmine (Katajamaa et al. 2006), XCMS (Smith et al. 2006; Tautenhahn et al. 2008) and MetAlign (Lommen 2009).
In the case of some open sources such as for XCMS (Smith et al. 2006; Tautenhahn
et al. 2008) and MZmine (Katajamaa et al. 2006), the operating algorithm is
accessible and could be modified by the user. Katajamaa et al. provided the lists of
commercial and freely-available software used for metabolomics applications (Katajamaa and Oresic 2007). Furthermore, a list of freely available software and the codes used for different LC-MS data processing is provided at the address of (http://www.ms-utils.org/). These codes commonly work in computer programming environment such as Java, Matlab, C or R.
Although there is no limitation on the number of software and workflows available
for feature detection, there are some challenges in this area. For instance, the final
results of different platforrns could differ widely due to different algorithms used.
Hence, the decision for choosing the right platform becomes critical in
metabolomics data analysis. Usability, documentation and easy visualization of the
results are the main factors for selection of appropriate workflow used by common
users, especially, those unfamiliar with programming languages. The ability of
algorithm to distinguish between low intensity peaks and noise is also important factor to be considered. Another main criteria is the coverage of software on
different aspects of the data processing workflow, starting from noise filtering and
baseline correction to be done automatically along with feature detection (Castillo
1.4.3.3 Ion annotation
LC-MS-based metabolomics experiments can result in a huge number of peaks, only a portion of which are related to true biological metabolites. The fact that each single metabolite can also give rise to several ions, namely adducts, in-source
fragments and isotopes, makes data processing challenging. Therefore, if only mass-based search is carried out for peak detection, false identification of peaks is normal (Varghese et al. 2012). Ion annotation is the method used for assigning all
redundant peaks corresponding to ions arising from the same species and grouping
them together to reduce the complexity of data for further biological interpretation.
Since most of the elements exist in more than one naturally-occurring isotopie form, molecules containing different isotopes have different masses, detected as their isotopie pattern in the mass spectra (Jaitly et al. 2009). In-source fragment ions result from dissociation of the intact ionized molecules before they enter the mass
analyzer, and although ESI is considered as soft ionization source, this phenomenon
still can occur for certain compounds. Losses of water, ammonia and/or C02 are common in-source fragments in metabolomics data. The third type of derivative peaks cornes from adduct ions. An adduct ion is, by definition, "an ion formed by
the interaction of two species, usually an ion and a molecule, and often within the ion source, to form an ion containing ail the constituent atoms of one species as well as an additional atom or atoms" (McNaught and Wilkinson 2000). Sodium and
potassium adducts are common species observed in MS of small molecules. For
lists of common adducts seen in MS experiment, you can refer to articles by Haung
et al. and Keller et al. (Huang et al. 1999; Keller et al. 2008).
The ion annotation employs two clues for assigning redundant peaks: 1) the mass difference between two peaks should match with related isotopes, adducts or
fragment ions, 2) the similarity between the extracted ion chromatogram of two peaks as they have the same elution profile (Varghese et al. 2012).
Numerous efforts have been made for developing of either an independent ion annotation workflow (working on the results of feature detection) or implemented algorithms within feature selection software. For example, CAMERA imports the results of R-based XCMS and annotates peaks in two steps. First, peaks are grouped
based on retention time and similarity between peaks, and then the difference between their m/z values is compared with a list of normally occurring adducts and
in-source fragments for any possible relationship (Kuhl et al. 2011 ). Another
workflow uses pre-defined m/z differences, chromatographie elution and intensity correlation (for isotopie peaks) to assign redundant peaks, resulting in 50% data reduction (Brown et al. 2009). In addition, there are some commercial software such as ACD/IntelliXtract (a part of the ACD/MS workbook suite) which works
based on the given rule table (ACD/IntelliXtract 2007). PUTMEDID-LCMS is a
public tool which imports raw LC-MS data and group peaks originating from the same metabolites by mass difference, retention time and peak area matching (Brown et al. 2011). Peak area correlation is employed for confirmation criteria of the isotopie peaks. IDEOM, free implementation for Microsoft Excel assigns ESI redundant peaks as well as FT or ringing signals by employing RT, peak shape and intensities and difference in m/z values (Creek et al. 2012).
1.4.3 .4 Alignment, normalization and statistical analysis
Alignment is a crucial step for metabolomics analysis on more than one sample or more than one run, since small variations are often seen in retention time and m/z
values of the same metabolite across different samples (Podwojski et al. 2009).
Alignment algorithms either work based on raw LC-MS data or features found previously by peak picking tools. Moreover, some peak picking packages such as
XCMS (Smith et al. 2006) or MarkerView software incorporate the alignment
method as well. The fact that elution differences among samples may be non-linear
and multiple pairs of feature may be found as matching peaks, makes alignment a
challenging process and thus needs to be performed with caution (Castillo et al.
2011 ). Podwojski et al. studied three different algorithms including linear
regression, loss regression and local vectors and their results showed the importance
of considering non-linear deviation in proteomics data (Podwojski et al. 2009). A
detailed review on available alignment algorithms used for LC-MS is provided by
Vandenbogaert et al. (Vandenbogaert et al. 2008).
Normalization of peak intensities may be performed specially for quantitative
measurement, or when metabolite fingerprinting is performed. The unwanted
systematic bias in LC-MS data, resulting from several sources such as experimental
difference, could overshadow the real biological difference in concentration of
metabolites. Hence, peak intensities should be corrected before doing statistical
analysis between samples.
Two approaches are dominant for normalization including statistical and standard addition method. The first one is based on whole dataset for instance, normalization
by unit norm of intensities (Scholz et al. 2004), the maximum likelihood method
(Oresic et al. 2004) or median of intensities (Wang et al. 2003). However, this
method is unable to assign absolute concentration of metabolites (Katajamaa et al.
2006). The second method is to use one or more standard compounds as a reference
for normalization and absolute quantitation. Due to the large number of metabolites
studied in metabolomics investigations, the selection of proper standard compounds
for normalization is ambiguous when more than one standard is used. Similarity
between elution behavior of analyte and standard compound is used for selection of
Statistical analysis is generally used for two purposes. It can be used for sample classification when limited information about samples is available ( e.g. identification of silent mutation phenotypes in offspring). In this case, unsupervised statistical methods are employed such as hierarchical clustering analysis (HCA),
principal component analysis (PCA), or independent component analysis (ICA). In addition, statistical analysis is used to find metabolites with great differences in intensities arnong different classes of sarnples, related to the studied condition, such as health, diet or exposure to toxins. Using supervised rnathernatical rnethods like partial least squares (PLS) or soft-independent method of class analogy (SIMCA) can be used for this purpose (Dettrner et al. 2007).
1.4.4 Metabolite identification
Identification of rnetabolites is the last step in the metabolomics pipeline before any biological information could be interpreted regarding biochernical pathways or biomarker discovery. It is performed in all rnetabolomics studies, no matter what the type of the investigation. For untargeted rnetabolomics, it is performed for all peaks detected as monoisotopic ions, while the effort for fingerprinting studies is to identify peaks with significant differences in different samples. For targeted metabolomics, identification is most likely done prior to LC-MS analysis, and absolute quantitation is instead the last step.
Two mam strategies are used widely for identification of compounds by mass spectrornetry. Accurate mass measurernent of selected ions acquired by high resolution MS systems (HRMS) could yield elemental formulae for the chemical characterization of rnetabolites. In addition, tandem mass spectrometry results, yielding the fragmentation pattern, could be used for structural elucidation of metabolites. For the final confirmation of metabolites, standard solutions of compounds should be analyzed with the same instrument using the same method, if
available, to ensure chromatographie elution and mass spectral similarity (Bueschl et al. 2013).
Database searching is one of the most time consuming parts of a metabolomics workflow, and can also have some difficulties. For instance, the collision energy in
which MS/MS spectra for standard compounds is acquired could be different from that of the experiment, resulting to differences in fragment ion patterns. In addition,
lack of MS/MS spectra for many compounds in metabolomics databases makes the identification of metabolites a highly labor-intensive task (Bueschl et al. 2013).
In addition to relying on the high efficiency of MS instruments, more classical chemical methods can be used in metabolomics workflows. For example, chemical derivatization can help identify the functional groups and differential labeling can
aid in the relative quantitation of metabolites by observing a specific mass shift and
intensity ratio (Dettmer et al. 2007). Hydrogen/deuterium exchange methods also
provide information on the number of exchangeable protons for identification of
some functional groups like alcohols, amines, carboxylic acids, etc. (Dettmer et al. 2007).
1.4 .4 .1 Databases
The number of metabolomics databases and their metabolite content is still limited in comparison with genomics and proteomics databases due to being relatively newer, and less straightforward. PubChem (Wang et al. 2009), METLIN (Smith et al. 2005) and KEGG (Kanehisa et al. 2004) provide simple mass-based searches
while HMDB (http://www.hmdb.ca) provides clinical and molecular biology data as well.
Other useful metabolomics databases are Manchester metabolomics database
(MMD) (Brown et al. 2009) that is created from other sources like genome scale
metabolic models (Herrgârd et al. 2008), Human Metabolome Database (HMDB)
(Wishart et al. 2007), Lipid Maps (Sud et al. 2007), BioCyc (Karp et al. 2005) and
DrugBank (Wishart 2008).
1.5 Research objectives
LC-MS based metabolomics experiments produce a large amount of data which
needs special care for data processing. As it was shown in previous section, data processing has several steps, where peak picking and ion annotation have great
importance. As different peak picking software use various algorithms, the final
results provided by these software may be different and directly affect
metabolomics results. Hence, two objectives were defined for this research as
follows:
1. To compare four different peak picking software for untargeted metabolomics
applications with the aid of MA TLAB programming. The studied peak detection
workflows include three commercial packages, PeakView®, Markerview™,
MetabolitePilot™, (all provided by AB Sciex), and freely available, XCMS online
workflow.
2. To develop MA TLAB-based code for ion annotation of peak picking results.
These two approaches were designed to help the improvement of LC-MS based
metabolomics as relatively new science to provide better performance in addressing
biologically-important questions.
In
addition, in a separate project, a targetedmetabolomics assay was improved by presenting the modifications on sample
3. Quantitation of four carotenoid compounds in algal samples using HPLC-HRMS system. The aim of this work was to present a simple and fast extraction method for
analyzing the carotenoid content of algal solutions in response to introduced stress
conditions.
1.6 Thesis outline
This thesis has been organized as follows:
Chapter 1 introduces metabolomics concepts, different branches of this new amie
science, as well as an overview of the experiment pipeline. This chapter also
presents the research objectives and layout of the thesis.
Chapter 2 describes the research on comparison of peak picking workflows for
metabolomics profiling research on two biological samples. Four different peak
detection software were compared including three commercial software from AB
Sciex (Peakview®, Markerview™, MetabolitePilot™) and XCMS Online
(open-source web-based software). Raw LC-MS data from two biological sample types
(bile and urine) as well as a standard mixture of 84 compounds were processed with
same criteria. Then, the overlaps between the results were investigated by a
MA TLAB script developed for this purpose. Finally, the resulting lists of potential
metabolites from each workflow were investigated using the METLIN database
based on accurate precursor ion mass and MS/MS spectral matching. The
performance of these four peak picking workflows was also evaluated with a
custom standard mixture of 84 biologically-relevant small molecules. Work
presented in this chapter is the subject of a published peer-reviewed article in Rapid