THÈSE
En vue de l’obtention du
DOCTORAT DE L’UNIVERSITÉ DE TOULOUSE
Délivré par l'Université Toulouse 3 - Paul Sabatier
Présentée et soutenue par
Samson CHOTA
Le 20 octobre 2020
Étude de la relation causale entre les oscillations cérébrales et la
perception en utilisant des techniques non invasives de
stimulation cérébrale
Ecole doctorale : CLESCO - Comportement, Langage, Education, Socialisation,
Cognition
Spécialité : Neurosciences
Unité de recherche :
CERCO - Centre de Recherche Cerveau et Cognition
Thèse dirigée par
Rufin VANRULLEN
Jury
Mme Laura DUGUé, Rapporteure
M. Gregor THUT, Rapporteur
Mme Suliann BEN HAMED, Rapporteure
M. Rufin VANRULLEN, Directeur de thèse
The causal role of neural oscillations in
attentional and perceptual sampling mechanisms.
Samson Chota
Contents
1 General Introduction 2
2 Visual Entrainment at 10 Hz Causes Periodic Modulation of the Flash Lag Illusion 26
3 Occipital Alpha-TMS causally modulates Temporal Order
Judge-ments 41
4 Random Tactile Noise Stimulation reveals periodic Reverbra-tions in the Somatosensory System 65
5 Rhythmic fluctuations of saccadic reaction time arising from
visual competition 81
6 Full Field Masking Causes Reversals in Perceived Event Order 95
7 General Discussion 111
Chapter 1
1.1
Foreword
We stay blissfully unaware of the vast amount of information that our brain is constantly processing. And that is a good thing. Without it we would quickly be overwhelmed trying to make sense of half a billion photons that get absorbed by our retina every second. In order to successfully separate the important things from the unimportant ones in the tidal wave of incoming information, the brain had to develop a number of sophisticated tricks, some of which I will investigate in the context of this thesis.
Imagine sitting on your bike at a red traffic light. There are many cues that your brain subconsciously uses to help you know when you can safely cross the street. Is the light to your left or your right? Which of the three lights is the important one? How long has it been red already? How frequently do I have to check? Obviously some of these questions are about the right location but interestingly some of them are also about the right timing.
How does the brain manage to collect the right amount of information, from the correct location at the correct time? More and more research suggests that periodic fluctuations in our brains activity, so called brain oscillations, play an important role in this process. During my thesis I tried to investigate this the-ory by manipulating neural oscillations and demonstrated that this changes the way that the brain collects information over time.
1.2
Perceptual Rhythms
Perception varies from moment to moment. Some of the fluctuations in target detection, reaction times or discrimination tasks can be explained by taking a closer look at the momentary state of brain oscillations that accompanies the presentation of stimuli (Box ”Dense Sampling Method). More precisely we can relate the phase of certain oscillatory frequency bands to perceptual outcomes, with some ”good” phases being beneficial for perception and some ”bad” phases being detrimental. This relationship implies that neural oscillations and with them perception, continuously alternates between periods of higher and lower ef-ficiency. Over the last two decades two dominant oscillatory components, one in the 4-7 Hz theta range and one in the 10 Hz alpha range, have emerged from ex-periments that investigated these perceptual fluctuations (Figure 1) (VanRullen,
2016).
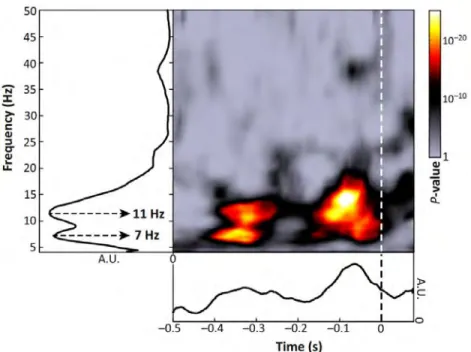
Figure 1. Phase-Dependent Perception. The plot depicts the time-frequency representations of 10 independent studies conducted at our laboratory. Hot col-ors indicate the time and frequency at which the phase of the respective oscilla-tion influenced perceptual outcome in the corresponding task. In other words, if a specific oscillatory phase led to a certain outcome (e.g. target detected) then the opposite phase favoured the opposite outcome (target not detected). As can be seen in the figure, studies consistently reported phase effects in the 10 as well as 7 Hz frequency range with the strongest effect around 100 ms before stimulation. Figure adopted from VanRullen (2016).
Paradigms in which two stimuli compete for attentional resources, for exam-ple those in which both stimuli have to be monitored to detect a change, often show that attention alternates between the two competing stimuli at a frequency of 4 to 8 Hz. This attentional ”sampling” manifests as a periodic modulation of reaction times or target detection rates over time, observed for both stimuli but in anti-phasic relationship (Busch & VanRullen, 2010; Landau & Fries, 2012; Fiebelkorn, Saalmann, & Kastner, 2013; Landau, Schreyer, van Pelt, & Fries,
2015; Dugu´e, Roberts, & Carrasco, 2016; Gaillard et al., 2020). We demon-strated this effect in the study found in chapter V. This observation has led to the characterization of this attentional dynamic as an ”attentional spotlight” that highlights one stimulus after the other (Figure 2B) (VanRullen, Carlson, & Cavanagh, 2007). Importantly the attentional spotlight is highly flexibel, seem-ingly being able to sample stimuli of different set sizes at arbitrary locations in the visual field. It is task-context dependent as can be seen in cueing studies and seems to be partially object based (Fiebelkorn et al., 2013; Davidson, Alais, van Boxtel, & Tsuchiya, 2018; Gaillard et al., 2020). Primarily targets that are relevant are sampled and increasing the number of targets, hence distributing attentional resources, leads to a decrease in performance and sampling rate for individual targets (Holcombe & Chen, 2013; Fiebelkorn & Kastner, 2018). How exactly this attentional rhythm samples stimuli and which effects this has on perception is not well understood. In chapter V and VI I investigate how two different types of experimental manipulation lead to changes in attentional sam-pling and its perceptual consequences.
The second oscillatory component that can be observed in behavioral time courses is a 10 Hz perceptual rhythm. I refer to it as perceptual because it seems to relate more to a general low level fluctuation of excitability in the early visual pathway, not object based and associated most frequently with the occipital al-pha rhythm (Figure 2A) (Busch, Dubois, & VanRullen, 2009; L˝orincz, K´ekesi, Juh´asz, Crunelli, & Hughes, 2009; Haegens, N´acher, Luna, Romo, & Jensen, 2011). Interestingly the fluctuations at 10 Hz do not only modulate perceptual sensitivity but also seem to influence time perception in a periodic manner. We can observe experimentally that at regular intervals perceived time is distorted, leading to errors in judgments of relative timing. (Chakravarthi & Vanrullen, 2012; Samaha & Postle, 2015). This intriguing observation has given rise to several theories about the temporal structure of our conscious visual perception (Valera, Toro, Roy John, & Schwartz, 1981; VanRullen & Koch, 2003; Van-Rullen, 2016). Up until now the question which causal role the occipital alpha rhythm plays in our temporal perception has not been answered. In chapter II and III I investigated if we can manipulate the occipital alpha rhythm and ob-serve how this changes the temporal dynamics of our visual temporal perception.
Figure 2. Perceptual versus Attentional Sampling. A. Discrete perceptual sampling of a single visual location. This sensory mechanism is hypothesized to be implemented by occipital alpha oscillations. B. Attentional sampling mechanism, dynamically and sequentially processing different objects in the visual field. We assume that this mechanism is related to theta oscillations in the 4 to 8 hz range. Figure adopted from VanRullen (2016)
As evident in the title I refer to these periodic fluctuations as sampling mecha-nisms. This implies that they have an active function, namely that of periodi-cally collecting visual information and reducing complexity. This is contrary to the believe of some researchers who claim that the observed fluctuations, either in perception and/or on the neuronal population level are a side effect of other processes. A substantial part of this thesis is dedicated to provide evidence against this viewpoint by providing causal evidence for the involvement of brain rhythms in sampling processes. I shortly review the question of causality in the General Discussion at the end of this thesis.
1.3
Neural oscillations
1.3.1
Alpha
For both attentional and perceptual behavioral fluctuations we have began to find neurophysiological correlates in the brain. Since behavior changes periodi-cally it is most likely that periodic neural oscillations give rise, or relate in some
way to these observations. However connecting the right oscillatory signature to the right behavioral observation is difficult since neural oscillations are ubiq-uitous in the brain (Box ”EEG”) (Buzsaki, 2006).
Among brain rhythms the alpha rhythm is the most easily observed one with a frequency of 8 to 12 Hz (Berger, 1931). Initially thought of as a cognitive idling rhythm (Pfurtscheller, Stanc´ak, & Neuper, 1996) it has since been im-plicated in a vast number of cognitive functions such as attention, memory and inhibition (Klimesch, 1999; Klimesch, Sauseng, & Hanslmayr, 2007; Tu-ladhar et al., 2007; Jokisch & Jensen, 2007; Jensen & Mazaheri, 2010; Foxe & Snyder, 2011; Bonnefond & Jensen, 2012; Jensen, Bonnefond, & VanRullen, 2012; Klimesch, 2012). A large body of literature investigates the effects of alpha amplitude on perception, linking high alpha power to high inhibition and lower target detection rates (Thut, Nietzel, Brandt, & Pascual-Leone, 2006; Babiloni, Vecchio, Bultrini, Luca Romani, & Rossini, 2006; Hanslmayr et al., 2007). More specifically, alpha power has been shown to increase in task irrel-evant areas, whereas it decreases in task relirrel-evant areas, demonstrating its role in spatial attention (Sauseng et al., 2005; Kelly, Lalor, Reilly, & Foxe, 2006; Foxe & Snyder, 2011). Alpha oscillations play an even more dynamic role in the context of temporal attention, decreasing/increasing their amplitude at the moment when a target/distractor is expected (Rohenkohl & Nobre, 2011; van Diepen, Cohen, Denys, & Mazaheri, 2015). On an even finer temporal scale we find that the phase of ongoing oscillations in the 5-15 Hz range influences per-ception. Busch et al. (2009) and Mathewson et al. (2009) demonstrated that the phase of alpha oscillations is predictive of stimulus detection performance, implying that excitability in the visual cortex oscillates at around 10 Hz (Busch et al., 2009; Mathewson, Gratton, Fabiani, Beck, & Ro, 2009). These findings have been replicated several times using rhythmic entrainment at 10 Hz via periodic visual stimuli or alpha-TMS. (Mathewson, Fabiani, Gratton, Beck, & Lleras, 2010; Romei, Gross, & Thut, 2010; Thut et al., 2011; Spaak, Lange, & Jensen, 2014; Dugu´e & VanRullen, 2017). In chapter II and III we apply such a rhythmic entrainment protocol to influence the alpha rhythm and observe how excitability fluctuations change time perception.
While alpha de-synchronization in response to visual stimulation is a relatively robust effect observed in this context, there has been an intriguing finding that shed doubt on the interpretation of its relationship to perception. By presenting
participants with white noise luminance sequences and cross-correlating them with the resulting EEG signal, one can calculate the brain’s mathematical im-pulse response function (IRF)(VanRullen & Macdonald, 2012). Theoretically this IRF should resemble an ERP since both can be considered the brains re-sponse to an impulse, however the IRF showed an up to 1 second long reverbra-tion of the input sequence that had a strong oscillatory 10 Hz component, and was thus coined ”perceptual echo” (Figure 3). Importantly these reverbrations were only present when the EEG was cross-correlated with the exact luminance sequence of that trial and not when a random luminance sequence was used. This indicates that it is the precise visual information that is ”echoed” in the brain instead of arbitrary luminance sequences leading to oscillatory entrain-ment . In the remainder of the manuscript I will use the term perceptual echo and IRF interchangeably. A striking observation here is that, in contrast to traditional ERP’s, where we find strong de-synchronization after stimulation, the echoes show a clear increase in oscillatory power. The fact that the broad-band input sequence did not favour any specific frequencies suggests that a basic property the visual system is to processes information at an intrinsic frequency of 10 Hz. The oscillatory component of the echoes initially does seem to reflect the periodic sampling of external stimuli in the fashion of chapter II and III. Theoretically the echoes can be understood as a filter that turns a continuous signal into a periodic signal, similar to what we would expect from said rhythmic sampling. However, since the IRF’s are a result of the cross-correlation we must remember that their temporal unit is in lags which means that in theory every successive luminance increment is associated with a phase locked IRF. In con-trast, chapter II and III hypothesize that rhythmic sampling is implemented by a single oscillation that samples all stimuli in ”real-time” instead of lags. These considerations make the relationship between discrete sampling and echoes a complex one to disentangle.
A different way to understand the mechanism that generates the echoes is to assume that they are a result of an internal process that periodically reactivates specific stimuli sequences. These rhythmic reactivations could be a signature that might be expected of intra-cortical sampling, or information transfer, where one layer in the visual hierarchy samples the information in another one in a recurrent fashion. Along these lines the echoes could reflect predictive cod-ing processes where bottom up information and top down predictions need to be aligned for comparison while taking into account neural transmission delays
(Hogendoorn & Burkitt, 2019; Alamia & VanRullen, 2019). In any case, if these findings could be extended to other sensory modalities we would have intriguing evidence that rhythmic processing is intrinsically linked to neural oscillation in the respective sensory processing areas. In chapter IV we tested if perceptual echoes can be found in the somatosensory system.
Figure 3. Perceptual Echoes. A. Visual Perceptual Echoes of two individual subjects. Cross correlation between white noise sequence and corresponding EEG leads to 1 second long periodic reverbrations. Surrogate echoes are cal-culated by cross-correlating white noise sequences with the EEG signal of a random trial and show no reverbrations. B. The power spectrum of the percep-tual echoes shows strong oscillatory components at 10 Hz. C. Group average of the power spectrum. D. Average time-frequency representation of individual perceptual echoes. We can observe significantly high alpha power for up to 1 second. E. The Topography of the power spectrum indicates that the origin of the echo lies in parieto-occipital regions. Figure adopted from VanRullen and Macdonald (2012).
Several theories have tried to provide a broader explanation for the role of the alpha rhythm (Ba¸sar, Sch¨urmann, Ba¸sar-Eroglu, & Karaka¸s, 1997; Klimesch, Sauseng, & Hanslmayr, 2007; Jensen & Mazaheri, 2010; Mathewson et al., 2011).
EEG
EEG is a an invaluable tool to measure brain activity with a high tem-poral resolution. It uses multiple electrodes distributed across the scalp to measure changes in the electric potential. The EEG signal is assumed to stem from large groups of pyramidal cells with parallel axional ori-entation, that reside in deep cortical layers.
EEG measurements were used in chapter 4 to measure oscillatory re-sponses to different input frequencies as well as broad band stimulation. Since EEG data tends to be subject to several sources of noise like line noise, eye blinks and muscle contractions, we used independent compo-nent analysis and a generalized eigenvalue decomposition approach to improve the signal to noise ratio. This allowed us to identify the chan-nels that best represented the brains frequency response. Illustration by Nikola Vukovic (2014).
Generally these ideas agree that alpha exhibits some form of inhibitory effect on the neural population, modulated by amplitude and/or phase. It is not clear however what exactly is inhibited and at which stage(s) of the visual processing pipeline this inhibition takes place. The thalamus, more specifically the lateral geniculate nucleus (LGN), has been implicated in utilizing alpha to gate infor-mation flow towards primary visual cortex (L˝orincz et al., 2009). The LGN primarily relays information from the retina to V1 and serves as it’s main af-ferent. It has been proposed that alpha is generated by this cortico-geniculate circuit, effectively concentrating neuronal firing to certain phases of the alpha cycle and temporally framing information transfer (Haegens et al., 2011; Vi-jayan & Kopell, 2012). Visual information would therefore arrive periodically in more or less discrete packages at primary visual cortex. In my thesis I was specifically interested in the consequences that this temporal framing structure has on the temporal dynamics of time perception. Of critical importance here is the theory of discrete perception which I investigated in chapter II and III. I will go into more detail on this hypothesis in the chapter ”Discrete Perception”.
1.3.2
Theta
Behavioral theta fluctuations in reaction times and performance measures are commonly found during attentional tasks. (Busch & VanRullen, 2010; Landau & Fries, 2012; Fiebelkorn et al., 2013; Landau et al., 2015; Dugu´e, McLel-land, Lajous, & VanRullen, 2015). Previously the theta rhythm, as measured with EEG, has been related to attentional processes (Busch & VanRullen, 2010; Clayton, Yeung, & Cohen Kadosh, 2015; Landau et al., 2015). Using EEG and TMS, Dugue et al. have shown that performance in a visual search paradigm was dependent on the phase and amplitude of cortical theta oscillations (Dugu´e, Marque, & VanRullen, 2011). Furthermore they showed that information in vi-sual cortex is vulnerable to TMS pulses every 160 ms (6 Hz). Detection rates of attended targets were demonstrated to be dependent on the phase of frontal theta oscillations (Busch & VanRullen, 2010). However electrophysiological evidence that maps behavioral attentional oscillations directly to intracortical regions displaying neural oscillations has long been missing. A recent upsurge in studies has changed this however (VanRullen, 2018). In a series of experiments it was shown that behavioral signatures of attention relate to theta oscillation in Prefrontal Cortex (PFC), highlighting its function as a top-down mechanism and finally providing convincing evidence for the the cyclic nature of attention and its oscillatory substrates (Helfrich et al., 2018; Spyropoulos, Bosman, & Fries, 2018; Fiebelkorn, Pinsk, & Kastner, 2018; Gaillard et al., 2020). These recent developments have given rise to more wholesome theories of attentional processes, incorporating several neural systems assumed to be involved in atten-tion sampling. Fiebelkorn et. al. (2018) identified two attenatten-tional states that directly relate to two opposite phases of theta oscillations in the FEF. During one of these states, the ”poor theta phase”, they observed high alpha power over parietal regions (LIP), effectively inhibiting visual processing at the current lo-cus of attention and allowing for attentional shifts to different potential targets. This state is related to the periods of low performance in periodic behavioral measures. On the other hand the ”good theta phase” was associated to high beta band activity in the FEF and high gamma band activity in LIP. Burst of beta power were hypothesized to reflect surpressed attentional shifts away from the locus of attention whereas increases in gamma in the LIP is assumed
to reflect enhanced processing, leading to the observed increases in performance.
Figure 4. The Frontoparietal attentional network. Fiebelkorn (2018). Atten-tional sampling can be characterized as alternating states of processing (good phase) and shifting (bad phase). Both states map onto certain phases of FEF theta oscillations. During good phases alpha power in parietal regions (LIP) is low, a signature associated with high excitability and thus allowing for effective processing. During bad phases one can observe high alpha power, associated with increased inhibition, which allows the attentional network to shift the focus away from the now-inhibited locus of attention. Figure adopted from Fiebelkorn (2018).
Through sophisticated decoding of intracranial recordings it was demonstrated for the first time that neural signals recorded from the PFC could be used to track the locus of attention in real-time in macaque monkeys (Astrand, Wardak, Baraduc, & Ben Hamed, 2016). Recently the investigators further build upon their initial study by showing that the decoded spotlight rhythmically explores the visual field in line with previously proposed rhythmic theories of attention (Gaillard et al., 2020). The rhythmically sampled locations were highly depen-dent on prior expectation on the target location as well as general expectation about sensory events. Interestingly however attentional sampling was shown to not be solely restricted to the cued relevant locations in the visual field (exploita-tion) but also occasionally sampled uncued locations (explora(exploita-tion), a trade-off that potentially aids the attentional system in case of unexpected events.
In a recent study in macaques it was demonstrated that theta oscillations in V4 play an important role in attention related stimulus competition, resulting in behavioral oscillations at 6 Hz, a finding that we have since reproduced in humans (Kienitz et al., 2018; Chota et al., 2018). These studies represent impor-tant steps towards finding the neural implementation of the system that gives rise to attentional fluctuations. In chapter V I closely reproduce the behavioral findings of the macaque experiment by Kienitz in order to fill in the missing link between neural theta and behavioral theta oscillations. For a more detailed discussion of their findings I refer the reader to the introduction in chapter V.
Most of the studies I described in the previous paragraph were concerned with covered attention, that is, attention without explicitly fixating the object of interest. However one of the most useful tools of our attentional system is the ability to make saccades towards relevant stimuli in our environment (Zhao, Gersch, Schnitzer, Dosher, & Kowler, 2012). Previous research in combina-tion with our findings in chapter V support the idea that specific theta phases are better for processing than others (Busch & VanRullen, 2010; Dugu´e et al., 2011; Kienitz et al., 2018; Chota et al., 2018; Gaillard et al., 2020). It thus seems important that the phase of theta is aligned with saccade execution to optimally process the stimulus that falls on the fovea when the saccade lands. Indeed saccades have been found to phase align theta oscillations in humans and non-human primates (Hoffman et al., 2013). Further evidence links theta oscillations to preparatory processes right before saccade onset (Womelsdorf, Johnston, Vinck, & Everling, 2010; van Noordt, Desjardins, Gogo, Tekok-Kilic, & Segalowitz, 2017). Most interestingly for our purpose, theta phase has been related to the amount of peri-saccadic mislocalization, suggesting it as a pos-sible substrate for several peri-saccadic phenomena (McLelland, Lavergne, & VanRullen, 2016). In chapter VI we investigate if full field masking, assumed to trigger peri-saccadic mechanisms, leads to a distortion of relative time percep-tion, another peri-saccadic illusion potentially caused by oscillatory processes.
1.4
Discrete Perception
Our everyday visual perception is usually experienced as a ”continuous flow”. However, people under the influence of certain psychedelic substances like LSD or those who suffer from akinetopsia (motion blindness) can experience it more
like a discrete series of static images (Dubois & VanRullen, 2011). This in-triguing observation raises an interesting question. Can our visual experience generally be considered continuous and certain substances artificially discretize it? Or is our visual experience generally discretized and certain substances break the neural mechanism that hides the empty spaces in-between from con-scious perception? The theory of discrete perception explores this second idea, proposing that a discrete sampling mechanism governs the temporal structure of our conscious visual perception (VanRullen & Koch, 2003; VanRullen, 2016).
The question whether perception is discrete or continuous outdates the use of EEG or the knowledge about brain rhythms. First considered by William James in 1890 the theory gained popularity when the first EEG recordings were per-formed and it became obvious that the brain is a highly rhythmic organ (Berger, 1931; Johnson & Henley, 2013). The first hypotheses were strongly influenced by the emergence of the cinema, leading to the assumption that visual sampling mechanisms with fast enough sampling rates would appear to be continuous, just like observed with the ”novel” opto-mechanical projectors used at the time (Pitts & McCulloch, 1947; Harter, 1967). One of the most prominent concepts, that of the ”perceptual moment” was promoted by Stroud, and describe a basic interval of time within which all events are subjectively perceived as co-temporal (Stroud, 1956). Stroud’s ideas formed the basis of the modern theory of discrete perception.
Modern discrete sampling in the visual system can loosely be understood in analogy to a digital camera that collects a certain number of frames per second. The idea is that the brain periodically divides the visual input into discrete windows or “perceptual moments” (VanRullen, 2016). Two stimuli that would fall into a single perceptual moment would therefore be perceived as occurring simultaneously, while two stimuli in separate subsequent perceptual moments would be perceived as sequential (Figure 4). A recent upsurge of psychophysio-logical and electrophysiopsychophysio-logical studies have investigated discrete perception in the context of the alpha rhythm (VanRullen & Koch, 2003; Busch et al., 2009; L˝orincz et al., 2009; Haegens et al., 2011; Vijayan & Kopell, 2012; Samaha & Postle, 2015). One of these studies demonstrated that participants with faster alpha rhythms showed higher visual temporal resolution in a two-flash fusion task (Samaha & Postle, 2015). Similarly, when entraining a slightly faster or slower alpha rhythm (IAF ± 2 Hz), using visuo-auditory entrainment,
percep-tion could be sped up or slowed down in a segregapercep-tion/integrapercep-tion task (Ronconi, Busch, & Melcher, 2018). Aiming at implicating the occipital alpha rhythm in a causal manner, we demonstrated that visual entrainment at 10 Hz leads to a periodic modulation of temporal perception in the flash lag effect (FLE) (Chota & VanRullen, 2019). The flash-lag effect is a visual illusion that has been sug-gested to arise from discrete sampling in the visual system (Chakravarthi & Vanrullen, 2012; Schneider, 2018).
Figure 4. Alpha Phase and perception of relative timing. A. Relative tim-ing between alpha phase and the appearance of two sequential flashes with fixed SOA. Beginning and end of discrete perceptual moments are indicated by camera symbols. Note that in the first case the two flashes fall into the same perceptual moment whereas in the second case the flashes fall into two sepa-rate perceptual moment. B. Two stimuli that fall within the same perceptual moment are perceived as occuring simultaneously whereas two stimuli in suc-cessive perceptual moments are perceived as sequential. Figure modified from VanRullen (2003)
It is believed that discrete sampling is serving two primary roles. One is the the reduction of complexity and the other is to facilitate communication in the brain (VanRullen & Koch, 2003; Vanrullen & Dubois, 2011). Complexity reduction is always a trade-off between resources and information.
Dense Sampling Method
The dense sampling method is a behavioral method that allows the researcher to probe the behavioral correlates of dynamic brain processes over time. In the course of this project I made extensive use of this method because it lends itself nicely to investigate oscillatory processes. Usually oscillatory phase is arbitrary at the onset of a trial. The key challenge therefore lies in resetting the phase of the oscillation that is assumed to influence behavior periodically. This reset can be done via visual or auditory stimuli or with TMS pulses. A phasic reset is performed at the beginning of every trial. In the illustration below we see that the phase reset causes the peak of the oscillation to always be at the same time relative to trial onset. Over the course of many trials we can now probe all possible positions and reconstruct the dynamic influence that the hidden underlying process has on behavior.
The dense sampling method is especially useful to investigate fast dy-namical cognitive processes that exceed the number and frequency with which human participants can report perception within a single trial. On the downside this method usually requires an extensive number of trials, increasing the length of experiments.
Fast sampling rates might require the brain to make more computations in a shorter amount of time (Schroeder & Lakatos, 2009). Slow sampling rates might deteriorate perception too severely for efficient interaction with the envi-ronment. Facilitation of communication is assumed to be at least partially al-lowed by synchronizing the phase of two brain regions, therefore aligning phases of excitation and inhibition and maximizing information flow (Fries, 2015). This process, while most likely periodic, is very well compatible with a continuous rhythmic form of information processing and does not require strictly discrete frames. Neural communication however is much more complex than just to op-timize information flow between regions. Stimuli that are processed in different brain regions, potentially different modalities need to be compared, an endeav-our that is immensely complicated by neural communication delays. On top of that a promising new model for brain functioning, that has emerged in the form of hierarchical predictive coding, runs into similar difficulties (Rao & Bal-lard, 1999). In it’s simplest form a predictive coding model is constantly trying to make sense of it’s environment by comparing bottom-up evidence with top-down predictions. If the two do not match then the residual error is propagated up the hierarchy. This process is assumed to run in parallel on all hierarchical layers. Evidently this requires a fine mechanism that allows predictions and evidence to find each other in neural space-time. Discretizing input into quanta might be an elegant solution to create defined ”feature” packages that can be compared. Moreover by concentrating processing to certain phases of the os-cillation the brain creates a defined temporal structure that reduces temporal uncertainty, therefore allowing more precise timing e.g. of top down predictions (Hogendoorn & Burkitt, 2019). The perceptual echoes described in chapter IV have been implicated in predictive coding processes and might be reflective of the propagation of top-down and/or bottom up information along the visual hierarchy, potentially aiding this matching problem in the light of neural time delays (Alamia & VanRullen, 2019).
In the chapter on alpha oscillations we described how the phase of alpha os-cillations relates to excitability fluctuations. This feature of alpha phase is an important one to consider because it introduces a potential alternative expla-nations for the findings in integration/segregation tasks. Alpha phase might modulate task performance not via changes in temporal perception but by de-creasing visibility of one of two stimuli. In this way alpha phase would still periodically modulate time perception but via different secondary mechanisms.
We will refer to this account as the ”soft” version of rhythmic perception. Sepa-rating ”hard” and ”soft” accounts of rhythmic perception necessitates intricate task design that controls for fluctuations in visibility. We describe such a design in chapter III. Our approach was successful and together with the previous lit-erature, supports the idea that the visual system discretely samples the visual scene at a 10 Hz rhythm analogous to the “hard” version of periodic perception (VanRullen, 2016).
1.5
Rhythmic entrainment and phase resets
Now that we have discussed the relationship between behavioral and neuronal oscillations we need to tend towards the directionality of this relationship, that is, what is the causal link between them. Most of the above mentioned studies do not provide evidence on the question if the neural oscillations actually cause the periodicities in behavior. Manipulating stimuli and investigating how brain rhythms change does gives us causal evidence only in one (complex but rather unsurprising) direction. To proof if the neural oscillations are the underlying cause of perceptual and behavioral findings we need to manipulate the oscilla-tions themselves and observe if perception and behavior changes.
TMS
Transcranial Magetic Stimulation is a non-invasive brain stimulation technique. By running a strong biphasic pulse through a form-of-eight coil we can generate a directed magnetic field. When placed on top of the scalp the magnetic field generates a current flow in the superficial parts of the brain which in turn depolarizes cortical cells and causes action potentials. The exact way in which TMS interferes with the brain is unknown, it is however assumed that it targets mostly cortical pyramidal cells. TMS not only lets us target very specific brain regions but also gives us precise temporal control over the stimulation pattern. Recently investigators have started to apply multiple pulses with fixed frequency to measure the brains response to rhythmic input.
I used rhythmic TMS in chapter II to entrain alpha oscillations. Of-ten TMS is used in combination with preceding structural fMRI scans to determine the exact location of the brain to which the coil should be aligned. It is possible to circumvent these extra measurements by using a phosphene mapping procedure: By stimulating the brain over primary visual areas it is possible to elicit visual sensations at specific locations in the visual field. This allows the investigator to map the stimulated location on the scalp to the reported location on the screen and enables precise positioning of the experimental stimulus over the stimulated area. Reproduced from Spronk (2011).
phase of an ongoing oscillation and therefore control the phase in the subsequent time windows. This can be done with single impulses of visual stimulation or TMS in accordance with the following principle: Hypothetically if the stimu-lation is strong enough it depolarizes and homogenizes a subset of the affected neural population (Box ”TMS”) (Savers, Beagley, & Henshall, 1974; Makeig et al., 2002; Klimesch, Sauseng, Hanslmayr, Gruber, & Freunberger, 2007; Romei, Gross, & Thut, 2012). If the neurons involved are intrinsically oscillatory then also their oscillatory phase is reset (Paus, Sipila, & Strafella, 2001; Fuggetta, Fiaschi, & Manganotti, 2005; Rosanova et al., 2009; Herring, Thut, Jensen, & Bergmann, 2015). Over the course of many trials in an experimental setup we can use this to create more or less equal conditions, with respect to the oscil-latory phase, in each trial. We assume that this mechanism at least partially underlies our observations in chapter V and VI. Although this method is very useful it also comes with its limitations. It offers no control over which oscilla-tion we want to phase-reset. This however might be an advantage if one does not want to have prior assumptions on the frequency. Another problem is that single pulses might not be sufficiently strong to reset a behaviorally significant subset of the population. These issues can be resolved by applying multiple pulses as described in the next paragraph.
Another method to interfere with brain oscillations is through rhythmic stim-ulation. Presenting visual stimuli or applying rhythmic TMS pulses at specific frequencies is assumed to directly interfere with the corresponding frequency band. This effect, presumably a result of multiple successive phase resets, can lead to power increases in the respective frequency band (Figure 5) (Herrmann, 2001; Schwab et al., 2006; Spaak et al., 2014; Helfrich et al., 2014). Furthermore we can observe that the increase in power outlasts the stimulation period and critically these short lived effects are behaviorally significant. Entrainment at 10 Hz has been shown to decrease target detection rates, an observation that is frequently linked to high alpha power (Romei et al., 2010; Thut et al., 2011). However we can not only investigate the resulting changes in oscillatory power but we can also probe the effect of phase with this method. Probing different time-points after entrainment reveals fluctuations in target detection and tem-poral perception (Ronconi & Melcher, 2017; Ronconi et al., 2018). I make use of this method in chapter II and III. In chapter IV we use tactile stimulation to probe entrainment effects in the somatosensory system.
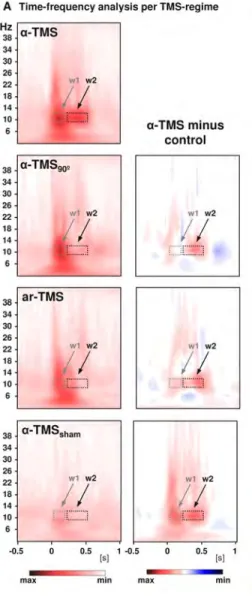
Figure 5. Rhythmic TMS stimula-tion at 10 Hz leads to Alpha entrain-ment. Alpha TMS was applied per-pendicular to a target gyrus (Row 1). The time-frequency represen-tation shows increased alpha power compared to baseline in the 300 ms window following stimulation. Row 2,3 and 4 are direct comparisons between the main condition (Row 1) and control conditions in which the coil was rotated by 90 degrees (Row 2), a-rhythmic TMS was ap-plied (Row 3) or the tms mode was set to inactive. We can observe that broad band activity emerged for all active conditions during stimulation (w1). Contrasts (second column) show that lasting alpha oscillations are only present in the main con-dition (w2). Figure adopted from Thut (2011).
1.6
Main Research Questions
Oscillatory activity seems to have profound effects on multiple aspects of our perception and might be strongly involved in the way we sample our visual en-vironment. Many of these relationships however are poorly understood, specif-ically in their causal-directional nature. This poses a problem since a purely correlational link between perception and brain states does not allow us to
in-fer if the two are functionally linked at all. It might simply be the case that oscillations arise as a irrelevant by-product of other cognitive processes, as a mere epiphenomenon. This theoretical possibility is demonstrated in a recent publication by Alamia et. al. who implemented a simple predictive coding in-spired network with biologically plausible time constants (Alamia & VanRullen, 2019). The network uses inhibitory feedback to predict the activity of lower layers in a recursive manner. Most importantly the network is not constructed to make use of rhythmic processing to solve the task. When stimulated with random noise sequences however we can observe strong oscillatory activity with frequencies dependent on the choice of time constants. The oscillations in this specific implementation of the network correlate with the input sequence but do not serve any functional purpose. Hypothetically we could expand this idea to the whole brain since the generation of oscillatory activity is very easily ac-complished e.g. using inhibitory feedback (Wang, 2010). So how can we know if a certain brain rhythm is actively involved in solving a specific task instead of being an epiphenomenon? In order to answer this question we need to be able to directly modulate rhythmic activity and observe the changes that occur in per-ception and behavior. As described above, non-invasive stimulation techniques like TMS or rhythmic visual stimulation, and even random noise stimulation have proven useful tools to manipulate brain rhythms.
In this thesis, I make use of these non-invasive methods to investigate the causal role of neural oscillations in temporal sampling mechanisms. The origi-nal manuscripts in chapter II and III are dedicated to perceptual sampling in the alpha band. Early behavioral studies have found that the minimal delay between two offset stimuli to induce a perception of motion was around 100 ms (Wertheimer, 1912; Anstis, 1978). It was logically followed that the duration of the frame that allowed for integration of two stimuli and their relative timing was around 100 ms. If stimuli were closer together, then relative timing could not be discerned. The alpha band became a interesting subject in explaining how the brain might implement such frames because it naturally cycled every 100 ms (Valera et al., 1981). Several decades of research later the alpha band is still an interesting candidate proposed to implement discrete windows in vision so that visual information is periodically compressed at a rate of approximately 10 Hz. (VanRullen, 2016). While we have many correlational studies showing it’s relationship to temporal perception, there is still no clear evidence that alpha ac-tively implements a mechanism to discretely sample visual input (Chakravarthi
& Vanrullen, 2012; Samaha & Postle, 2015). The matter is further complicated by the findings that alpha phase modulates cortical excitability (Busch et al., 2009; Haegens et al., 2011; Dugu´e et al., 2011). This observation had led to the distinction between ”hard” and ”soft” version of discrete perception, where the hard version refers to true modulations of time perception and the soft version refers to indirect modulations of time perception through excitability fluctua-tions (e.g. occlusion of one stimulus). In chapter II and III we therefore set out to test if rhythmic stimulation, via visual entrainers or TMS at 10 Hz, could modulate the alpha rhythm in such a way that perception of relative timing could be changed. More specifically we stimulated at an alpha rhythm and probed temporal perception at different phases of the entrained oscillation. If specific phases of the alpha cycle mark the beginning of discrete frames then behavior should be dependent on the phase were stimuli were presented. Impor-tantly we aimed at controlling for the previously described effect of excitability to ensure that our findings support the ”hard” version of discrete perception.
Besides the behavioral oscillations investigated in chapter II and III there are also neural signatures that hint at the intrinsic periodicity with which sen-sory cortices collect information. When presented with random noise lumi-nance sequences the visual system responds with long lasting reverbrations at 10 Hz (VanRullen & Macdonald, 2012). These reverbrations, revealed by cross-correlating input sequences with the concurrent EEG signal, have been termed perceptual echoes. An especially stunning feature of these echoes is that they suggest that the visual system periodically ”re-activates” the 10 Hz component of the stimulation sequence for up to 1 second. Since alpha oscillations usually de-synchronize very consistently in response to visual stimulation (Klimesch, Sauseng, & Hanslmayr, 2007) the echoes indirectly implicate alpha in active stimulus processing. However, few studies have provided concrete insights into the functional role of these echoes (Chang, Schwartzman, VanRullen, Kanai, & Seth, 2017). It has been proposed that perceptual echoes reflect a mech-anism by which the brain transforms a continuous visual input stream into periodically structured activity (Schwenk, VanRullen, & Bremmer, 2020). The cross-correlation between EEG and white noise,(which per definition containing equal power in all frequency bands) produces the Impulse Response function of the brain, in other words the echoes reflect the function that the brain applies to the incoming signal. Thus one interpretation is that the brain filters the visual input at 10 Hz which is very similar to periodic sampling at 10 Hz.
Other sensory modalities have been hypothesized to sample their input in a similar fashion compared to the visual system. Beta oscillations in the so-matosensory system have been demonstrated to modulate temporal integration performance in a periodic fashion (Baumgarten, Schnitzler, & Lange, 2015). If beta oscillations serve the same function in the visual as compared to the tactile domain then we should expect to find perceptual echoes in the tactile domain as well, although at the beta frequency. Extending the existence of perceptual echoes to other modalities would provide evidence that 1. these other modali-ties also process information periodically and 2. that they utilize similar neural mechanisms for this purpose. In the original manuscripts in chapter IV I inves-tigated if we can find perceptual echoes in the tactile domain.
The periodic sampling mechanisms of the brain seem to be dissociable into a more low-level perceptual and a more high-level attentional sampling mech-anism. Attentional sampling is assumed to be more flexible, task dependent and has been hypothesized to be caused by theta rhythmic activity in PFC. Providing support for these findings in humans would help us to identify the oscillatory mechanism that is responsible for behavioral attentional fluctuations found in many studies. The original manuscript in chapter V presents a study in which we replicate behavioral findings of the macaque-study in humans.
Which location in the visual field attentional sampling mechanisms collect in-formation from depends strongly on the position of our eyes. Saccades and attentional sampling need therefore be highly coordinated. One way to syn-chronize these two systems is through oscillatory activity. It has been proposed that saccades, and surprisingly also strong visual transients, can reset the phase of theta oscillations which in turn allow for well timed processing of relevant stimuli. If this mechanism indeed relies on rhythmic activity then we should be able to disrupt it and observe corresponding errors in attentional sampling. The original manuscript in chapter VI investigates which effects strong visual disruptions have on the perceived relative timing of two stimuli.
During my doctorate I sought to answer the following research questions:
vi-sual information? (chapter II and III)
2. Is there a link between oscillatory activity and rhythmic sampling in the somatosensory system?(chapter IV)
3. Can we manipulate theta rhythmic activity to modulate attentional sam-pling? (chapter V and VI)
Chapter 2
Visual Entrainment at 10
Hz Causes Periodic
Modulation of the Flash
Lag Illusion
The following chapter contains the original manuscript that appeared as: Chota, Samson, and Rufin VanRullen. ”Visual Entrainment at 10 Hz causes periodic modulation of the Flash Lag Illusion.” Frontiers in neuroscience 13 (2019): 232.
2.1
Abstract
It has long been debated whether visual processing is, at least partially, a dis-crete process. Although vision appears to be a continuous stream of sensory in-formation, sophisticated experiments reveal periodic modulations of perception and behavior. Previous work has demonstrated that the phase of endogenous neural oscillations in the 10 Hz range predicts the “lag” of the flash lag effect, a temporal visual illusion in which a static object is perceived to be lagging in time behind a moving object. Consequently, it has been proposed that the flash lag illusion could be a manifestation of a periodic, discrete sampling mechanism in the visual system. In this experiment we set out to causally test this hypoth-esis by entraining the visual system to a periodic 10 Hz stimulus and probing the flash lag effect (FLE) at different time points during entrainment. We hy-pothesized that the perceived FLE would be modulated over time, at the same frequency as the entrainer (10 Hz). A frequency analysis of the average FLE time-course indeed reveals a significant peak at 10 Hz as well as a strong phase consistency between subjects (N = 25). Our findings provide causal evidence for fluctuations in temporal perception and indicate an involvement of occipital alpha oscillations.
2.2
Introduction
It has been suggested that perception may be a periodic process (VanRullen, 2016). The detection probability of near-threshold stimuli has been shown to oscillate between 5 and 15 Hz in vision (Busch et al., 2009). Reaction times are governed by similar periodic fluctuations in the 10 Hz range (Callaway & Yeager, 1960; Ba¸sar, Ba¸sar-Eroglu, Karaka¸s, & Sch¨urmann, 2001). While it was theorized that the endogenous alpha oscillations of the brain might give rise to these periodicities, their functional relevance is an ongoing enigma. One possible functional role for these neural rhythms is that of a periodic sampling mechanism (VanRullen & Koch, 2003; Busch et al., 2009; L˝orincz et al., 2009; Haegens et al., 2011; Vijayan & Kopell, 2012; Samaha & Postle, 2015; Van-Rullen, 2016): in order to reduce the complexity of the visual stream, the brain is repeatedly dividing the incoming visual information into temporal chunks or windows; these chunks are then passed on for further processing and sub-sequently made consciously available. Few studies have explicitly tested the periodicity of temporal perception (and thus, the more conservative or “hard”
definition of discrete perception). Samaha and Postle demonstrated that the individual alpha peak frequency is predictive of the performance in the two-flash-fusion paradigm (Samaha & Postle, 2015). Opposite phases of the alpha rhythm are related to perception of synchronicity and a-synchronicity, respec-tively (Valera et al., 1981; Milton & Pleydell-Pearce, 2016). Of high importance for this study are the findings by Chakravarthi and VanRullen (2012), relating the perceived flash lag duration to the phase of endogenous alpha oscillations using EEG.
In this study we were interested in providing causal evidence for a periodic modulation of time perception. To our knowledge only one study has succeeded in this so far. In a recent publication by Ronconi et al. (2018) it was shown that visuo-auditory entrainment at the individuals alpha frequency + or -2 Hz was able to modulate the integration or segregation of two stimuli in close tempo-ral proximity. In this study we seek to provide an important addition to these findings by demonstrating a causal influence of alpha on the perception of time, using a well investigated visual illusion, the flash lag effect (FLE).
Discrete sampling in the visual system has previously been hypothesized to underlie the FLE (Chakravarthi & Vanrullen, 2012; Schneider, 2018). In the FLE a stationary object is shortly presented (“flashed”) alongside a moving object. Although the position of both objects is identical at the onset of the flashed, stationary object, observers systematically judge the flashed object to be lagging behind (Figure 1A). In the past years a new hypothesis regarding the FLE has been suggested, most prominently by Schneider (2018). He suggests that the FLE and other related illusions are a natural result of a discrete pe-riodic sampling process. The theory states that visual information is collected over the time course of a so called “perceptual moment.” While information is collected continuously, the position of the object is registered only at the end of the perceptual moment and at its last known position. We can imagine a scenario where the static object is flashed right at the beginning of the percep-tual moment (Figure 1A). The moving object would then move on for a specific period, until the end of the perceptual moment, at which the position of both objects is registered. In case A the perceived offset between moving and static object would be maximal. On the contrary, if the static object is flashed right at the end of the perceptual moment, the moving object would not move any further before the positions are registered, and the perceived offset would be
minimal (Figure 1B). Based on the findings that the average perceived FLE is around 50 ms, with a standard deviation of 50 ms, the duration of a perceptual moment should be around 100 ms, which was verified by Schneider who inves-tigated a large FLE dataset by Murakami (2001).
In this account, whether a long (Figure 1A) or short (Figure 1B) flash-lag illu-sion occurs on a given trial is mainly determined by the phase of the discrete sampling cycle at the moment of the flash onset. As this phase is generally un-known to the experimenter, the trial-to-trial variability in the illusion strength is often interpreted as noise. Some studies, however, have directly measured this phase with EEG, and verified that it influenced the flash-lag magnitude (Chakravarthi & Vanrullen, 2012). Here, our aim was to causally modulate the phase of the discrete sampling cycle by modulating the luminance of an annulus that surrounded a clock stimulus, and to prove that this phase had a causal influence on the flash-lag illusion. The FLE was randomly probed at 120 con-secutive time points over the course of the entrainment (Figure 2). A frequency analysis of the average time course revealed a modulation of the perceived FLE duration at 10 Hz. We conclude that the visual stimulus entrained the discrete neural sampling mechanism, leading to a periodic modulation of the FLE.
2.3
Materials and Methods
2.3.1
Participants
Twenty five participants (aged 18–30, 13 females) with normal or corrected to normal vision participated in the experiment. Informed consent forms were signed before the experiment. The experiment was carried out in accordance with the protocol approved by the Centre National de la Recherch´e Scientifique ethical committee and followed the Code of Ethics of the World Medical Asso-ciation (Declaration of Helsinki).
Figure 1. The flash lag illusion as a consequence of discrete sampling. Fol-lowing the hypothesis of Schneider (2018), the visual system samples the visual scene, here a clock with rotating clock hand, during reoccurring intervals (“per-ceptual moments,” indicated by spaces between camera symbols). The end of these perceptual moments or “snapshots” (camera symbols) marks the registra-tion of the stimulus posiregistra-tion [the orientaregistra-tion of the clock hand and the flashed cue (red circle)]. The stimuli are registered at the last known position. This is always the correct position for the clock hand, since it is moving at a fixed speed and constantly updated, but not for the transient red cue since the pre-sentation dates back in time, and instantaneous updating cannot occur. Hence, a systematic lag of the red cue is perceived, its magnitude depending on the relative onset between cue and snapshot (camera symbol). In Panel A the red cue is presented very early in the perceptual moment. The temporal distance between the cue presentation and the end of the snapshot is large, leading to a long perceived flash lag. In Panel B the red cue is presented very shortly before the end of the perceptual moment. A short amount of time passes until the stimulus position is registered, and the perceived flash lag is brief.
2.3.2
Protocol
Stimuli were presented at a distance of 57 cm with a LCD display (1920 × 1080 resolution, 120 Hz refresh rate) using the Psychophysics Toolbox (Brainard, 1997) running in MATLAB (MathWorks). Stimuli consisted of a central fixa-tion dot (diameter = 0.3°), a central clock stimulus (radius = 2°) with a black border (width = 0.3°), 60 evenly spaced clock markers (12 with length = 0.4°,
48 with length = 0.3°) and a rotating clock hand (length = 0.7°). The gap between the clock hand and the clock border was 1.3° and between clock hand and long clock marker 0.9°. The entrainer annulus and the clock hand were separated by 1.5°. The clock was surrounded by an entrainer annulus (outer ra-dius = 11.5°, inner radius = 3.5°). Stimuli were presented on a gray background. Trials started with the fixation point on the screen (Figure 2A). Participants initiated the trial via button press. Directly after the button press the entrainer annulus as well as the clock stimulus appeared on the screen with the clock hand rotating with 1 rotation/s. The luminance of the entrainer annulus was modulated sinusoidally at 10 Hz with the luminance ranging from 0 to 255 (0.68 to 100.8 cd/m2). At a random time point between 1000 and 2000 ms (SOA win-dow) a cue was presented (the frame of the clock stimulus turned red) for 66 ms (eight frames). Afterward the clock hand continued rotating until the 3000 ms mark was reached. After a delay of 1000 ms an identical clock with a static hand was presented. The participant could rotate the clock hand with the arrow keys to indicate the perceived location of the clock hand at the time point of Cue onset. The Cue onset was randomly chosen from a discrete uniform distribution of the 120 SOAs between 1000 and 2000 ms. Participants each performed 480 trials resulting in 4 responses per SOA. Participants were instructed to maintain central fixation during the 3 s window when the clock was on the screen. The starting position of the clock hand was randomized between subjects but was kept constant for a single subject.
2.3.3
Control Experiment
We conducted a control experiment to verify that the observed modulation was due to neural entrainment and not simply due to the luminance of the annulus. A new set of participants (N = 25) conducted a similar experiment where the luminance of the annulus was kept constant throughout the trial. Instead of testing all 7 luminance values we tested the most extremes ones (black and white) as well as 50% luminance (gray) at which the annulus is indistinguishable from the background. In the original experiment 40 trials were collected for each of the two extreme luminance values and 80 trials for the 50% luminance per participant. In the control experiment we collected 40 trials for each of the three luminance values resulting in 120 trials per subject. To compare the perceived FLE between the luminance values a one-way-ANOVA was conducted.
2.3.4
Data Analysis
Attributing one SOA (frame 1 to frame 120) to every position of the clock hand we can define the FLE duration as the temporal distance (in frames) between the actual onset of the Cue (position of the clock hand when clock border turns red) and the orientation of the clock hand that the participant indicated. Note that we define SOA as the temporal distance to the onset of the central 1 s window, within which the Cue could appear. We restricted our analysis on responses that were within 3.5 times the standard deviation of each individual participant (mean: 290.2 ms, SEM: ±22.3 ms) before or after the actual Cue onset. Single trial responses were averaged over the respective SOA (4 per SOA, 120 SOAs). The resulting time course represents the average FLE as a function of time for one individual. The individual time course was then down-sampled from 120 to 60 Hz. To eliminate effects of the position of the clock hand on the flash lag illusion, we fitted a 1 Hz sinus function and subtracted it from the individual time course. The frequency of the fit was determined by assuming that any effects stemming from the clock hand position should influence the flash lag illusion at a frequency identical to the revolution frequency 1 Hz. We then normalized the data by applying a moving z-score window of length 116 ms. A 116 ms window (7 SOAs) of the original data was z-scored and the central value was saved in a separate array. The window was then shifted by 16 ms (1 SOA) and the process was repeated resulting in one normalized time course per subject. We validated in a separate re-analysis that the length of the window did not affect our findings. Window lengths of 60 ms up to 208 ms lead to comparable modulations at 10 Hz.
Individual time courses were then averaged and analyzed in the frequency do-main using FFT. 60 SOAs at 60 Hz allowed for a Nyquist frequency of 30 Hz. Only frequencies from 1 Hz to 2/3 of the Nyquist frequency (1 to 20 Hz, 20 values) were considered. The complex FFT coefficients were squared to obtain oscillatory power at each frequency. To statistically test if the power at 10 Hz is significant we calculated 5000 surrogates by shuffling the SOA-labels between trials, and repeating all analysis steps for each surrogate as explained above (60 Hz down-sampling, 1 Hz detrending, normalization). The original power spectrum was then compared to the surrogate distribution and p-values were corrected for multiple comparisons using the False Discovery Rate. Individual Phase angles were extracted from the 10 Hz component of the FFT of the
down-sampled and normalized time-courses. Rayleigh’s test for non-uniformity was used to statistically test if individual phases were significantly coherent.
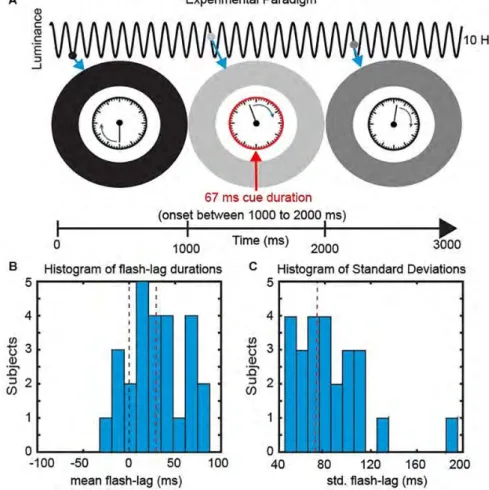
Figure 2. Experimental Paradigm. (A) We presented a clock consisting of a static frame and a rotating clock hand for 3000 ms. The clock hand was rotating at one revolution per second and was surrounded by an entrainer annulus that periodically changed its luminance (from white to black) with a frequency of 10 Hz. At a random time point, within the central 1000 ms, a cue was presented in the form of the clock frame flashing red for 67 ms. Subsequently Partici-pants reported the orientation of the clock hand at the onset of the cue. (B) Behavioral Data. The mean perceived FLE duration was 32.4 ms (SEM across subjects: 6.48 ms). (C) The mean std. across trials was 75.4 ms (SEM across subjects: 6.42 ms).
2.4
Results
In the current study, we investigated the causal influence of a periodic entrainer on the perceived FLE duration. We presented participants with a clock stimulus containing a clock hand revolving at 1 Hz. The clock stimulus was surrounded by an entrainer annulus that changed its luminance from black to white peri-odically (following a sine function) at 10 Hz. At random SOAs we presented a cue by turning the frame of the clock red. Participants were then instructed to indicate the position of the clock hand at the onset of the Cue.
The mean FLE duration (misperception in milliseconds) across observers was 32.4 ms (±6.48 ms, SEM) (Figure 2B). Across trials the perceived FLE had an average standard deviation of 75.4 ms (±6.42 ms, SEM across subjects) (Figure 2C). Large standard deviations have been previously reported and have been shown to be unaffected by low level stimulus features (Linares et al., 2009; Chakravarthi and VanRullen, 2012). We were specifically interested in explain-ing this variability over trials in the context of a discrete samplexplain-ing framework.
2.4.1
Visual Entrainment Modulates the Perceived FLE
In order to verify an effect of the visual entrainment on the perceived FLE we calculated the average FLE time-series over individuals across the 120 SOAs. The original FLE time-series were down-sampled from 120 to 60 Hz, de-trended by subtracting the 1 Hz Fourier component and normalized using a moving z-score, before averaging (window length 116 ms. See “Materials and Methods” section). Initial inspection of the time course (Figures 3A,B) indicates a strong oscillatory component, coupled with the background luminance modulation, in the 10 Hz range. To quantify this, we performed a frequency analysis on the preprocessed FL time-series. The resulting power spectrum revealed a dominant oscillation at 10 Hz (Figure 3C). To statistically test the significance of this peak we created 10.000 surrogates by shuffling the 120 SOA-bin labels within subjects and recalculating the power spectrum. P-values were computed as the percentile of the mean power values within the bootstrapping distribution. This allowed us to test the null-hypothesis that the power spectrum of the average FLE time course does not show a peak at a specific frequency. All preprocessing steps were kept identical for the surrogates. The FLE time course oscillatory power at 10 Hz was significantly higher compared to the surrogate distribution
(Figure 3C, p = 0.028, FDR corrected). Further peaks at 2 Hz as well as 4 Hz were significantly higher than the surrogate distribution. These oscillatory components might reflect slower attentional or strategic effects that have been shown to influence performance at low frequencies (Wyart et al., 2012). As we only manipulated the 10 Hz component via flicker stimulation, we elected to focus on this component.
Figure 3. Main findings. (A) Average time course of FLE (N = 25). Before averaging the individual time courses were down-sampled from 120 to 60 Hz, detrended by subtracting the 1 Hz Fourier component and normalized using a moving z-score (window length 116 ms. See “Materials and Methods” section). The gray bars in the background indicate the luminance of the entrainer annulus at the moment of cue presentation. Transparent area shows the inter-subject SEM for the respective time point. (B) Average cycle of the oscillation observed in (A). Background Gray-scale bars indicate the luminance of the annulus at cue onset. Note that due to the down-sampling of the time course the six points of this average cycle always fall between two consecutive luminance bars. (C) power spectrum of the average FLE time-course. The peak at 10 Hz was statistically compared to a surrogate distribution (10.000 surrogates) and was significant after correcting for multiple comparisons (p = 0.004, FDR-corrected: p = 0.028). Colored areas: Dark gray, mean of the surrogate distribution; Light gray, 95% confidence interval; Green, 99% confidence interval; Brown, >99% confidence interval. (D) Rose plot of the 10 Hz phases angles of individual FLE time-courses. The Rayleigh’s test of non-uniformity reveals a significant phase coherence between individual 10 Hz phases (p = 0.007).
We also analyzed the phase-consistency of the 10 Hz oscillation across sub-jects. The complex FFT coefficients at 10 Hz were extracted to calculate indi-vidual phase angles. We then compared these angles using Rayleigh’s test for
non-uniformity testing the null hypothesis that the phase angles are randomly distributed. Phase angles were significantly clustered (Figure 3D, p < 0.05).
2.4.2
Control for Annulus Luminance
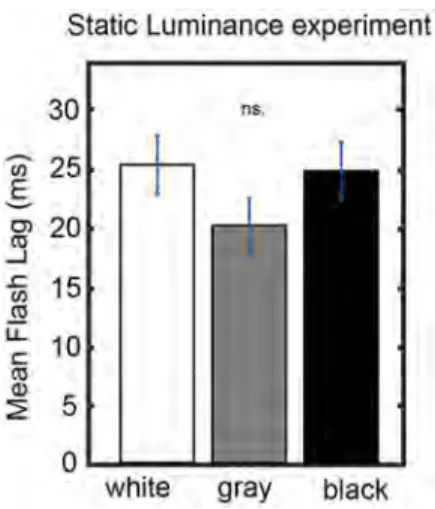
Figures 3A,B show that bright luminance values tend to induce lower FLE values compared to dark luminance values. In accordance with our hypothesis, we interpret this effect as a result of the entrainment of the discrete sampling mechanism to the rhythmic luminance modulation. However, an alternative interpretation could be that the luminance of the background (even when it is not rhythmically modulated) has an effect on FLE. In order to control for the possible confound that the modulation in perceived FLE was caused merely by the luminance values of the annulus rather than neural entrainment caused by the dynamics of the stimulus, we conducted a control experiment (N = 25). The experimental parameters were kept identical to the dynamic entrainment condition with the exception of the annulus, which had a static luminance of 0% (black), 50% (gray) or 100% (white) throughout the trial. We statistically compared the perceived FLE in the three static luminance conditions using a one-way ANOVA (Figure 4). No significant difference in perceived FLE was observed between luminance conditions [F(2,2955) = 1.616, p = 0.19]. We conclude that the luminance of the entrainer is not the main factor that explains the observed FLE modulation in the main experiment. Instead, it is likely that the rhythmic modulation of this luminance played a key role via rhythmic entrainment, in line with our hypothesis.
Figure 4. Control experiment. Static luminance annuli were used to measure the effect of back-ground luminance on the per-ceived FLE. The task paradigm was kept constant to that of the main experiment with the excep-tion of the static annulus lumi-nance. We did not find a sig-nificant effect of annulus lumi-nance on the perceived FLE be-tween any luminance conditions (one-way ANOVA, F(2,1977) = 0.02, p = 0.98).
2.5
Discussion
In this study we tested the causal influence of a visual entrainer at 10 Hz on the flash lag illusion. We found that the perceived FLE duration was periodically modulated at the entrainer frequency of 10 Hz and that these oscillations in the individual FLE time-series were strongly phase coherent between subjects. The oscillatory fluctuation in the perceived temporal offset between the moving and flashed object in the flash lag illusion is a direct demonstration of a rhythmic modulation of time perception. Our findings therefore provide strong causal evidence for the “hard” theory of discrete perception.
Our experiment was based on the discrete sampling hypothesis of perception (Valera et al., 1981; VanRullen & Koch, 2003; Busch et al., 2009; L˝orincz et al., 2009; Haegens et al., 2011; Vijayan & Kopell, 2012; Samaha & Postle, 2015; Van-Rullen, 2016), which claims that the visual system periodically divides incoming visual information in discrete chunks. In the context of the flash lag illusion, visual information is assumed to be periodically collected over the course of a fixed time frame, sometimes called a “perceptual moment,” at the end of which the last known positions of the objects are registered (Schneider, 2018). If two objects are presented, one static and flashed and another moving continuously, a systematic offset between real and registered position is introduced, depending on the relative timing between presentation of the static object and the end of the perceptual moment (Figure 1).
The idea of a discrete sampling mechanism in vision affecting temporal per-ception has enjoyed a recent upswing in interest. Most recently it was shown that audio-visual entrainment at a participant’s individual alpha frequency in-fluences performance in a visual integration/segregation task (Ronconi et al., 2018). Similarly, the phase of alpha oscillations can predict performance in a synchronous/asynchronous task (Valera et al., 1981; Milton & Pleydell-Pearce, 2016). Furthermore the frequency of individual alpha oscillations has been re-lated to the participant’s two-flash fusion threshold, suggesting that visual sys-tems with faster alpha rhythm sample the visual scene more frequently (Samaha & Postle, 2015). The above findings forward the existence of a certain integra-tion window in the visual system within which informaintegra-tion is merged. The fact that these windows can be dynamically modulated by rhythmic stimulation in psychophysical experiments as well as the correlational evidence provided by