Direction des bibliothèques
AVIS
Ce document a été numérisé par la Division de la gestion des documents et des archives de l’Université de Montréal.
L’auteur a autorisé l’Université de Montréal à reproduire et diffuser, en totalité ou en partie, par quelque moyen que ce soit et sur quelque support que ce soit, et exclusivement à des fins non lucratives d’enseignement et de recherche, des copies de ce mémoire ou de cette thèse.
L’auteur et les coauteurs le cas échéant conservent la propriété du droit d’auteur et des droits moraux qui protègent ce document. Ni la thèse ou le mémoire, ni des extraits substantiels de ce document, ne doivent être imprimés ou autrement reproduits sans l’autorisation de l’auteur.
Afin de se conformer à la Loi canadienne sur la protection des renseignements personnels, quelques formulaires secondaires, coordonnées ou signatures intégrées au texte ont pu être enlevés de ce document. Bien que cela ait pu affecter la pagination, il n’y a aucun contenu manquant.
NOTICE
This document was digitized by the Records Management & Archives Division of Université de Montréal.
The author of this thesis or dissertation has granted a nonexclusive license allowing Université de Montréal to reproduce and publish the document, in part or in whole, and in any format, solely for noncommercial educational and research purposes.
The author and co-authors if applicable retain copyright ownership and moral rights in this document. Neither the whole thesis or dissertation, nor substantial extracts from it, may be printed or otherwise reproduced without the author’s permission.
In compliance with the Canadian Privacy Act some supporting forms, contact information or signatures may have been removed from the document. While this may affect the document page count, it does not represent any loss of content from the document.
Preparation, Characterization, and Rheological
Properties of Star-Shaped Poly( ethylene glycol) with a
Cholane Core and Study of Its Effect on Red Blood Cell
Aggregation
parFlorence Janvier
Département de chimie Faculté des Arts et des Sciences
Mémoire présenté à la Faculté des études supérieures en vue de l'obtention du grade de Maître ès Science (M.Sc.)
en chimie
option génie biomédicale
Avril 2009
Faculté des études supérieures
Ce mémoire intitulé :
Preparation, Characterization, and Rheological Properties of
Star-Shaped Poly(ethylene glycol) with a Cholane Core and Study
of Us Effect
on Red Blood Cell Aggregation
Présenté par : Florence Janvier
A été éval.ué par un jury composé des personnes suivantes :
Suzanne Giasson, président-rapporteur Julian Zhu, directeur de recherche
Guy Cloutier, co-directeur Jean-François Masson, membre du jury
RÉSUMÉ
L 'hyper-agrégation des globules rouges (érythrocytes) est reliée à plusieurs
pathologies telles que la thrombose, l'anémie falcifonne, le diabète et l'athérosclérose. Les polymères poly (éthylène glycol) PEG et le copolymère Pluronic sont utilisés pour la modification de l'agrégation érythrocytaire. Pluronic est un polymère bloc amphiphile composé d'un bloc hydrophobe de poly(propyléthylène glycol) (pPG). Récemment, des inquiétudes concernant des réactions allergiques du au PPG contenu dans le Pluronic ont été soulevées. Par conséquent, nous avons proposé l'utilisation d'un polymère PEG amphiphile en fonne d'étoile composé de l'acide cholique. L'acide cholique est un acide biliaire naturel qui est synthétisé dans le corps humain. Ces caractéristiques rendent le polymère en fonne d'étoile de PEG composé de l'acide cholique (CA(PEG)4) très promoteur comme agent potentiel pour la réduction de l'agrégation érythrocytaire. Les polymères CA(pEG)4 ont été synthétisés par la polymérisation anionique. La structure chimique et les propriétés physiques de ces polymères ont été caractérisées par la chromatographie d'exclusion stérique et la diffusion de la lumière par angles multiples. Les rayons hydrodynamiques des polymères ont été détenninés par la viscosité intrinsèque en utilisant la relation d'Einstein. Les effets des polymères CA(pEG)4 sur la viscosité sanguine humaine et sur l'agrégation érythrocytaire ont été évalués et comparés aux PEGs linéaires par des mesures viscométriques et par agrégométrie. Les résultats de l'aggrégomètre ont démontré que le CA(PEG)4 inhibite l'agrégation érythrocytaire mais cependant, la réduction de la viscosité sanguine n'était pas significative. L'inhibition de l'agrégation érythrocytaire du polymère CA(pEG)4en fonne d'étoile était similaire à celle des PEGs linéaires.
Mots-clés: polymère étoilé de PEG, agrégation des globules rouges, agrégation
ABSTRACT
Elevated red blood cell (i.e., erythrocyte) aggregation is a phenomenon closely related to several pathophysiological diseases such as thrombosis, diabetes, sickle cell disease, and athrerosclerosis. Non-ionic linear polymers such as poly(ethylene glycol) (PEG) and Pluronics have shown inhibitory effect against erythrocyte aggregation. Pluronics are amphiphilic polymers composed of a central hydrophobic moiety core, poly(propylethylene glycol) (pPG) tlanked by two PEGs. Recently, a number of concems have been raised on the allergenicity of PPG in the Pluronics. Therefore, we suggested the use of an amphiphilic star-shaped PEG polymer based on cholic acid core. Cholic acid is a natural bile acid produced in the human liver; therefore, it should confer more biocompatibility. These features made the cholic acid based PEG (CA(PEG)4) an attractive polymer to be used in the reduction of erythrocyte aggregation. The CA(PEG)4 polymers were synthesized by anionic polymerization. The narrow molar mass distribution of the star-shaped polymers was characterized by size exclusion chromatography alone and coupled to a multi angle laser light scattering. The addition of the laser to size exclusion chromatography provided additional information about the branching character. The hydrodynamic radius of the star-shaped CA(PEG)4 was calculated from their intrinsic viscosities using the Einstein viscosity relation. The effects of the star-shaped CA(PEG)4 on human erythrocyte aggregation and blood viscosity were investigated and compared to linear PEGs by me ans of viscometry measurements and laser aggregometry. The aggregometer data showed inhibition of erythrocyte aggregation for the star-shaped CA(pEG)4 polymer, however, the reduction in blood viscosity was not significant. Compared to linear PEGs of the same molar mass, the star-shaped CA(PEG)4 pol ymer inhibited red blood cell aggregation in a similar manner.
Keywords : Star-shaped PEGs, red blood cell (RBC) aggregation, erythrocyte aggregation , cholic acid based polymers.
TABLE OF CONTENTS
LIST OF TABLES ••••••••••••••••••••••••••••••••••••••••••••••••••••••••••••••••••••••••••••••••••••••••••••••••••••••.... "VIII LIST OF FIGURES ••••••••••••••••.•••••••••••••••••••••••.•••.••••••••••••••••••••••••••••••••••.••.••••.•..•.•..•...•.. IIX LIST OF SYMBOLS AND ABBRE"VIATIONS ... XV A C~ 0 WLEDGEMENTS ..••••••.•••••••.••••••..••.••••••...•.•••.•••.•••.•••.•••••••.••..•••.••.••••••.•••••••••• XV"II
CHAPTER l:INTRODUCTION ..••..••.•••.•••.••.•••.••••••.••••.••••••••••••••••••.•••••••.••••••.••••...•... 1
1.1 Blood Components ....•...•..•...••...•...••.•.•.••.•••.•••.•.•.•••.•.•.•••••••.••.•...•••.•••.••.•...•... 2
1.2 Hemorheolog)' •••••••••••••••••••••••••••••••••••••••••••••••••••••••••••••••••••••••••••••••••••••••••.•••••••.••.•••....•.• 4
1.2.1 General principles of rheology ... 4
1.2.2 Blood viscosity ... 8
1.2.3 Blood viscosity in rotation al viscometers ... 10
1.2.4 Mechanism ofred blood cell aggregation ... 12
1.3 Disorders Related to Abnormal RBC Aggregation ... 15
1.4 Blood Rheolog)' Modiflers: Macromolecules ...•••.•••.••.•...•.. 15
1.4.1 Dextran ... 16
1.4.2 Poly(ethylene glycol) (PEG) and Pluronics ... 17
1.5 BUe Acids and thei, Derivatives •••••••••••••••••••••••••••••••••••••••••••••••.••••••.••••••••••••••••••••.•.... 20
1.5.1 Nature ofbile acids ... 20
1.5.2 Properties ofbite acids ... 23
1.5.3 Polymers based on bile acids ... 25
1.6 The main objectives •.•....•.•.••...•...•.•.•••.•.•.••••••••••••••••••.•••••••.•••••••••••••••••••••••••••••.•••••••• 29
CHAPTER 2: EXPERIMENTAL PROTOCOLS ••••••••••••••.••••••••••••••••••••••••••••••••••••.•••••• 30 2.1 Preparation of Star-Shaped Polymers with a Cholane Core ... 30
2.1.1 2.1.2 Description of the experimental techniques ... 30
2.1.3 Preparation of cholic acid methyl ester (CAME) ... 32
2.1.4 Preparation of (2' -hydroxy lethy lene )-3 Cl, 7 Cl, 12Cl -trihydroxy-513-cholanoamide (CA-NHCH2CH20H) ... 33
2.1.5 Anionic polymerization of ethylene oxide ... 33
2.2 Character;zation Methods .•.•.•...•.•.•...•.•...•..•...•...•.•... 37
2.3 Blood-Related Experiments ...•...•... 40
2.3.1 Materials ... 40
2.3.2 Sample blood preparation ... 42
2.4 Stat-ïstical Methods ...•.•.•...•.•.•...•.•.•.•.•.•.•.•....•••.•.•...•.•...•...•.•.•...•...•... 44
CHAPTER 3:CHARACTERIZATION OF THE STAR-SHAPED CA(PEG)4 POLYMERS 45 3.1 Preparation of the Cholie Acid Derivatives and CA(PEGh ... 45
3.2 Charaeterization of the Star-Shaped Polymers •...•..•...•.•.•...•.•... 48
3.2.1 NMR spectroscopy ... 48
3.2.2 Thermal analysis ... 51
3.3 Determination of the Mo/a, Mass Distribution •.•.•.•.•.•.•.•.•...•...•.•.•...•.•.•.•.•... 54
3.3.1 MALDI-TOF ... 54
3.3.2 SEC (size exclusion chromatography) ... 56
3.4 Determination of the Hydrodynamie Radius, Rh ... ~ ... 69
3.5 Rheology Study of the Star-Shaped Polymers •...•.... 73
CHAPTER 4: BLOOD EXPERIMENTS ...•.•..•...•... 78
4.1 E/feet of star-shaped CA (PEGsh on human RBCs ... 78
4.1.1 Viscosity profiles ofRBC samples with CA(PEG)4 ... 78
4.1.2 Myrenne aggregation data of RBC samples with CA(PEG)4 ... 80
4.1.3 Light microscopy ofblood samples with CA(PEG)4 ... 82
4.2 The E/fect of Linear PEGs on Human RBes •.•.•...•.•.•.•.•...•...•... 83
4.2.1 Myrenne aggregation data ofRBC samples with linear PEGs ... 85
4.3 Comparison of CA(PEG)s and Linear PEGs ••.••••••••••••••••••••••••••••••••••••.•••••••••••••••••.••• 86 CHAPTER 5:CONCLUSION ...•...•...•.•.•.•••...•...•....•.•.•.•...•.•.•.•.•.•.•..•..• 91
5.1 Preparation of CA (PEG)4 ••.••••.••••••..•••...••...•.••...••...••..••••••••••••••••••••••.•....•••..••••. 91
REFERENCES ••••••••.••..••..••..••.•.•.••...•..••..••..••.•••.•...••.•.•••...••...•.••.••••••.••••••••..••.•... 93
APPENDIX 1 •••••••..•..••..••..•.••..••..•••..•..•••.••..••..••.•••.••..••••.•...•...••.••..••..••.•••.••••••••••••• 104
APPENDIX 2 •••••••..••••••...•••••.••...•...•..•..••••••..••••••..••..••..••.•••••••••••••.•••..••..•..• 109
LIST OF TABLES
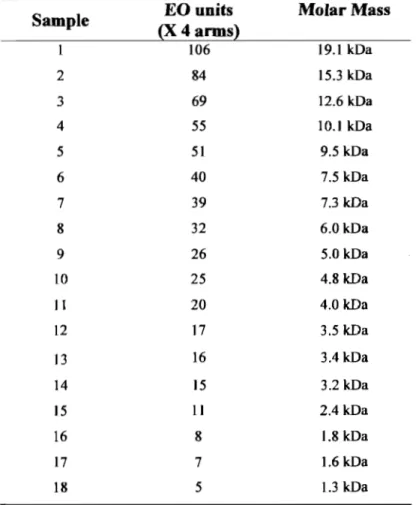
Table 2.1. List of the four armed star-shaped PEG polymer with acholie acid core synthesized by anionic polymerization ... 37 Table 2.2. Linear and star-shaped PEG polymers with acholie acid core (CA(PEG)4)
that were used to evaluate their effect on red blood cell aggregation ... 41 Table 3.1. Molar mass ofCA(PEG)4 polymers obtained by size exclusion
chromatography (SEC) measurements in THF ... 57 Table 3.2. Molecular weights for CA(pEG)4 polymers in water and PBS obtained by
conventional SEC and SEC-MALLS measurements ... 62 Table 3.3. Experimental results and equivalent sphere hydrodynarnic radius for the
LIST OF FIGURES
Figure 1.1. Span hematocrit tube and components ofblood. The RBC volume measured
as the percentage of the total blood which is referred to as the hematocrit (Ht) and is normally around 45%.13 (Adapted from ref. 14) ... 2
Figure 1.2. Tertiary structure ofhemoglobin with the two ~ and a globin chains bound to four heme moieties. Reproduced from ref. 17 ... 4
Figure 1.3. Parabolic velocity profile in laminar flow. The shear rate (dvldx) is the ratio of the velocity difference (dv) of adjacent fluid lamina to the distance between the fluid lamina (dx). The shear stress (FIA) is the force (F) applied per unit area (A). The viscosity (..,) is the shear stress divided by the shear rate ... 5
Figure 1.4. Shear stress-shear rate and viscosity-shear rate relations for 1 Newtonian fluids and non-Newtonian fluids, where 2 represents shear thinning and 3
represents shear thickening rheological behaviours ... 6
Figure 1.5. Different geometric designs that a rotational rheometer can possess: A)
parallel plates, B) cone and plate, and C) concentric cylinders (couette) ... 7
Figure 1.6. Illustration of the deformation and aggregation ofhuman red blood cells. a.
observed from the surface. b. observed in profile and forming rouleaux. c
Rendered spherical by water. d. Rendered crenate by salt solution. Taken from ref. 25 ... 9
Figure 1.7. Illustration of the effect of the shear rate on the apparent viscosity of normal
red blood cells (RBCs) suspended in plasma, in albumin, and in glutaraldehyde (to produce hardened cells). The increased in viscosity of RBCs at low shear rates is due mainly to RBC aggregation and the drop in viscosity at low shear rates is due mainly to RBC deformability. Adapted from ref. 32 ... ~ ... 11
x
Figure 1.8. Schematic drawing of the bridging model in 1 and the depletion model in 2.
Black cylinders correspond to plasma macromolecules whereas red disks are red blood cells. Adapted from ref. 39 ... 13
Figure 1.9. Chemical structure ofPluronics, and ABA block copolymer consisting of
poly(ethylene glycol) (pEG) and poly(propylene glycol) (pPG) ... 18
Figure 1.10. Photos by light microscopy at a magnification of 400 of (a) normal RBCs
in plasma and (b) RBCs coated with Pluronics F98 (13 kDa). Acquired at the Division of Hematology and Oncology, Department oflnternal Medicine of the University of Southern California ... 18
Figure 1.11. Bile aeid metabolism: production ofprimary, secondary and tertiary bile
aeids occurs in the liver (L) and by intestinal bacteria (lB). Adapted from ref.68 .22 Figure 1.12. The chemical structure ofbile aeids ... 24 Figure 1.13. Structure of sorne cholic acid derivatives ... 26
Figure 1.14. Atom transfer radical polymerization initiator from cholic aeid. Hydrolysis
of the tert-butyl groups affords a star-shaped polymer ... 28
Figure 2.1. Setup for the anionic polymerization with the argon, manifold and the
vacuum pump system ... 31 Figure 2.2. Synthesis route for CA(pEG)4 star polymers ... 34
Figure 2.3. Structure of monomethoxy PEG succinimidyl propionate (mPEG-SP A) ... 41
Figure 3.1. Mechanism of nuc1eophilic acyl substitution ... 45
Figure 3.2. Exchange of protons between dormant hydroxyls and active alkoxide
species is fast during the anionic ring opening polymerization (AROP) of ethylene oxide (EO) where the rate of exchange (Rex) is much higher than the rate of
propagation (Rp) or Rex» Rp Reproduced from ref. 105 ... .47
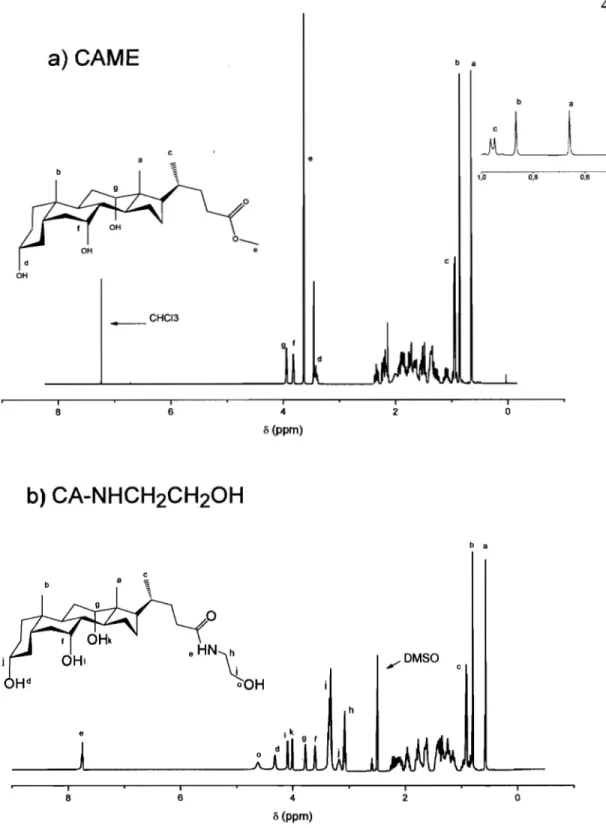
Figure 3.3. IH NMR spectra of a) CAME in CDC13 and b) CA-NHCH2CH20H in
DMSO ... 49
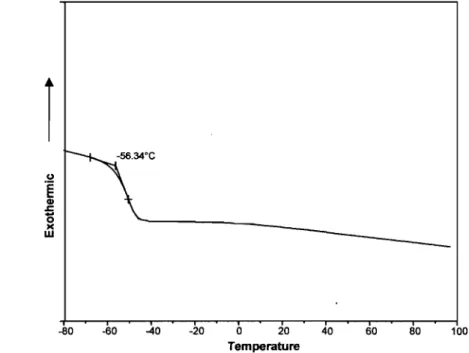
Figure 3.5. DSC trace of CA(PEG)4 of sam pie 18 showing the glass transition
temperature, Tg . ... 52 Figure 3.6. DSC traces of CA(PEG)4 polymers with different molar mass showing
different melting temperatures,Tm ... 53 Figure 3.7. Relationship between the melting temperature (Tm) and the molar mass of
the CA(pEG)4 polymers ... 53 Figure 3.8. MALDI-TOF mass spectrum ofCA(pEG)4 pol ymer ofsample 18 obtained
by using a N2 laser at 337 nm wavelength with a 20 kV extraction voltage. , Dithranol was used as the matrix in a saturated salt solution ofLiCl.. ... 55 Figure 3.9. SEC traces of several molar masses ofCA(PEG)4 polymers in THF. Molar
mass ofsample 1 19.1 kDa, sample 2
=
15.3 kDa, sample 3=
12.6 kDa, sam pie 4 10.1 kDa, sam pie 5 = 9.5 kDa, sample 11=
4.0 kDa, sam pie 15 2.4 kDa, and sample 18=
1.3 kDa. Sample details can be found in Table 3.1. Lined arrows indicate traces of low molar mass samples and dotted arrows indicate the presence of high molar mass ... 56 Figure 3.10. Determination of dn/dc oftline of sample 13 (3.4 kDa) of CA(PEG)4polymer in water. (A) shows the area selected of the differential refractive index data and (D) shows the slope of the resulting RI data. dn/dc oftline = 0.1412 ± 0004 mL/g and dn/dc online gave 0.1417 mL/go ... 60 Figure 3.11. SEC-MALLS chromatogram of star shaped-polymers CA(pEG)4 a) in
water and b) in phosphate buffer saline solution (PBS). Sam pie 1 = 19.1 kDa; sample 2 15.3 kDa; sample 3 = 12.6 kDa; and sample 4
=
10.1 kDa ... 63 Figure 3.12. An overlay of molar mass distribution as a function of the elution volumeat 90° light scattering for the linear PEG and sample 8 of the star-shaped CA(PEG)4. The two verticallines delimit the overlapping region of the elution volume of the two polymers ... 65
Figure 3.13. The molar mass overlap between the linear PEG (0) and star-shaped CA(PEG)4 (0) at each elution volume using the data selected from the region
,
defined by the two verticallines in Figure 3.12 ... 66 Figure 3.14. Branching ratio versus molar mass for sample 8 of the star-shaped
CA(pEG)4 polymer calculated by the mass method using a = 0.712 and e = 1 in Equation 3. 7 ... 67 Figure 3.15. Determination of the number of arms for a star-shaped CA(pEG)4 polymer ofsample 8 (6 130 Da). The number ofarms (f= 4) is determined by tracing a line from 6 130 Da to the y-axis ... 68 Figure 3.16. Determination of the intrinsic viscosity of the star-shaped CA(PEG)4
pol ymer in water at 25 oc for sample 4 with a molar mass of 10.1 kDa ... 70 Figure 3.17. Intrinsic viscosity [17] (0) and hydrodynamic radius (Rh) (0) against the
average-number molar mass (Mn) for a series of solutions of CA(pEG)4 polymers in water at 25 oC ... 73 Figure 3.18. Semi log scale plot of the concentration dependence on the flow curves of
star-shaped CA(pEG)4 pol ymer of sam pIe 1 in water with a molar mass of 19.1 kDa at 25 oC. A significant difference was found for concentrations above 0.1 % for multiple pair-wise comparisons with P < 0.05 using Anova test ... 74 Figure 3.19. Semi log scale plot of the molar mass dependence on the flow curves for
star-shaped CA(pEG)4 polymer in water at 25 oC. A significant difference was found for multiple pair-wise comparisons with P < 0.05 for Anova test.. ... 75 Figure 3.20. Shear thinning behavior of the viscosity profiles of CA(pEG)4 polymers in phosphate buffer saline solution (PBS) at 0.3% (w/v) (A) at 25 oC and (B) at 37 oC. No significance difference was found at 25 and 37 oC for multiple pair wise
comparisons (P > 0.05, Anova) ... 76 Figure 4.1 Viscosity-shear rate data of RBCs suspended in autologous plasma at 25°C
with CA(pEG)4 solution (6.6 mg/mL). AlI flow curves show typical non-Newtonian behavior for an aggregating system, the increase in viscosity with
decreasing shear rate is indicative of RBC aggregation. Data are presented as mean ± standard deviation (S.D.). Data showed no significant difference with P > 0.05.79 Figure 4.2. Apparent viscosity ratio (0.15 s-l /94 s-l) ofRBCs suspended in
autologous plasma at 25°C with a CA(pEG)4 at a pol ymer concentration of 6.67 mg/mL for n = 3 . Data are obtained from Figure 4.1 ... 80 Figure 4.3. Aggregation of RBCs suspended in autologous plasma measured using a
Myrenne Aggregometer. Myrenne Mat stasis (A) and Ml at 3 s-l (B) aggregation values normalized to control (e.g. buffer added without polymer) and presented as indices (± SD) for CA(pEG)4 for each polymer concentration (1.3, 4.0 and 6.7 mg/mL). Values for M and Ml < 1 indicate inhibition ofRBC aggregation.
Measurements were in duplicate for each donor (n = 3) ... 81 Figure 4.4. Photomicrographs ofred blood ceUs (RBCs) in plasma with CA(PEG)4
pol ymer at a concentration of 6.67 mg/mL taken at 400 magnification. These are enlarged microscopie images and are used for the basis of qualitative observations .
... 83 Figure 4.5. Viscosity profiles ofRBCs suspended in autologous plasma at 25°C with
linear PEGs (6.67 mg/mL). AU flow curves show typical non-Newtonian behavior for an aggregating system. Data showed no significance difference with P > 0.05 .
... 84 Figure 4.6. Apparent viscosity ratio (0.15 s-l /94 s-l) ofRBCs suspended in
autologous plasma at 25 oC with linear PEGs (6.67 mg/mL). Data are obtained from Figure 4.5 ... 84 Figure 4.7. Aggregation ofRBCs measured using a Myrenne Aggregometer. Myrenne
Mat stasis (A) and Ml at 3 s-l(B) aggregation values normalized to control (i.e. no polymer added) and presented as Indices (mean ± standard deviation) for linear PEGs at each pol ymer concentration (1.3, 4.0 and 6.7 mg/mL). Values for M and Ml < 1 indicate inhibition ofRBC aggregation and values> 1 indicate promotion ofRBC aggregation. Measurements were in duplicate for each donor (n = 3) ... 85
Figure 4.8. Mean viscosity at a high shear (94 s-l) and a low shear (0.15 s-l) ofRBC samples suspended at 40% hematocrit in plasma at 25°C at a polymer
concentration of 6.67 mg/mL for linear PEGs (.) and CA(pEG)4 (.). Data are presented as mean ± standard deviation for n 3 ... 87
Figure 4.9. Viscosity profile ofRBCs suspended in plasma at 37 oC over a range of
shear rates (0.01 - 94.5s -1). Measurements were in duplicate for each donor (n =
2) ... 89
Figure 4.10. Photomicrograph images ofRBCs in plasma at 40X magnification. Normal
rouleaux formation was observed in control and CA(pEG)4 samples. Minimal rouleaux formation was observed for mPEG20k-coated RBCs ... 89
xv
LIST OF SYMBOLS AND ABBREVIATIONS
AROP anionic ring-opening polymerization
ATRP Atom transfer radical polymerization
AOROP anionic ring-opening polymerization
CA Cholic acid
CAME Cholic acid methyl ester
CA(pEG)4 Cholic acid PEG star-shaped polymers
dnldc Differentiai refractive index increment
DMSO Dimethyl sulfoxide
DP Degree of polymerization EG Ethylene glycol EO Ethylene oxide gM Branching ratio Hb Hemoglobin Ht Hematocrit IgE Immunoglobulin E MW Molecular weight
PBS Phosphate buffer saline
PDI polydispersity index
PEG Poly(ethylyene glycol)
PEO Poly( ethylene oxide)
PVP Polyvinylpyrrolidone
PPG Polypropylene glycol
Rex Rate of exchange
Rh Hydrodynamic radius
Rp Rate of propagation
RBC Red blood cell
sn
Standard deviationsen
Sickle cell diseaseTHF Tetrahydrofuran
YI Viscosity
[YI] Intrinsic viscosity
y Shear rate
ACKNOWLEDGEMENTS
1 would like to thank my research director Julian Zhu for allowing me to join his group and providing the opportunity to pursue a Master's degree. Also, 1 appreciated his patience and his persistence. 1 also would like to thank my co-director Guy Cloutier. 1 am grateful to him for his guidance and the financial support he provided through out my research. Jonathan Armstrong also deserves credit, as he helped out with most of the blood experiments. Without him, this thesis would not have been possible. 1 would like to thank all the people from the laboratory of Dr. Zhu and that of Dr Cloutier (too many to name). It was a pleasure getting to know all of you. 1 have leamed a lot from you and gained knowledge by working side by side and participating in group meetings. AU of you contributed to my development as a chemist.
My family has always offered support to all my decisions, and as such, deserve thanks as weIl. 1 thank my mother for never allowing me to quit anything 1 started and for her motivational speeches and encouragements. 1 give thanks also to my sister for supporting me and the reminders "always stay positive."
Finally, and most importantly, 1 would like to thank God to whom all of this would not be possible without Him. "If 1 have the gifi of prophecy, and know all mysteries and all knowledge; and if 1 have all faith, so as to remove mountains, but do not have love, 1 am nothing." 1 Cor 13:2
"The more you study, the more youfind out you don't know, but the more you study, the doser you come. " By Cozy Cole
CHAPTER 1: INTRODUCTION
Organ and tissue perfusion strongly depends on adequate blood flow. Subtle disturbances can lead to clinical disorders. The hyper viscosity syndrome (i.e., high blood viscosity) is a condition associated with hyper red blood cell (RBC) aggregation, which can slow down the blood flow or even stop it. This form of disorder can cause ischemia and thrombosis. Moreover, increased RBC aggregation has been observed and is implicated in the pathophysiology of numerous diseases with circulatory disorders, such as cardiovascular diseases, chronic and acute inflammatory diseases, diabetes, cancers, sickle cell disease, thalassemia and trauma.] ,2,3 In fact, several studies have pointed to
RBC aggregability as being a strong cardiovascular risk factor.4,5 Appendix 1 describes
the relation between RBC aggregation and sorne of the se pathologies.
Blood viscosity can be reduced or increased when macromolecules are added to the suspending medium. This can cause either inhibition or promotion of RBC aggregation. Non-ionic macromolecules with small hydrodynamic radius, Rh
«
4 nm) and low molar mass « 20 kDa) are known to reduce blood viscosity when added to RBC suspension in plasma in vitro.6 Linear Poly(ethylene glycol) (pEG) has shown to be beneficial in reducing RBC aggregation and blood viscosity.7 Also, an amphiphilic block copolymer of PEG composed of a central hydrophobic moiety core of poly(propylethylene glycol) (pPG) to form the compound with the general formula PEG-PPG-PEG has been used successfully to reduce red blood cell aggregation and blood viscosity.8 Though it has shown promising results for the treatment of several hyper blood viscosity disorders (sickle cell disease and myocardial infarction), severe allergic reactions occurred in 30% of patients receiving intravenous infusion of PluronicS.9-11 Thisallergic reaction is thought to come from the PPG.
Similar inhibition of red blood cell aggregation and reduction of blood viscosity may be achieved in an amphiphilic star-shaped PEG. The star conformation provides an even smaller hydrodynamic radius and lower viscosity when compared to linear PEGs which should make it even more efficient in reducing RBC aggregation. Indeed, as it will
2 be discussed later, a more compacted structure of polymer (smaller hydrodynamic radius) tends to inhibit RBC aggregation. The high density along with the dense core of PEG stars prevent non-specific interactions with biological systems which could lead to immune responses.12 Also, cholic acid, a natural occurring compound produced in the human liver, has surfactant properties. The cholic acid may be used as an initiating core to polymerize star shaped PEG and to confer more biocompatibility to the polymer. Preparation of su ch amphiphilic star-shaped PEG polymers has the potential to be used as an intravenous injection for the treatment of hyper RBC aggregation. Thus, before we describe the rational behind this work, a general background on blood, RBC aggregation, and bile acids will be provided.
1.1
Blood Components
Plasma (55%) -White blood cells
and platelets « 1 %) ---,-"""'"
Red blood cells (45%)
a
-xl00=Ht% b
b
Figure 1.1. Span hematocrit tube and components of blood. The RBC volume measured as the percentage of the total blood which is referred to as the hematocrit (Ht) and is normally around 45%.13 (Adapted from ref. 14)
Blood is a complex heterogeneous system composed of different types of cells and molecules that appears as a homogenous fluid. When blood is centrifuged and left standing in an anticoagulant tube there are three major parts that can be observed (Figure 1.1). The upper layer is filled with a clear liquid that is called plasma. This fluid part of blood contains no cells but does contain many proteins including fibrinogen, a key protein involved in the clotting process and various substances (ions, sugars, lipids, hormones, vitamins, and dissolved gases). Below the plasma lays the buffy coat, which contains leukocytes (white blood cells) , and platelets, a subcellular prote in that participates in clotting. At the bottom of the tube are the red blood cells (RB Cs ) or erythrocytes. RBCs are responsible of the transportation of oxygen and carbon dioxide between the lungs and other tissues. The RBC volume measured as a percentage of the total blood volume is called the blood hematocrit (Ht). Normally it is around 45%. 13
The RBC is a highly specialized cell who se principal role is to transport oxygen from the lungs to the tissues and also carbon dioxide (C02) back to the lungs. This
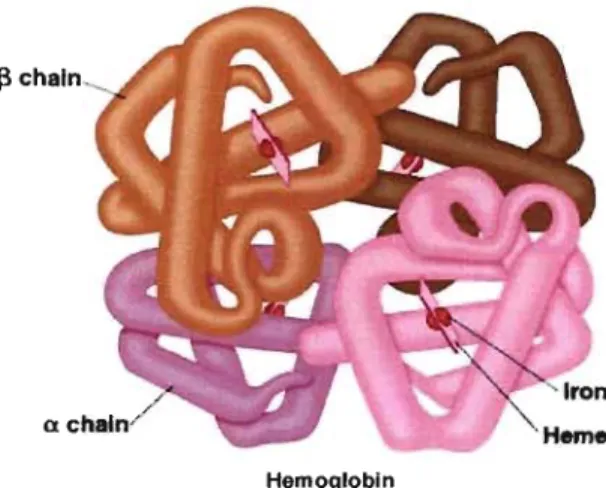
function is facilitated by its biconcave shape with a typical diameter of 7-8 Ilm, a thickness of 2 Ilm in periphery that is less than 1 Jlm in the center.4 This disk shape optimizes the oxygen exchange surface with the surrounding cells. Its membrane and cytoskeleton are able to undergo marked deformation to pass through the capillaries that have 2-3 Jlm diameters. This deformation is mainly possible due to the membrane protein (band 3 and glycophorin) and proteins in the cytoplasma.15 The mature human RBC looses its nucleus during the marturation process to provide more space for the transportation ofhemoglobin and to facilitate the surface gas exchange. Hemoglobin (Hb) is an important constituent in RBC and is the molecule that complexes and transports oxygen in the human body. Hb is a heterodimeric tetramer composed of two a-like-globin chains and two non-a-a-like-globin chains (P, y, or 8), conjugated to four heme groups
(Figure 1.2). A typical erythrocyte can carry 270 millions hemoglobin molecules with each carrying four heme groups whose iron atoms temporary link to oxygen atoms.16
Hemoglobin
Figure 1.2. Tertiary structure of hernoglobin with the two
p
and a globin chains bound to four herne rnoieties. Reproduced frorn ref. 17.1.2
Hemorheology
The terms blood rheology and hernorheology can be used interchangeably and they are concemed with the study of flow and deformation behaviour of blood and its constituents (i. e., RBCs, white blood cells, platelets ).15 Henceforth, crucial for the understanding of the rheology of blood is a basic understanding of sorne general principles of rheology.
1.2.1 General principles of rheology
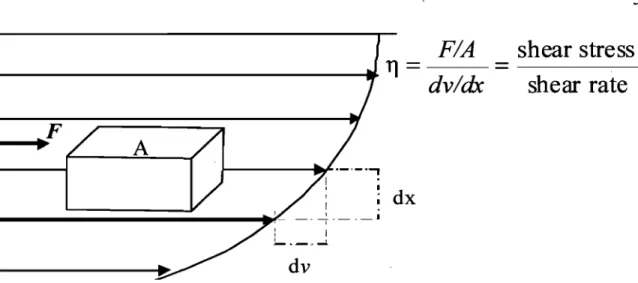
Rheology is defined as the study of flow and deformation of a rnaterial normally exerted by an extemal force.18 Solids deformed when a force is applied. If the deformation is proportional to the applied force and not too large, and if the original shape is retumed; the solid is said to be elastic. On the other hand, if the deformation rernains permanent after the force is rernoved, the solid is said to be plastic. Fluids continuously deform or flow because of the applied forces. Most rnaterials, including blood, exhibit the cornbined behaviour of both liquid and elasticity of a solid, also known as viscoelasticity.18
FIA
- - - -... 11
=
dvldx
A
dx
______
~~~~=====!~____
~r- _ _ ~ _ _ _ _ j : 1 J..._~....I.dv
shear stress
shear rate
Figure 1.3. Parabolic velo city profile in laminar flow. The shear rate (dvldx) is the ratio of the velocity difference (dv) of adjacent fluid lamina to the distance between the fluid lamina (dx). The shear stress (FIA) is the force (F) applied per unit area (A). The viscosity (Tl) is the shear stress divided by the shear rate.
The degree of deformation (or flow) of a material is re1ated to the force applied per unit area. This deforming force is termed stress and comprises two main components:
(1) normal stress, the force per unit area acting perpendicular to the surface, and (2) shear stress, the force per unit area acting para1le1 to the surface.18 Figure 1.3 shows the visualization of the shear stress as the movement of hypotheticallayers sliding over each other. The gradient of the ve10city in the direction at right angles to the flow is called the shear rate (also called the ve10city gradient or strain rate).
Under laminar flow conditions, (see Appendix 1), the shear rate-shear stress
\
re1ationship is used to describe the internal resistance between laminas or fluid layers which is termed, the viscosity.18 The viscosity can thus be obtained by the ratio of the shear stress to the shear rate (Figure 1.3). For rheological purposes, fluids can be divided in two main categories: Newtonian fluids and non-Newtonian fluids. In non-Newtonian fluids, the viscosity does not remain constant as a function of the shear rate; therefore, the
6 term apparent viscosity is preferably used to describe the viscosity at given conditions.
In Figure 1.4, curve 1 illustrates a Newtonian fluid where the viscosity does not changes as a function of the shear rate; curve 2 shows a non-Newtonian fluid with a decrease in viscosity, which is known as shear thinning; and curve 3 shows a non-Newtonian fluid with an increase in viscosity, which is called shear thickening.
3 en 1
S
3 ::r (1) <Il 1» n...
<Il 0 <Il 1 ~ ~. (1) <Il ~ <Il 2 Q 2Shear rate Shear rate
Figure 1.4. Shear stress-shear rate and viscosity-shear rate relations for 1
Newtonian fluids and non-Newtonian fluids, where 2 represents shear thinning and 3 represents shear thickening rheological behaviours.
The viscosity can be affected by several parameters such as pressure, temperature, time, shear rate, and the molecular nature of the compound.19 The viscosity normally decreases with increasing temperature. The viscosity of all simple liquids decreases with increase in temperature because of the increasing Brownian motion of their constituent molecules, and generally the higher the viscosity, the greater is the rate of decrease.18 The measured viscosity can either increase or decrease with time elapsed. A graduaI decrease of the viscosity while subjected to constant shearing followed by graduaI recovery of the structure when the stres~ is removed is termed thixotropy. The opposite type ofbehaviour,
gradual increase in viscosity while subjected to constant shearing, without recovery of the structure is called rheopexy.
The rheological properties of dilute polymer solutions are mainly a function of the concentration, temperature, molar mass, and structure of the long chain molecule.18
Generally, for dilute polymer solutions its viscosity is much higher than that of the pure solvent. This arises because of the large differences in the size between the polymer and solvent molecules, and the magnitude of the viscosity increase is related to the dimension of the pol ymer molecules in solution. Therefore, viscosity measurements of dilute polymer solutions can be used to pro vide information concerning the effects upon chain dimensions of polymer structure, molecular shape, molar mass, and polymer-solvent interactions .19
Figure 1.5. Different geometric designs that a rotational rheometer can possess: A)
parallel plates, B) cone and plate, and C) concentric cylinders (couette).
Several methods exist to characterize the viscosity of a solution. It can be measured by a viscometer, which studies the stress-strain relations. Capillary viscometers are mostly used to study Newtonian fluids whereas viscometers and rheometers are used for non-Newtonian fluids. While viscometers are limited to the measurements of viscous flow, rheometers are concerned with the viscoelasticity properties of semi-solids. Additionally, rheometers are instruments that produce deformation under controlled conditions representative of those found in real conditions (temperature and deformation rate) and measure the consequences. The consequences are usually conveyed in terms of stress and viscosity from which a host of rheological parameters can be further computed. Rotational rheometers utilized different geometric design to produce a simple continuo us shearing motion between two surfaces, one or both of which are rotating while measuring the properties offluids (Figure 1.5).
8
1.2.2 Blood viscosity
Whole blood viscosity (RBCs, plasma, white cells, and platelets) is considered as a non-Newtonian suspension since its viscosity varies with the shear rate.15 Blood can be viewed as a two-phase liquid, or it can also be considered as a solid-liquid suspension with the cellular components being the solid part. However, under shear, RBCs behave liquid-like and blood is considered as a liquid-liquid emulsion.15 The amount of platelets and white cells is so small compared to red cells that they play a minor role in the whole blood viscosity. However, white cells may sometimes have sorne influence as they specifically adhere to the vascular endothelium in certain inflammatory diseases such as hyperleukocytic leukaemias?O The viscosity of blood depends on plasma viscosity, hematocrit value, and RBC rheological properties (deformability and aggregation). These parameters vary considerably in several human pathological disorders. Altered blood rheology may have severe clinical consequences.4
Plasma viscosity
Since plasma is the suspending medium of the cellular constituents of blood, any change of its viscosity directly affects the whole blood viscosity regardless of the hematocrit or cellular concentration. 15 The presence of protein fractions, notably
fibrinogen, is the major cause of blood viscosity increase, which happens in disease states or after tissue injury. Plasma is considered to exibit Newtonian behaviour and its viscosity (1.10-1.35 cP) is constant at the body temperature. However, sorne have reported non-Newtonian behavior especially in diseased states.21
Hematocrit value
Under laminar flow, the presence of cellular constituents disturbing the flow streamlines is the main reason why whole blood viscosity (RBCs, plasma, white cells, and plate1ets) is higher than plasma viscosity alone. The degree of disturbance of flow streamlines, and consequently the viscosity of blood, strongly depends on the concentration of the cellular constituents or the hematocrit.15 In general, blood viscosity
increase as the hematocrit increases and usually follows an exponential relationship, where at higher values of hematocrit; blood viscosity becomes extremely sensitive to hematocrit variations.22
Red blood cell deformability and aggregation
In addition to the concentration of the cellular constituents which disturbs the flow streamlines, the deformability of the RBCs under shear force is an important factor to consider. Normal RBCs are deformable bodies which align themselves in the direction of the flow. RBCs deformability and their orientation with respect to the flow streamlines are primary cellular factors affecting blood viscosity at high shear rates. 15 RBC
deformability depends on the membrane and its underlying cytoskeleton: (1) the biconcave discoid shape, and (2) the hemoglobin concentration, both which determine its cytoplasmic viscosity.23 The RBC deformability affects the entrance of blood cells into the capillaries. This is especially a concem for RBCs with reduced deformability in pathological disorders such as sickle cell disease, which may sequester the capillary entrance. The stiffening of the cell membrane or the high concentration of Hb, which increases the blood viscosity may impede RBC passage through the capillaries
?4
c
Figure 1.6. Illustration of the deformation and aggregation of human red blood cells. a. observed from the surface. b. observed in profile and forming rouleaux. c Rendered spherical by water. d. Rendered crenate by salt solution. Taken frOID ref. 25.
10 Another important rheological properties of RBCs is their ability to aggregate themselves in stacks and form a reversible mass known as rouleaux, which is a primary factor affecting blood viscosity at low shear rates. (Figure 1.6b).21,26
Typically, arteries and capillaries have high shear rate conditions, whereas blood in venules is subjected to lower shear rates. RBCs tend to aggregate and form rouleaux in environments of low shear rate < 10 S-l (i.e. venules), which increase blood viscosity.6 The decrease in shear rate causes the shear stress to increase. Thus a higher pressure gradient is required to move the blood at low flow rates. It is worthwhile to know that a certain yield stress is necessary to get the RBCs to re-flow or dissagregate.27 The shear stress required to separate two cells in this orientation for a saline suspension of RBCs in 4% dextran was determined by Chien and coworkers to be less than 1 dyn/cm2
• 28 Upon
flow rate increase, the shear force becomes strong enough to disrupt rouleaux. High shear rates above 100 S-l typically cause disaggregation of rouleaux and cell deformation, which in tums improve blood flow.29 At high shear rates, the viscosity of blood is constant (4-5 cP) and behaves like a Newtonian fluid because the level of aggregation is reduced or inexistent.15 In clinical settings, RBC aggregation is mainly due to the increased concentration of high molecular weight plasma proteins as fibrinogen and immunoglobulins G and M (IgG and IgM).6,30 Other plasma proteins such as haptoglobin, ceruloplasmin and C reactive protein were shown to also promote aggregation?l
1.2.3 Blood viscosity in rotational viscometers
Blood viscosity is usually measured in a rotational viscometer, which allows the measurement of blood viscosity ovei" a wide range of shear rates. Rheology measurements are important in hemorheology since it predicts the behavior of blood flow in the vessels. In a static system at constant temperature, the apparent blood viscosity ('la) is a function of the hematocrit (Ht) and applied shear rate
(n.
Experimental apparatus have been designed to study the rheology of RBCs. They usually require blood to be sheared between two concentric cylinders (also known as Couette flow) or between a cone and plate, to create a constant shear across the blood layer (Figure I.S). It is assumed that the RBCs or aggregates are unifonnly distributed within the fluid layers when the viscosity measurements are obtained.
100
~ O-.t u'-1
è
.-
CIlo
u CIl>
.
.
.
... ... Hardened RBCs in plasma Normal RBCs ... RBCs in buffer ...... .... ...o-+---~---~---~---0
.
01
110
Shear rate
(S-I)
100
Figure 1.7. Illustration of the effect of the shear rate on the apparent viscosity of normal red blood cells (RBCs) suspended in plasma, in albumin, and in glutaraldehyde (to produce hardened cells). The increased in viscosity of RBCs at low shear rates is due mainly to RBC aggregation and the drop in viscosity at low shear rates is due mainly to RBC deformability. Adapted from ref. 32.
Chien studied the behaviour of RBCs in rotational viscometers and showed that the increase of viscosity at low shear rate was primarily due to RBC aggregation.33 Figure 1.7 is iIIustrative of that experiment. Chien incubated the RBCs in three media: saline buffer (non-aggregating medium), plasma (aggregating medium), and
12 glutaraldehyde (cell hardening medium). In glutaraldehyde, the RBCs hardened and the viscosity was high and constant and remained independent of the shear rate. In saline buffer, the viscosity of the RBCs remained almost independent of the shear rate and was lower than the viscosity of RBCs incubated in glutraldehyde and plasma. This showed that the drop of viscosity at high shear rates was due to the deformability of RBCs. However, at low shear rate, the viscosity of the RBCs incubated in plasma increased exponentially due to the aggregation of RBCs. The increase in the apparent viscosity of RBCs suspended in plasma was due in part to the increase in the effective particle size and greater trapping of plasma. As the shear rate decreased, the lower shear force acting on RBCs allowed the formation of aggregates, which increased the effective viscosity. At very low shear rates, the orientation of the cells relative to the flow was random but as the shear rate increased, the deformability or flexibility of red cells allowed them to orient themselves in a manner that presented minimal cross-section to the flow streamlines, and effectively reducing the apparent particle size.
1.2.4 Mechanism of red blood cell aggregation
There are two co-existing theoretical models to explain the process of RBC aggregation: bridging and depletion (Figure 1.8). Merrill et al. originally proposed the "Bridging Model" over thirty years ago for the plasma proteins (e.g., fibrinogen) inducing RBC aggregation.34 Later Chien and Jan, and Brooks27,35,36 reported that, dextran
adsorption within neighboring RBCs also induces aggregation.
In the bridging model, RBC aggregation is considered as a reversible process, which depends on the equilibrium process between several parameters: the macromolecular bridging force due the adsorption of macromolecules onto the adjacent cell surfaces (Fb) and the disaggregating forces due to electrostatic repulsion (Fe),
mechanical shearing (Fs) and membrane strain (Fm). The net aggregating force (Fa) can be expressed as:34
The bridging model postulates that RBC aggregation occurs when the bridging forces (Fb) exceeds the disaggregating forces (Fe, Fm, and Fs.). For instance, when RBCs come into close proximity, aggregates may form due to the absorption of long chains of macromolecules such as fibrinogen or dextran (a neutral polymer) with high molar mass leading to a bridging effect between cells being greater than the disaggregation forces
(Figure 1.8). 37,38
1- Bridging Model
~JJ
--
'
~
---~
,
RBC at h ig h ftow rate Macromolecules
Bridging
Rouleaux formation
Aggregation 0CCllI8 when the attractive forces resulting from the adsorption
of macromolecules onro the surface ~œeds the disagg:regating forces
2- Depletion Model
Depletion interaction
Depletion of macromolecules &om the interface leads ta formation of t'ou.le.aux
Figure 1.8. Schematic drawing of the bridging model in 1 and the depletion model in 2. Black cylinders correspond to plasma macromolecules whereas red disks are red blood cells. Adapted from ref 39.
The "depletion model" originated from Asakura and Oosawa and was applied later to RBC aggregation.40 This model hypothesizes that the reduced concentration or the exclusion of pro teins or macromolecules (e.g. dextran > 40 kDa) is near the cell surface of RBCs compared to suspending medium or bulk solution. This exclusion of macromolecules near the cell surface leads to osmotic gradient and thus depletion layer interaction and the tendency for adjacent red blood cells to come together (Figure
14 of macromolecules but rather results from an overlap of the depletion zones, which in tum causes attraction of the cens due to the osmotic pressure.
The attraction for~ between the cells relies on the polymer concentration between the depletion area and the bulk solution, the thickness and density of the layer, the separation distance between RBCs, and the spatial properties of the macromolecules. For instance, when the separation distance x is much greater than the thickness of the depletion layer
q,
the force of attraction between two cells is considered negligible. The depletion layerq
depends on the macromolecule concentration in the bulk solution and its molar mass. If the separation distancex
is much more smaller thanq,
the forcef
of attraction between two cells can be described by:34(1.3)
where Ris the radius of the red cell, k is the Boltzman's constant, and Tthe temperature gradient.
The role of macromolecules in b100d is not a factor only affecting blood viscosity but in addition they regulate many cell interactions in normal and pathological conditions. For instance, in thrombosis formation, plasma proteins participate in platelet aggregation. However, in RBC aggregation, the presence of large macromolecules or plasma proteins is necessary for RBC aggregation because RBCs suspended in saline solution alone do not aggregate (see Figure 1.7)
Both the bridging and the depletion models can explain RBC aggregation in their own rights and one is not necessarily better than the other. However, there is an obvious contradiction between both mechanisms. The bridging model predicts an increase in aggregation due to the increase in concentration of the macromolecules near the RBC surface, whereas the depletion model predicts the opposite.41 Both models suggest that the total adherent force between two cens is maximal when the cens are arranged "en face" or in rouleaux. The mechanism of RBC aggregation and disaggregation and thus the role of macromolecules in RBC-RBC interaction are far from being understood, especially in human disease states.
1.3 Disorders Related to Abnormal RBC Aggregation
Microcirculatory disorders contribute a large fraction to the morbidity and mortality of patients and constitute a major health cost to society.42. The microcirculation represents the smallest vesse1s in the circulatory system and encompasses the capillary network with the smallest inner diameters of 4-8 !-lm, the arterioles with diameters up to 100 !-lm, and the venules somewhat larger.42 Typically, the arterioles have a magnitude of ten times the shear rate of capillaries and venules have the lowest shear rate.42 The blood flow in the microcirculation aims to maintain vital functions such as gas and metabolite exchanges between capillary vessels and perfused tissues. Impaired micro circulation arises as a result of diseases affecting the vascular system by inflammation, which promotes not only leukocyte adhesions but RBC hyper-aggregation degeneration.42 Elevated RBC aggregation is observed when high prote in fractions (e.g., fIbrinogen) are produced as a result of chronic infections, tissue damage, degenerative diseases, and cancers to name a few examples. Impaired microcirculation may have functional and structural impacts on the corresponding tissues or organs and these adverse effects may create acute and chronic symptoms such as such as ischemia and tissue infarction.42 In addition, the migration of RBC aggregates to the center of blood vesse1s where the shear rate is minimum might attenuate oxygen diffusion through the cell-free layer that is observed close to the vessel wall.32 A systematic consequence ofRBC hyper-aggregation that may be observed in conditions such as hypertension is the decrease of the blood flow and reduction of the cardiac output (the amount of blood being pumped out by the heart over a particular period of time) in severe cases.
1.4 Blood Rheology Modifiers: Macromolecules
As mentioned earlier, red blood cells in the presence of high molar mass macromolecules such as plasma proteins or polymers tend to aggregate and form
rouleaux. The rheological effect of macromolecules on blood rheology have been
extensively studied and reviewed. It is general knowledge that macromolecules modify the plasma viscosity as well as the red blood cell aggregation.6,36 Non-ionic
macromolecules with small radii or molar masses are known to reduce the in vitro blood viscosity when added to RBCs suspended in plasma.6 Non-ionic macromolecules known to promote RBC aggregation in vivo or in vitro include dextrans with molar masses ~ 70 kDa, poly( ethylene glycol) (pEG), and polyvinylpyrrolidone (PVP).
The effect of the hydrodynamic radius of macromolecules on RBC aggregation was investigated by Armstrong et a16. The three non-ionic polymers that were studied
were dextran, PEG, and PVP ranging from a molar mass of 1.5 kDa to 200 kDa. The hydrodynamic radius for each polymer was calculated from their intrinsic viscosities. The study showed that the different polymers demonstrated similar effects on RBC aggregation when compared on the basis of their hydrodynamic radius. Notably, aH three polymers with hydrodynamic radius < 4 nm inhibited RBC aggregation whereas those with a hydrodynamic radius > 4 nm promoted RBC aggregation. Also, the maximum optimal inhibitory effect was observed for polymers with hydrodynamic radius between 2 and 3 nm. The study also showed that this trend could be applied to common plasma proteins such as fibrinogen and albumin.
1.4.1 Dextran
Dextran has been Widely used for the induction of RBC aggregation and in the study of RBC aggregation mechanism. Dextran was one of the fust and principal plasma substitutes.35,43 Dextran of MW 70 kDa with gelatin or PVP, increases the apparent blood viscosity with the exception of Dextran of MW 40 kDa which decreases blood viscosity.44 Dextrans have been shown to absorb on the membrane surface of RBCs using several techniques such as radioactive labels.28,35 It has also been used to support the "Bridging Model" based on the molecular weight threshold and the rate of the absorption isotherms.39,45 Low molecular weight dextran is utilized in clinical practice to reduce the hematocrit level by hemodilution to enhance tissue perfusion and oxygenation.46 In 1963, low molecular weight dextran was found to prevent thrombosis (clotting of the blood).43 However, the danger of dextran has been raised conceming renal failure and the increased plasma viscosity.47
1.4.2 Poly( ethylene glycol) (PEG)
and
Pluronics
Because of their advantageous properties, PEGs have been used in a wide range of biomedical applications.48-50 PEG is a water-soluble polymer that is non-toxic, has a good clearance from the body, and is able to escape the immune system recognition.51 PEG may also transfer its immune properties when it is attached to another molecule.48 ThllS, a toxic molecule can become non-toxic when combined with PEG. Also, an hydrophobic moiety of a molecule can become water-soluble when coupled to PEG without loosing the biological properties of the drug.52 PEGs bound to lymphocyte T cells (cell-cell interaction molecules) was found to reduce antigenic recognition by preventing the adhesion ofmolecules that are involved in immune recognition and response system.53 In whole blood, linear PEGs with low molar mass
«
20 kDa) have shown to reduce RBC aggregation.6 Enhance inhibiting of RBC aggregation has been reported when the terminal hydroxyl group of PEGs is modified to achieve covalent attachment with the RBC's membrane. 39,54Another class of polymers showing reduction of RBC aggregation is a copolymer of PEGs also known as Poloxamers or Pluronics (trademark names). Pluronics have two hydrophilic chains of PEG linked by a hydrophobic block poly(propylene glycol) (pPG) to form a PEG-PPG-PEG structure (Figure 1.9). In 1966, the use of the surfactant Poloxamer 188 (Pluronic F-68) of a molar mass of 8.4 kDa was originally suggested by Miyauchi et al. as a blood rheology modifier and was later found to reduce blood viscosity.55,56 The infusion of Pluronics F-68 (80% PEG) trademarked as RheothRx® intravenously was shown to reduce blood viscosity, which in turn improved blood flow to ischemic tissues, reduced thrombosis, and hence provided a potential treatment for inherited blood diseases (e.g. ischemic vascular disease and vasoocclusive crisis in sickle cell disease).57,58Alematively, Pluronics F-98 with a high molar mass of 13 kDa induces aggregation (Figure 1.10).59
18
PEG
PPG
PEG
Figure 1.9. Chemical structure ofPluronics, and ABA block copolymer consisting of poly(ethylene glycol) (PEG) and poly(propylene glycol) (PPG) .
(a)
Figure 1.10. Photos by light
mi~~~scopy
at a magnification of 400 of (a) normal RBCs in plasma and (b) RBCs coated with Pluronics F98 (13 kDa). Acquired at the Division of Hematology and Oncology, Department of Internai Medicine of the University of Southern California.The covalent attachment of an appropriate Pluronics to RBC surface has shown to be able to predict and control RBC aggregation due to the critical micellization temperature (CMT).59,6o Pluronics have been widely tested in several clinical researches and have shown great benefits in intravenous infusion. The polymer has shown to be beneficial in the treatment of sickle cell disease and myocardial infarction where it accelerates thrombolysis fonnation, thus reducing occlusion and ameliorating re-perfusion injury.61,62 It can also reduce RBC aggregation in blood and decrease whole blood viscosity in human.63.
Adverse non-immunoglobulin E (IgE) (class of antibodies that participates in allergic response) mediated hypersensitivity reactions occurred is sorne individuals following intravenous injection of Pluronics F-68-based pharmaceutical, most likely by complement activation.64 In a clinical study, Pluronic F-68 was combined with a perflurochemical (Fluosol-DA) for radiation treatment of tumors. Up to 30% of patients receiving Fluosol-DA developed hypotension and/or acute respiratory distress.9 These events were thought to be secondary complement activation by Poloxamer micelles. Recently, these adverse reactions have been classified as "complement activation-related pseudoallergy" and occurred after the infusion of contrast media, various drug stabilizers, and drug carriers, and presumably is a reflection of an individual's immune cell sensitivity to complement derived mediators.9,11 More recent studies by Moghimi et al
provided evidence that Pluronic F-68 complement activation is an intrinsic property of the polymer and that it is independent of the polydispersity of the polymer or amount of contaminants, such as organic solvents (acetaldehyde and propionaldehyde) left during the preparations. 1 1 The complement activation was triggered at submicellar concentrations of the pol ymer and was partially due to the presence of allylic double bonds therein.
According to this reVlew, the development of novel approaches to prevent Pluronic-mediated complement activation is obviously a necessity. New strategies may involve either biochemical modifications such as attaching an anti-body or the design of new therapeutic PEG-based polymer. Since biochemical modifications involves a thorough understanding of the specific antigen involved in Pluronic complement
activation which is not fully understood yet, we chose to explore the design of a novel PEG-based polymer. The design of the novel PEG pol ymer should have similar surfactant properties as Pluronic and should confer more biocompatibility or be less prone to allergenic reactions than Pluronic by being naturally derived. AIso, since the size of the polymer affects the RBC aggregation, a more compact structure should be better in inhibiting
RBC
aggregation.6 We chose the design of a novel amphiphilic star-shaped PEG pol ymer based on cholic acid, which is a natural occurring bile acid produced in the human liver.L5
Bile Acids and their Derivatives
Bile acids and their derivatives are currently used for biomedical and supramolecular applications.65-67 A series ofthese polymers have been prepared for drug delivery systems,68 molecular recognition,69 dental fillings, and bone repairing materials.70 In particular, polymeric biomaterials with the design of an amphiphilic polymers with bile acid groups in the main chain or side chain, or as pendant groups or end groups 71-73 , have attracted significant interest because of their biodegradation expected to lead to the release of endogenous compounds. In fact, the in vitro exposure of
3T3 fibroblasts, a cell line used to study the cytotoxicity of dental monomers to methacrylic derivatives of bile acids used as monomers in dental composites, have shown to be less cytotoxic than the commercial dentals.74 Such results have incited efforts to improve the physical and toxicological properties of polymeric biomaterials by incorporation of bile acids into the structure ofthese materials.75 The beneficial results of bile acids originate from its chemical nature, which is described in the next section.
1.5.1 Nature of bile acids
Bile acids are amphiphilic molecules existing in the bile of most living beings. They are synthesized from the oxidation of cholesterol in the liver via many enzymatic steps. About half of the cholesterol produced in the body is used to synthesize bile acids. The bile acids from humans and higher vertebrae are usually conjugated with glycine
(H2N-CH2-COOH) or taurine (H2N-CH2-CH2-S03H) and are stored in the gallbladder.76 After a meal, bile acids are released in the salt form to the small intestine to promote the resorption of fats and lipids.66 In total about 20-30 mg of bile acids are secreted in the small intestine.77 Then, they are either excreted or reabsorbed through the ileum naphthal in the enterohepatic circulation to be reused again. Their function is vital in the emulsification offats, and membrane transports of vitamins.
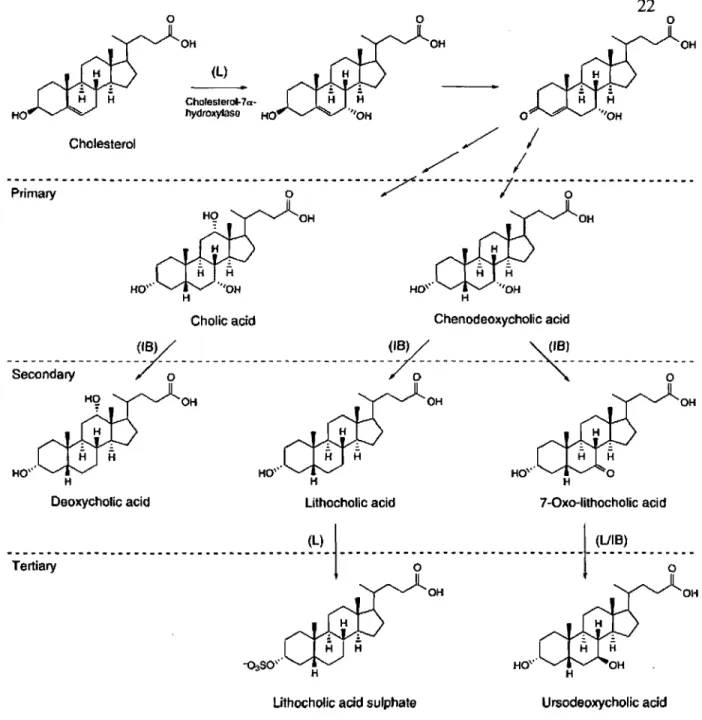
Bile acids made in the liver from cholesterol are referred as "primary bile acids" and those produced by the action of intestinal bacteria during the enterohepatic pathway of bile acids are called "secondary bile acids". Secondary bile acids may be subject to further structural transformation by liver enzymes and thus ar.e referred to as "tertiary bile acids". Cholic acid and chenodeoxycholic acid are primary bile acids; lithocholic acid and ursodeoxycholic acid are secondary and tertiary bile acids, respectively (Figure 1.11).
The human bile acid pool has about 2.5-5 g of bile acids, compromising mainly -90% of cholic acid, chenodeoxycholic acid and deoxycholic acid in a ratio of about 2:2:1 and ursodeoxycholic acid and lithocholic acid are found in the remaining 10% of the poo1.68
Cholic acid (CA) is one of the most abundant bile acids in our body and is relatively easy to obtain. It is also considered useful in the synthe sis of new prodrugs for liver-specific drug targeting and improved intestinal absorption.78 The incorporation of a biocompound such as CA into polymers may lead to the improvement of the biological compatibility, activity, and safety of the materials in biomedical applications.79,8o
In contrast to other bile acids, CA has four functional groups. The steroid possesses also an asymmetry meaning that no two positions are equivalent. For instance, the C3-0H is equatorial while the others are axial, allowing the former to possess fast chemical reactivity and to be derivatized selectively (Figure 1.12).81
o Cholesterol 011 (L) Chclesterol-7 a-nydroltytasO HO H Cholicacid o
22
o OH OH o H Chenodeoxycholic acid-S~~~nd~~---
--- --/( --- --- -- ---- -- -- -- -- ----
--7( ---
~-
---
~-
--OH OH OH H HDeoxycholic acid lithocholic acid 7-Qxo-lithocholic acid
~
1
l~~
-
T;~i~~·----. ---. ---
-1---
~----
-r ;
--~
l~
H HO" H
Uthoçholic acid sulphate Ursodeoxycholic acid
Figure 1.11. Bile acid metabolism: production of primary, secondary and tertiary
23
1.5.2 Properties of bile acids
The chemistry of bile acids involves the usual reactions for hydroxyl and carboxylic groups. However, the rates at which each hydroxylic group reacts differ from each other and merit further elaboration. The hydroxyl groups may be oxidized or esterified with a variety of reagents. The order by which each hydroxyl group reacts is dependent on its position. The order of reactivity is C7 > Cl2 > C\3, and C6 > C 3.76 The
order of ease for acetylation, reduction, and hydrolysis is quite different. The order of reactivity is C 3 > C 7 > Cn.76
The reactions of the terminal carboxyl group are typical of this group and involve the esterification which is a classic reaction to protect against the oxidative and reductive reactions in the preparation of bile acids. Also, esters tend to crystallize more easily than
in therr natural state.82 Other reactions with the carboxyl. group include the formation of
complex compounds with salt and conjugation with amino acids moiety by first coupling the carboxylic acid with azide or mixed anhydride.
Due to their unique structure with a hydrophobic p-side and a hydrophilic a-si de, bile acids possess detergent and cleaning properties which differ from typical surfactants, which have a polar head and an alkyl chain. The facial amphiphilicity of the bile acids is provided by their rigid steroid backbone from having aIl the hydroxyl and the carboxylic
groups on one side of the molecule (Figure 1.12).
In a very dilute medium, these amphiphilic molecules are present as monomers and as the concentration increases the se molecules form micelles at which the surface tension, electrical conductivity, viscosity, light scattering, and other properties abruptly change. Micelles are aggregates of amphiphilic molecules in water; the aggregation of these molecules is spontaneous above a well defined concentration known as critical
micellization concentration (CMC).83 The micelles are formed by the delicate balance of
opposing forceswhich result in aggregates that solubilize fats. Depending on the pH, presence of ions, and temperature, bile acids easily form micelles in water at
concentrations of O~6-10 mM; this is of central importance for their physiological'