Molecular dynamics in electrospun amorphous plasticized polylactide fibers
Texte intégral
Figure


Documents relatifs
We already evoked that the high fragility values obtained for the Th and TCR materials break down the idea of a simple correlation between the degree of
The parameters appearing in the equations thus obtained can be known from independent experimental ways and all have a precise physical meaning : the concentration of
The water content, the sum of total major elements and metals content, the ash content minus the sum of the metal concentrations, the sum of the volatile and semi-volatile
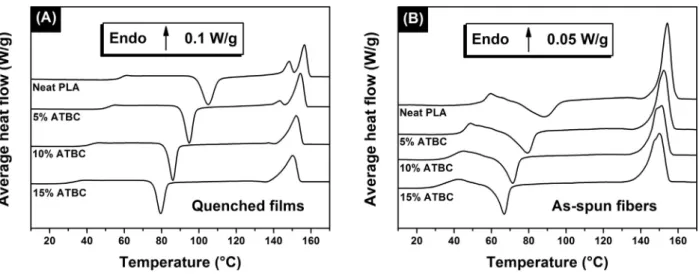
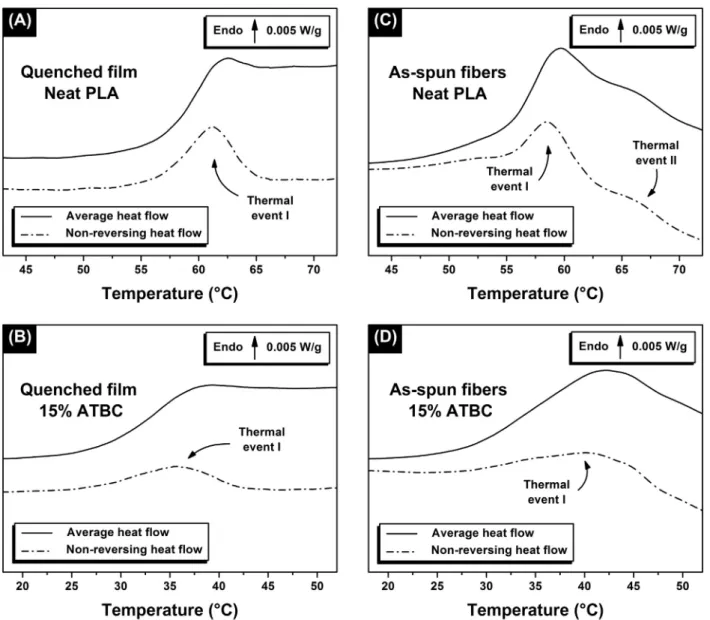
Protocol for the determination of the degree of crystallinity and the glass transition temperature from MT-DSC curves obtained for the as-spun fibers of neat PLA: Average heat flow
The first stages of the cavitation process in amorphous polymers submitted to an hydrostatic deformation in the glassy state are studied with coarse grain molecular
The frequency range was 2,4 mHz to 35 mHz, - the lower time limit set by the heat diffusion time in the sample and the upper time limit by the patience of the experimentalist
It is found from the Fourier transform (i.e. the power spectra) of the velocity autocorrelation functions and interdiffusion current auto- correlation functions that the
Particularly, it is nowadays ad- mitted that, since the experimentally determined values of the Prigogine-Defay (PD) ratio at the glass tempera- ture are generally different from
