Titre:
Title
: Efficient methods for trace analysis parallelization
Auteurs:
Authors
: Fabien Reumont-Loke, Naser Ezzati-Jivan et Michel R. Dagenais
Date: 2019
Type:
Article de revue / Journal articleRéférence:
Citation
:
Reumont-Locke, F., Ezzati-Jivan, N. & Dagenais, M. R. (2019). Efficient methods for trace analysis parallelization. International Journal of Parallel Programming, 47(5-6), p. 951-972. doi:10.1007/s10766-019-00631-4
Document en libre accès dans PolyPublie
Open Access document in PolyPublie URL de PolyPublie:
PolyPublie URL: https://publications.polymtl.ca/4212/
Version: Version finale avant publication / Accepted versionRévisé par les pairs / Refereed Conditions d’utilisation:
Terms of Use: Tous droits réservés / All rights reserved
Document publié chez l’éditeur officiel
Document issued by the official publisher Titre de la revue:
Journal Title: International Journal of Parallel Programming (vol. 47, no 5-6)
Maison d’édition:
Publisher: Springer
URL officiel:
Official URL: https://doi.org/10.1007/s10766-019-00631-4
Mention légale:
Legal notice:
This is a post-peer-review, pre-copyedit version of an article published in International
Journal of Parallel Programming. The final authenticated version is available online at: https://doi.org/10.1007/s10766-019-00631-4
Ce fichier a été téléchargé à partir de PolyPublie, le dépôt institutionnel de Polytechnique Montréal
This file has been downloaded from PolyPublie, the institutional repository of Polytechnique Montréal
Efficient Methods for Trace Analysis
Parallelization
Fabien Reumont-Locke and Naser Ezzati-Jivan and Michel R. Dagenais, Member, IEEE
Abstract—Tracing provides a low-impact, high-resolution way to observe the execution of a system. As the amount of parallelism in
traced systems increases, so does the data generated by the trace. Most trace analysis tools work in a single thread, which hinders their performance as the scale of data increases. In this paper, we explore parallelization as an approach to speedup system trace analysis. We propose a solution which uses the inherent aspects of the CTF trace format to create balanced and parallelizable workloads. Our solution takes into account key factors of parallelization, such as good load balancing, low synchronization overhead and an efficient resolution of data dependencies. We also propose an algorithm to detect and resolve data dependencies during trace analysis, with minimal locking and synchronization. Using this approach, we implement three different trace analysis programs: event counting, CPU usage analysis and I/O usage analysis, to assess the scalability in terms of parallel efficiency. The parallel implementations achieve parallel efficiency above 56% with 32 cores, which translates to a speedup of 18 times the serial speed, when running the parallel trace analyses and using trace data stored on consumer-grade solid state storage devices. We also show the scalability and potential of our approach by measuring the effect of future improvements to trace decoding on parallel efficiency.
Index Terms—Tracing, trace analysis, parallel computing
F
1
I
NTRODUCTIONHighly parallel computer architectures are now increas-ingly commonplace, whether in commercial or consumer-grade systems. Detecting and solving runtime problems, in software running in a parallel environment, is a complicated task, where classic debugging tools are of little help. Tracing, by providing a detailed log of low-level events across the system, allows one to gather enough information to solve a variety of behavioral and performance problems [1, 2], with a very low impact on system performance. The LTTng tracer [3], for example, allows for very low overhead when tracing and is optimized for scalability as the number of parallel processors increases [4].
However, as the number of parallel units in the traced system increases, so does the amount of data generated in the trace. This problem also compounds when tracing distributed systems, where each individual node may have many-core processors. The amount of trace data for such systems can be staggering, with traces of a few seconds of execution containing several gigabytes of data. Since manual inspection of these traces is not viable, a trace analysis tool is often used to analyze data and extract meaningful information from the traces. However, the current trace analysis tools are designed for serial analysis on a single thread. For instance, Trace Compass1(formerly TMF) and the Babeltrace command-line trace analysis tool2, both use a single-threaded approach
to analyze trace logs. This is problematic, because as the architecture of the traced systems becomes more and more F. Reumont-Locke (fabien.reumont-locke@polymtl.ca), Naser Ezzati-jivan (n.ezzati@polymtl.ca) , and M. R. Dagenais (michel.dagenais@polymtl.ca) are with the Computer and Software Engineering Department, Ecole Polytechnique de Montreal, P.O. Box 6079, Succ. Downtown, Montreal, QC, Canada H3C 3A7. F. Reumont-Locke now works at Google.
Manuscript received TBD; revised TBD.
1. http://projects.eclipse.org/projects/tools.tracecompass 2. https://www.efficios.com/babeltrace
parallel, the gap between the amount of data to be produced and the single-threaded analysis speed will widen. This is why the present paper explores trace analysis parallelization as an efficient method to overcome this ever widening gap.
This research therefore explores the use of parallel processing in order to accelerate trace analysis. The aim is to develop a scalable parallel method for analyzing kernel traces. However, trace analysis parallelization is not simple, and must take into account a number of challenges. Indeed, the trace analysis is a task that is intrinsically sequential: events are read in chronological order, and processing an event has implications for the analysis of subsequent events. Moreover, trace analysis is a stateful task usually based on a state system, which implies a large number of data dependencies.
Furthermore, traces, being potentially very large, are not kept entirely in memory and must be read from disk. However, reading from disk is much slower than reading from memory, by several orders of magnitude. Since the parallelization operates on the part of the program running on the processor, these memory accesses can be seen as sources of sequential processing, because the disk can only execute one query at a time. However, recent advances in SSD (Solid State Drive) technology could lessen the impact of this problem for a number of programs whose performance is based on access to the disk. It is therefore necessary, in order to demonstrate that parallelization is a viable approach to the performance problem of trace analysis, to not only set up a parallel analysis method, but also to prove that related problems such as reading trace data from disk do not jeopardize the scaling of our solution.
The contributions of this paper can be summarized by the following points:
parallelization, while remaining applicable to several types of analysis;
2) Develop a parallel method for trace analysis using this model, taking into account load balancing con-straints, synchronization and data dependencies; 3) Test the parallel efficiency of different analyses
implemented with the proposed solution;
4) Validate the scalability of the methods on different storage devices while also taking into account possi-ble improvements to trace decoding and serial trace analysis performance.
Although the proposed algorithm uses the specifications of the CTF format to parallelize the workload and analysis, we should note that a “trace” is a very generic concept that is applicable to a wide range of use cases. Any communication that follows a protocol would also present the same type of problems and solutions for parallel analysis. Therefore, the proposed methods of this research can be applied to other applications in various time series of metrics (e.g. parallel stock market evolution analysis).
This paper is organized as follows: section 2 describes related work while section 3 surveys the background of this work. Section 4 focuses on the proposed solution and methodology used to achieve the stated objectives above. Section 5 contains the evaluation and the core results of this research. Finally, section 6 contains a conclusion summarizing the research and results, before offering an overview of possible future work.
2
R
ELATEDW
ORK2.1 Tracing tools
A variety of tracing tools is available for the Linux operating system. Ftrace tracer [5] allows for kernel-space only tracing using static and dynamic tracepoints provided by the Linux kernel. SystemTap [6] relies on user-provided scripts that are compiled into kernel modules before being executed as the system is traced, a very flexible approach that comes at a cost in performance, especially when scaling to many-core systems [4]. The perf tool [7], once used mainly to retrieve performance counter values through a sampling-based approach, can also provide tracing capabilities, though with lower performance than ftrace due in part to a less efficient ring buffer implementation. LTTng [3] provides correlated traces of user and kernel-space execution [8] with minimal overhead and in a highly scalable manner [4].
Tracing as a diagnostic tool has been used in a variety of use cases, such as system verification and system metrics extraction. Trace analysis can be modeled using a finite-state machine approach [9, 10], where each analysis is executed as an automaton reading events and executing analysis code on transitions to states. These automatons could be good candidates for parallelization (i.e. one automaton per thread) but, since many analyses depend on similar data (process scheduling data, for example), the finite-state machine approach has been generalized into a global state system, which does not lend itself as easily to parallelization. The state system works by storing the current state of the whole system, which can be accessed for any time stamp within the trace. Montplaisir et al.Kouame et al. [11], Montplaisir
et al. [12] propose a method for building this state system by reading a trace sequentially and storing the state system’s data into an efficient disk-based interval tree called a State History Tree.
2.2 Parallel trace analysis
A major problem with the parallel analysis of kernel traces comes from the strong sequential dependencies within the trace data. This is due to most analyses being stateful, meaning that analyzing certain events requires information contained in previous events. A method called unipar-allelism, proposed by Veeraraghavan et al. [13], aims at solving this problem through “epoch-parallel execution” [14], also called “Predictor/Executor” [15] and “Master/Slave Speculative Parallelization” [16]. Uniparallelism works by splitting the program’s execution into epochs, which are sequences of chronologically executed instructions, and by running two versions of the program in parallel, one epoch-sequential (i.e. a regular execution) and one epoch-parallel. The epoch-sequential execution then runs a light-weight analysis which will provide the speculated starting state for the epoch-parallel execution. The epoch-parallel executions may then be executed in a parallel pipeline along the epoch-sequential execution. While this solution is interesting to solve data dependencies, it ignores possible optimizations inherent to trace analysis, which removes the need for the epoch-sequential execution (i.e. the “Predictor”).
The KOJAK EXPERT tool enables the automatic analysis of MPI application traces, for example to find wait states caused by inefficient communications [17]. However, these types of analyses become impossible to run on systems with a high number of parallel computing nodes, due to a lack of processing power and memory space. Geimer et al. [18] propose a scalable parallel approach to wait state diagnosis, which was improved by Geimer et al. [19]. Their approach is based on replaying run-time communications between nodes at trace analysis time. This allows not only the synchroniza-tion of the trace analysis, but also the communicasynchroniza-tion of data dependencies between the analysis nodes. This approach is interesting for the analysis of distributed traces, but is not efficient in a shared memory trace analysis context, where communications between “nodes” (CPUs) are frequent.
Network Intrusion Detection Systems, or NIDS, analyse network traffic in order to detect certain patterns suggesting unusual network activity. However, the NIDS throughput must be able to keep up as network traffic increases. Some have explored parallelization as a solution to scaling NIDS processing power. String matching being a large part of a NIDS’s work, it is an obvious candidate for parallelization [20]. However, it is not the only place where parallelization can come into play. Flow-level parallelization, for example, adds a level of parallelism by assigning the analysis of one flow per execution thread, where a flow is defined as a communication between two endpoints comprised of network packets. Schuff et al. [21] propose two methods, one conservative and the other optimistic, in order to allow for load balancing between the flows. A similar flow-parallel method was used by Vasiliadis et al. [22] and enhanced by adding intra-flow parallelism by offloading part of the work within a flow to the GPU. In the context of trace analysis, a
similar method could be used, with the concept of “flow” being applied to the events generated by one processor of the traced system (i.e. the content of a specific per-CPU ring buffer).
Though not directly related to trace analysis, parallel execution of state machines is an interesting avenue to consider, since trace analysis is often expressed in terms of finite automatons [9, 10]. Since state machines are an essential part of computing, their parallel execution was studied for many years. Most methods are based on the parallel prefix sum algorithm. A prefix sum calculation returns the running total (prefix sum) at every point in an array of values. Though seemingly inherently serial, due to calculations needing ac-cess to previous results, this problem has an efficient parallel implementation (often called parallel scan), detailed by Ladner and Fischer [23], and can be generalized for the calculation of any sequence of associative binary operations. By encoding transitions as functions and using function composition as the operator for a parallel prefix sum, Hillis and Steele Jr [24] offer a method for the parallelization of finite-state machine execution. Using these concepts, Mytkowicz et al. [25] propose an implementation that executes a FSM using an enumerative approach, where the current state is kept for each possible starting state. It exploits modern computer architectures as well as properties of most FSMs to efficiently perform this enumerative execution. However, it requires two passes through the input data, which greatly hinders scalability in a trace analysis context: indeed, decoding trace data, as we will see, is a major part of the CPU work for trace analysis.
3
B
ACKGROUNDIn order to identify potential parallelization solutions, we must understand how serial trace analysis functions. This section will focus on the current trace analysis design, including the trace data format, the parsing of trace files and the analysis model. Since we are using traces generated by LTTng, we will be using the Common Trace Format (CTF), in which LTTng traces are generated, and the babeltrace library, which allows reading and writing CTF traces. 3.1 CTF trace format
CTF is a flexible, compact binary trace format which caters to the needs of the embedded, telecom, high-performance and kernel communities [26]. Its particularity resides in its ability to specify the exact structure of the trace and its events through the Trace Stream Description Language (TSDL). The trace definition, written in TSDL, is stored in a metadata file which is then parsed in order to create the binary parser used to read the trace. This allows a large amount of flexibility in terms of the data stored in the trace, letting the user define the size, alignment and endianness of basic types, as well as compound types such as structures and unions.
The CTF trace format uses the concept of streams of events. Each stream represents a subset of the events of the trace, often coming from the same source. In the case of LTTng kernel traces, each stream contains the events of one CPU on the traced system. A stream is further divided into variable-sized packets, which represent contiguous sets of events. The
LTTng kernel tracer creates a packet every time a sub-buffer from the trace ring buffer is committed (e.g., ready to write to disk or send through the network).
Each packet within a stream contains a packet header. This header contains information on the packet, such as its size and start time. Whenever a packet is added to a stream, its packet header is also written in the stream’s packet index (see Figure 1). This packet index therefore contains all the packet headers for the stream, thus allowing for fast seeking in the trace using the packet’s start time and size to determine the offset of a specific time position in the trace.
As we will see, the trace format already hints at potential parallelization candidates: streams, for example, do not share information other than the read-only metadata and are good candidates for processing in parallel. Also, the concept of packet and the packet index will prove useful when discussing trace data partitioning and load balancing, in section 4.1.3.
3.2 Babeltrace trace reader
In order to read CTF traces, we will be using babeltrace. Babeltrace includes a basic CTF-to-text converting program in order to quickly read events from a CTF trace, as well as a C library in order to parse CTF traces from our program. In order to do so, the library first parses the TSDL metadata file, creating a binary parser. This parser is then used to decode the event data within the trace. The program may then query the library in order to obtain the event data.
Babeltrace works iteratively: the user creates an iterator at a specific timestamp in the trace, and the events are then parsed one-by-one and returned as the iterator advances. The concept of stream packets is also used here: babeltrace maps entire packets into memory one-by-one, unmapping the last one after all its events have been read. That way, the amount of memory used is small and nearly constant, even for very large traces.
3.3 Trace analysis model
Trace analysis is based on the concept of a state system. This state system holds what is called the trace’s current state, which represents the exact state of the system at the latest point in time during the analysis. It holds information such as a map of all processes and their state (e.g. running, preempted or interrupted), the amount of data read from and written to every file, or the average latencies for every interrupt. The current state keeps both the information that will be presented at the end of the analysis and allows the analysis to do stateful processing, for example by allowing to only consider preemption during system calls.
To illustrate this, we can look at an analysis of the latency of I/O system calls per process. A part of its execution is shown in Figure 2. It’s current state is represented as a map of the system’s processes, as well as the currently running process for each CPU. When a process is scheduled to run by a CPU, the current state updates the currently running process for this CPU. If an I/O system call entry event is read, it records the currently running system call along with its start time for the currently running process. Then, when the system call exit event is read, it retrieves the ongoing system call for the currently running process and calculates
Figure 1: Event stream, packets and packet index the difference between the end time and start time. It then adds this latency to a list of system call latencies for the currently running thread. As we can see, the current state serves both as input and output to the analysis.
This processing, at first sight, seems to be inherently serial: the fact that events provide feedback to the current state, which in turn drives large parts of the analysis, means that there are strong serial dependencies between the events. However, as we will see in section 4.2, some features of traces and trace analysis may be exploited in order to break these dependencies, or more precisely to reduce their impact and defer their resolution without the need for costly synchronization.
4
P
ROPOSEDS
OLUTIONIn this section we use the concepts discussed above to propose a new technique for efficient parallel trace analysis. In section 4.1, we discuss the problem of partitioning trace data in order to obtain good load balancing, and in section 4.2, we discuss the problem of resolving the data dependencies that arise from this partitioning.
4.1 Trace data partitioning
Data partitioning plays an important role in parallelization: how the workload is divided among the processing nodes has an impact on the communications between nodes, the synchronization strategy as well as the load balancing. An improper partition of the data may lead to highly inefficient behavior and poor scalability.
Trace data may be organized along two “dimensions”: the time dimension, with events arranged chronologically along a timeline, and the stream dimension, with events arranged by their source. In the case of kernel traces, these sources correspond to the CPUs of the traced system. Data partitioning therefore arises from these two dimensions: the trace data can be partitioned per stream or per time range. 4.1.1 Per-stream partitioning
Per-stream partitioning assigns each stream in the trace to an analysing thread, as can be seen in Figure 3b. If there are more streams than processors, then the streams are enqueued and analyzed when a processor is free.
However, this approach presents a number of problems. The main problem is that it puts an upper bound on the number of parallel processing units that can be used for analysis. For example, if a 64-core machine is used to analyse a trace coming from an 8-core machine, 56 of its cores will be unused. It is also possible that some streams contain more events than others (i.e. some processors were more busy), thus creating load balancing problems.
Figure 2: Current state updating as trace events are read
4.1.2 Per-time range partitioning
Another solution would be to partition the trace along the time axis, as shown in Figure 3a. Each processor would then parse and analyse the events from all streams between two specific timestamps.
This solution solves the main problem of the per-stream partitioning by removing the upper bound on the number of parallel units that can be used. Furthermore, it solves the data dependency problems of the per-stream analysis: each segment of trace data may be treated as an individual trace, since each processor has access to the data of every stream. But this approach is also problematic, mainly due to the fact that trace events are unevenly distributed through time, as shown in Figure 3, by the grey-scale heat-maps. This means that some processors will have more events to parse and analyse than others, leading to load balancing problems and hindering scalability. Another problem is the possibility of arising temporal data-dependencies: events that occurred in a previous time range may have an effect on the analysis of the current time range, but are not accessible to the processor. These data dependencies must also be solved in order to obtain an accurate analysis.
4.1.3 Hybrid packet-based partitioning
In order to solve the problem of load balancing, we use an element of the CTF trace format called the stream packet index. As described in section 3.1, CTF traces define trace streams as a series of packets, which represent contiguous trace data. Each packet contains a packet header followed by the events’ data. The packet header includes metadata such as the starting timestamp of the packet and its size, which is used when parsing the trace. Furthermore, every packet header is also written to an index file called the stream packet index. This index allows for fast timestamp seeking in a trace stream by enabling a binary search to be done on packet start times, and getting an offset in the stream file where to start reading.
Our solution to the data partitioning problem is to use this packet index to create balanced workloads for which the number of events is almost the same. If we assume that packet size is proportional to the number of events (as shown in Figure 1) and each event has more or less the same size (e.g., 32 bytes in case of LTTng kernel tracer), we can use the packet size in order to estimate the number of events in a packet. By iterating through the stream packet index, we can accumulate packets until a certain threshold size is met and thus create chunks of data from a single stream between two timestamps, as in Figure 3c. These chunks can then be
Figure 3: (a) Per-time range, (b) per-stream and (c) hybrid partitioning schemes, with gradient showing event density
added to a shared queue for analysis by the processing nodes. Please note that we previously assumed that the events are from the same size but that assumption was only for finding a fair method to partition the trace events. However, since the events are probably from the different sizes, then there might be slight differences in the size of chunks which is negligible in our case. Our goal is to have approximately, but not exactly, the same size workloads of trace events, to be processed simultaneously by the different processors and having slight differences in the workload sizes would not change neither the algorithms, nor the results, and as long as it’s better than the two other alternatives, it’s kind of a win as far as load-balancing goes.
We therefore use a hybrid data partitioning scheme, splitting workloads both per-stream and per-time range, while assuring that the number of events in each partition is approximately constant. This solves the problem of load balancing by creating equal workloads, whose size can be parameterized using a smaller or larger threshold.
4.2 Resolving data dependencies
The aforementioned problems of data dependencies are closely linked to the design of trace analyses. Most trace analyses proceed using the concept of a current state, which is both read and written to as the analyser reads the trace events (see section 3.3). This current state holds, for example, the state of each process running on the system (e.g. running, blocked, preempted) or the amount of data read from and written to each file. Analyses can write to the current state to update the values that will be presented at the end of the analysis, but can also read from it in order to know, for example, the starting time of the current system call in order to calculate its latency.
4.2.1 Temporal dependencies
In our solution, each thread holds its own independent cur-rent state, which is empty when the thread starts. Problems arise when some parts of the current state are unknown due to some events being in a previous chunk of trace data. Since the trace is partitioned in time ranges, the current state at the beginning of each time range is unknown to the thread processing it. For example, it is possible that a system call spans two time ranges, with its entry event in one time range and its exit in the next time range. The thread processing the second time range does not have access to the start time and input parameters of the system call, while the thread processing the first time range does not have access to its end time and return value.
Fortunately, most analyses are not deeply dependant on the system’s initial state: unknown state does not radically
affect the results of the analysis by propagating erroneous values. Indeed, this unknown state happens invariably at the beginning of any trace, even if analysed sequentially. Some events, implemented by the LTTng tracer, provide complementary information (such as the file names linked to file descriptors that were open before tracing started) and are triggered only at the beginning of the trace, but these are usually not a hard requirement for analyses. We can therefore tolerate this unknown state for certain values, provided that the next event affecting this value will determine unambiguously its new state. In more formal terms, our analysis must have a 1-to-1 relationship between transitions and state, such that each transition points to one and only one state.
The algorithm for resolving data dependencies goes as such: each worker thread keeps a thread-local current state initialised to default values. It then iterates through the events of the trace data that was assigned to it, updating the current state as events are read. If an event causes processing that depends on an unknown current state value, the worker thread saves the necessary information separately from the current state. Once all the events are read, the worker thread returns its current state which holds the results of the analysis on its chunk of data, plus all the unknown state values that need further processing.
In order to resolve the unknown values, a merging phase is executed on the results of the worker threads. The merging routine does two things: first, it gathers the content of both states in order to obtain a single current state, for example by summing the total amount of data read from a file during both time ranges. Second, it resolves unknown values by propagating values from the earlier chunks’ current state to the later chunks. For example, an interrupt that spanned two chunks will have the interrupt’s start event in a first chunk and the end event in a second chunk. When merging the chunks, we detect both an unfinished interrupt in the first chunk and an unknown interrupt ending in the second. By matching these two, we can reconstruct the whole information for that specific interrupt and add its latency, for example, to a global list of interrupt latencies.
The merging phase operates in a sum-like fashion, whereas the current states of the first two chunks are merged into a resulting current state, which is then merged with the third chunk’s current state, and so on. The final current state will therefore hold all the merged information from all the chunks. This means that merging must occur in chronological order. While this seems to introduce strongly serial process-ing to the algorithm, two aspects can be exploited in order to exploit parallelism during the merge phase. First, merging is a relatively small task executed once for every chunk, and
can easily be pipelined into the general processing described before: as soon as the chunks are processed, they may be merged in parallel while the rest of the trace is analysed. This is hampered by the fact that chunks must be treated in chronological order, but assuming that chunks are balanced and processed in chronological order, this fact should not cause bad pipeline stalling. Second, merging is an associative binary operation, meaning that the parallel scan algorithm described in section 2.2 could possibly be used to introduce parallelism into the merge phase.
4.2.2 Inter-stream dependencies
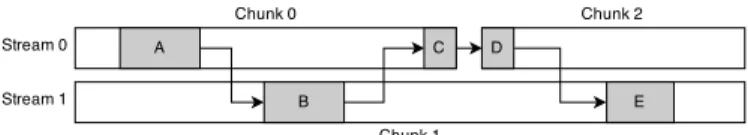
The above data dependency resolving strategy works well for temporal dependencies. However, the hybrid packet-based trace data partitioning scheme detailed above introduces another data dependency problem: inter-stream dependen-cies, where some of the dependent information is located in another stream. This happens, for example, when a process is migrated from one CPU to another during tracing, such that its events are on different streams.
In order to solve these dependencies, we can use a similar approach as to the one described above. The difference is that dependent events may now occur both in a prior chunk as well as in a “concurrent” chunk, meaning a chunk whose time range overlaps the time range of the current chunk. Since inter-stream dependencies happen on process migrations, we can detect these migrations by reading the migration event, and treat all subsequent analysis of the migrated thread as dependant on its execution in another stream. We therefore need to keep multiple current states, one for each “execution”, where an execution is a series of events for a process separated by a migration. We may then apply the same merging algorithm as before on these executions, and thus propagate unknown values throughout our analysis.
In Figure 4, the analysis would work as follow:
1) As chunk 0 is analyzed, a migration event occurs. The current state is saved for execution A. When the process migrates back to chunk 0, its current state is saved.
2) In parallel, the other chunks are processed. They treat migration events similarly, and we get a number of executions (A, B, C, D, E).
3) Once analysis is done, the merging begins. Merging is done in chronological order of start time, such that chunks 0 and 1 are merged first.
4) The executions in chunks 0 and 1 are sorted by start time. Executions A, B and C are merged. Execution E is kept unmerged, since it occurs after the end of chunk 0 and is dependent on execution D, which is not yet available.
5) The merged results of chunks 0 and 1 are then merged with chunk 2. The temporal dependency at execution D is merged, then the inter-stream dependency at E. All the chunks have been merged and the analysis is done.
This solution adds additional work in two ways: first, it requires chunks to be merged in order of starting time, meaning that the chunks from different streams must be sorted after iterating through the packet indexes. Second,
Figure 4: Data dependencies between executions across streams and chunks
it requires the execution of the merging routine for every “sub-chunk” created when a migration occurs. These two factors do not affect the overall performance greatly, since the number of chunks is relatively low and therefore fast to sort, and since migrations are unfrequent and therefore do not add a significant amount of merging.
5
E
XPERIMENTALR
ESULTS5.1 Experimental methodology
In order to assess whether parallelization is a viable strategy to enhance the performance of trace analysis, we must not only show that our method provides speedup in the analysis of trace data, but also that this speedup is efficient: it is sometimes possible to obtain large speedups given larger amounts of computing power, but that may come at the cost of wasted computing power due to low efficiency.
Furthermore, trace analysis suffers from relying on stor-age device speed, since trace data resides on disk and may not be able to fit into main memory. Since disk accesses are orders of magnitude slower than accesses to memory and cache, they can become a bottleneck if the amount of work on the CPU is less than the time spent retrieving data from disk.
Finally, the CPU workload of trace analysis is strongly dependent on the speed of trace decoding (in our case provided by the babeltrace library). Testing our parallel trace analyses using this library ignores possible future improvements to trace decoding which could hinder the efficiency of parallelization by lowering the CPU workload and increasing the effect of the I/O bottleneck.
For our suggested method to be deemed efficient, we must explore these possibilities and weight their effect on trace analysis parallelization. To do this, we created a simulation program, described in the following section, which allows us to run experiments that will help calculate bounds on the parallel efficiency on various storage devices and with (simulated) faster trace decoding.
The following results were all obtained on a server equipped with a quad-socket Supermicro H8QGL mother-board, with 4 AMD Opteron 6272 16-core 2.1 GHz processors (for a total of 64 cores) and 128 GB of DDR3 SDRAM. 5.2 Workload simulation
In order to better assess the effect of memory and I/O operations on parallel trace analysis, our simulation program simulates the CPU, memory and disk workload of a trace analysis program. The simulation program works as follows: a single file is given as input to the program, which separates the reading of the file to multiple threads. Each thread maps a part of the file into memory, then proceeds to read
every first byte aligned on page boundaries. This way, we ensure that each byte read will trigger a page fault with minimum accompanying CPU work. The program then does an arbitrary amount of work for every byte in the form of a loop by simply incrementing a counter. Once all the threads are finished, the program returns the sum of all the thread results. Listing 1 shows a simplified version of the code used. The actual program was implemented using the OpenMP compiler instructions.
This program allows us to tweak certain parameters in order to observe the program’s scalability under different conditions. We can change the amount of CPU work done per page fault by setting a higher or lower number of iterations. This allows us to simulate a more or less complex trace analysis, or to simulate a more optimized trace decoding. We can also experiment with different sizes for the memory mapped regions in order to simulate trace packets of various sizes. Finally, we can also tweak the parameters sent to the I/O functions, allowing us to activate or deactivate features such as read-ahead or pre-faulting of pages.
By tweaking the parameters of the program, we can simulate a throughput similar to that of reading a trace file sequentially, without doing any analysis. This will give us an upper bound in terms of how much trace analysis can benefit from parallelization on various I/O hardware [27]. 5.2.1 Concurrent memory operations
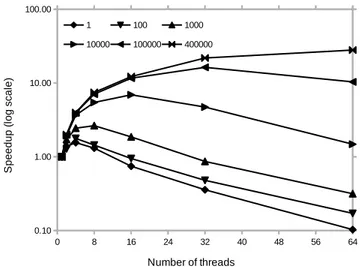
When running benchmarks on the simulation program, significant slowdowns were observed as the number of concurrent threads increased. This effect can be seen in Figure 5. However, these slowdowns were unrelated to I/O operations and were mainly observable during cache hot benchmarks, meaning that the trace data was contained entirely within the system’s page cache (i.e. the disk-backed pages kept in memory by the operating system). This slowdown was not created by a contention in our program either, nor by cache thrashing, since no data was shared between the threads.
Upon further inspection, it appeared that the bottleneck was within the kernel itself, more specifically within the
Listing 1: Simulation program code
1 threadRoutine(size_t chunk_size, void *
chunk_offset, int file) {
2 char *buffer = mmap(NULL, chunk_size,
PROT_READ, MAP_PRIVATE, file, chunk_offset);
3 size_t i;
4 unsigned long sum;
5 for (i = 0; i < chunk_size; i += PAGE_SIZE)
{ 6 sum += buffer[i]; 7 /* burn CPU */ 8 int j; 9 for (j = 0; j < ITERATIONS; j++) { 10 sum++; 11 } 12 } 13 munmap(buffer); 14 return sum; 15 }
Figure 5: Speedup of concurrent memory operations for increasing CPU workloads (number of iterations)
memory management module of the kernel. Under the Linux operating system, each process holds a data structure describing its virtual memory, as well as a single read/write lock for the whole address space. These components are shared by all the threads within the process, since threads operate on the same address space. Whenever a memory operation (i.e. mmap and munmap system calls) or a page fault occurs, the global lock is taken in order to protect the global structures from concurrent accesses. This means that the memory operations and page faults of our simulation pro-gram are being serialized, thus creating a strong contention on the kernel lock and causing the observed slowdown.
A workaround to this problem would be to use processes instead of threads, thus separating the address spaces of our workers. However, this approach increases the complexity of the code, since inter-process communications must be handled instead of relying on shared memory. Another approach would be to modify the kernel code in order to improve the scalability of memory operations, as proposed by Clements et al. [28].
In order to work around this issue without modifying the kernel or making our application too complex, we decided to simply use a pipelined approach in order to remove the overhead due to lock contention. The pipelined program works by doing all the memory operations and page faults serially: one thread map the chunks in a serial manner and hands them off to be processed in parallel, with the final stage of the pipeline doing a serial unmapping of the chunks. This pipelined program was implemented using the Intel Threading Building Block (TBB) library, which allows the creation of pipelined tasks using a C++ API.
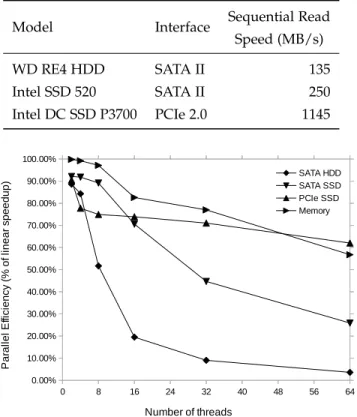
5.2.2 Parallel efficiency on various storage devices The following results were obtained by running our pipelined simulation program on different storage devices. The program’s parameters were selected such that the sequential throughput in terms of data processed per second would be on par with the throughput of a sequential reading of a trace using the babeltrace reader. The devices used are summarized in Table 1. The sequential read speed was
acquired experimentally using the command hdparm -t, which gives sequential read speed without file system overhead.
Figure 6 shows the parallel efficiency for our simulation program reading trace data from various storage hardware as well as directly from memory (i.e. from the page cache). Parallel efficiency is measured as the percentage of linear speedup achieved, using the formula E = S/N where S is the speedup obtained using N threads. Speedup is defined as S = t1/tN where t1is the serial time and tN the time with N threads. An optimal solution would have a constant 100% parallel efficiency for any N and an efficiency of 1/N means no speedup over the sequential solution.
The reason we will use efficiency rather than acceleration is that, in general, acceleration is a metric that is sometimes too optimistic and difficult to contextualize and compare. Indeed, it is often possible to obtain ever greater accelera-tions by increasing the amount of parallel computing units. However, this implies that a potentially large number of cycles is wasted. Parallel efficiency is also easy to evaluate, since it is enough to compare to a perfect efficiency of 100%. The results indicate that the efficiency of processing data from a hard disk drive quickly drops as the number of threads increases. However, we still maintain a 60% parallel efficiency at 8 threads, which translates to a speedup of 5. In other words, a parallel trace analysis could expect up to 5 times speedup using 8 threads, or process 5 times as much data in the same time period.
If better storage devices are used, such as an SSD, we get a higher than 70% parallel efficiency up to 16 threads, which translates to a speedup of 11. For a high-performance PCIe SSD, the parallel efficiency is above 63% up to 64 threads, which translates to a speedup of 40. At the moment of this writing, such high-performance SSDs are becoming readily available in consumer- and server-grade markets, pushing back the boundary on I/O-boundedness for many types of programs.
5.2.3 Parallel efficiency with optimized trace decoding In order for trace analysis to be efficiently parallelizable, it is important to consider the impact of possible future optimiza-tions in the CPU efficiency of trace decoding. In other words, if trace decoding becomes more efficient in its CPU usage, will trace analysis become bounded by I/O operations, and will therefore cease to gain from parallelization?
In order to test this scenario, we changed our benchmarks such that the simulation program would run not only with parameters that simulated throughput similar to current sequential trace decoding, but also with parameters that simulated the cases where decoding would be twice, 4 times, 8 times and 16 times as fast. These benchmarks were again run on the storage devices from Table 1 and on memory. The results are shown in Figure 7.
The parallel efficiency of analyzing data from a hard drive drops dramatically as simulated trace decoding improves. This is due to the data being analyzed faster than it is read from disk, because of the slow accesses to the drive. We could therefore argue that parallelization is not a future-proof solution, since its efficiency is greatly hindered when using better trace decoding. However, hard disk drives are being supplanted by more efficient storage devices, namely
Table 1: Test storage devices specifications
Model Interface Sequential Read
Speed (MB/s)
WD RE4 HDD SATA II 135
Intel SSD 520 SATA II 250
Intel DC SSD P3700 PCIe 2.0 1145
Figure 6: Parallel efficiency of simulation for various storage devices
high performance solid state drives. When using these types of drives, the drop in efficiency is not as severe as before: using a regular SATA SSD, we keep decent parallel efficiency even with twice and 4 times faster trace decoding. Using a high performance PCIe SSD, we stay above 50% efficiency up to 32 threads with a 4 times faster trace decoding, and decent parallel efficiency for 8 times faster trace decoding.
An aspect to keep in mind is that the results shown above represent a lower bound on parallel efficiency: they represent the worst case scenario for trace analysis, since the workload simulates events that are only decoded, without analysis. Normal trace analyses execute possibly heavy CPU operations when events are read, meaning that the actual CPU workload (and therefore parallelization opportunity) would in fact be greater, thus improving parallel efficiency. Furthermore, by freeing up CPU time from trace decoding, we would possibly be able to run more complex analyses or a higher number of simultaneous analyses, which would in turn benefit from the parallel execution.
5.3 Parallel trace analysis efficiency
We have shown in the previous section that parallel trace analysis would not be seriously hindered by I/O-boundedness problems, whether with the current trace decoding speed or with better trace decoding. We can now look at the parallel efficiency for actual trace analyses, using an implementation of the proposed solution.
The solution was implemented using the Qt Concurrent3 3. http://doc.qt.io/qt-5/qtconcurrent-index.html
Figure 7: Parallel efficiency as simulated trace decoding speed increases
framework, which offers a simple MapReduce-like API for parallelization. The framework allows for the creation of map and reduce tasks, which are used for the chunk analysis and merge phases, respectively. The trace on which the analyses were run is from an 8-core machine (thus contains 8 streams of events) and contains 44,897,970 events.
5.3.1 Test analyses
The following three analyses were tested:
• count: the count analysis represents the simplest pos-sible “useful” analysis. It simply counts the number of events in the trace and returns the total to the user. This analysis does little more than parsing the events, and can be treated as a lower bound in terms of parallelization potential since so little CPU work is done.
• cpu: the cpu analysis is a more useful, but still simple analysis. It gathers the percentage of active CPU time per-CPU and per-thread using scheduling events. This analysis is slightly more complex than count, but only looks at scheduling events.
• io: the io analysis gathers the amount of data read and written by every process. It does so by parsing
read- and write-related system calls. This analysis is more complex than the last two: it requires stateful processing (in order to know which system call exited, since system call exit events do not specify the system call that has exited) and slightly more complex merging. It therefore requires more CPU work, and should benefit more from parallelization. The results in Figure 8 and Table 2 show the elapsed time, speedup and parallel efficiency for the three different analyses, with trace data stored on the storage devices from Table 1 and in memory. It is important to note that the current parallel trace analyses suffer from the concurrent memory operation problem mentioned in section 5.2.1 since the memory operations are not yet pipelined.
We can see that parallel efficiency is lower than with our simulation program. This is due to various factors: the bottleneck in the kernel due to the non-pipelined memory operations, inefficiencies within the trace decoding library and less efficient I/O operations (e.g. no read-ahead or pre-faulting), for example. There is also a fixed amount of serial work at the beginning of the analysis due to the parsing of the trace metadata, which becomes proportionally smaller as trace data size increases. As for the serial work done in the
Figure 8: Parallel efficiency of trace analyses for various storage devices Table 2: Benchmark results for trace analyses on PCIe SSD
Threads Analysis Metric 1 2 4 8 16 32 64 count Time (s) 108.21 60.95 29.14 16.70 9.96 7.35 7.82 Speedup - 1.78 3.71 6.48 10.87 14.73 13.84 Efficiency - .888 .928 .810 .679 .460 .216 cpu Time (s) 116.94 61.72 32.31 17.30 10.80 8.28 9.02 Speedup - 1.89 3.62 6.76 10.83 14.12 12.96 Efficiency - .947 .905 .845 .677 .441 .202 io Time (s) 191.48 97.99 52.17 27.29 15.78 10.55 11.31 Speedup - 1.95 3.67 7.02 12.13 18.15 16.93 Efficiency - .977 .918 .877 .758 .567 .265
merge phase, it should not affect the total run time, since this phase can be pipelined into the rest of the program, meaning that every time a chunk is ready to be merged, the merge is done in parallel with the other chunks being processed.
The babeltrace trace reading library was the source of various bottlenecks: its inability to create multiple iterators
on a single trace led to a work-around which functioned by copying a certain amount of shared data when creating a new iterator. However, this method brought its own set of inefficiencies, mainly in the form of a certain amount of unwanted and unnecessary locking during the copy. We can therefore attribute a part of the loss of parallel
efficiency to the serial design of the trace decoding library, which had nothing to do with problems in the detailed solution. More details about this limitation is available in the full dissertation, available electronically from Ecole Polytechnique de Montreal [29].
Still, the benchmarks show appreciable efficiency up to 16 threads, and efficiency above 80% up to 8 threads, which are typical levels of parallelism found in regular workstations. These efficiencies translate to speedups of one order of magnitude (> ×10) on consumer-level hardware. This is a significant speedup, allowing for time-consuming analyses to be processed in seconds rather than minutes.
As we can see from the results, the parallel efficiency is higher when running more complex analyses, visible here in the io analysis. This is expected, since more complex analyses rely on higher CPU workloads which are better suited to parallelization. However, it is interesting to note that a slight increase in complexity (in this case mainly due to the usage of a hash-map in the io analysis) translates to significantly better parallel efficiency: the efficiency with 32 threads for the io analysis is 28.5% higher than for the cpu analysis (from 44.1% up to 56.7%). More complex analyses could potentially benefit even more from parallelization.
We also see that, apart from the results where trace data was stored on a hard-drive, the analysis is not bound by the accesses to the storage devices. We can therefore conclude that trace decoding in its current implementation is not I/O bound when reading trace data from solid state drives. Furthermore, using the results from the previous section, we can extrapolate that this efficiency will hold even as trace decoding improves.
6
C
ONCLUSION AND FUTURE WORKThis research has shown that parallelization provides an efficient way to enhance the performance of trace analysis. We developed a solution which provides balanced workloads using data available directly from the trace format, and which keeps locking and synchronization to a minimum by deferring the resolution of data dependencies. Using this solution, we implemented parallel trace analyses that yielded speedups of up to 18 times, with good parallel efficiency up to 32 threads. We also showed, using our simulation program, that trace analysis is no longer I/O-bound when using modern but readily-available solid state storage devices, and that this holds even as trace decoding improves.
In order to achieve better scaling, improvements must be made to the trace decoding library. These improvements will allow for more efficient parallelization by reducing unnecessary copying of data and lock contention. Since only read-only data is shared between the threads, the potential speedup could be brought up at least to the level of the simulation program. Furthermore, the problem of concurrent memory operations in the Linux kernel could be resolved, or worked around, for interesting scalability gains. We know that these improvements will enhance scalability, since we showed in section 5.2 that potentially better speedups are possible with good enough storage devices.
Trace analysis results can be stored in the State History Tree database in order to allow fast access to the current state at any moment in the trace. For the moment, the construction
of the State History Tree relies on intervals being added in sorted time order, to avoid rebalancing. A possible future work would be to allow the history tree to be rebalanced, so that we may add unsorted intervals, therefore allowing for parallel analysis to output into a State History Tree.
Distributed trace analysis would also be an interesting solution, especially in the context of analyzing distributed traces: the concepts detailed in the present research could possibly be applied to analyzing trace data on multiple nodes, allowing for dedicated analysis nodes within a computing infrastructure. Furthermore, some current trace analyses allow for live processing of traces streamed over the network. Future work could adapt parallel trace analysis to the context of live tracing.
A
CKNOWLEDGMENTSThe financial support of the Natural Sciences and Engi-neering Research Council of Canada (NSERC) and Ericsson Software Research is gratefully acknowledged. We would also like to thank Francis Giraldeau for his advice and comments, as well as Geneviève Bastien and Julien Desfossez for their help.
R
EFERENCES[1] C. Biancheri, N. Ezzati-Jivan, and M. R. Dagenais, “Multilayer virtualized systems analysis with kernel tracing,” in 2016 IEEE 4th International Conference on Future Internet of Things and Cloud Workshops (FiCloudW 2016), Aug 2016, pp. 1–6. [Online]. Available: https://doi.org/10.1109/W-FiCloud.2016.18
[2] N. Ezzati-Jivan and M. R. Dagenais, “Multi-scale navigation of large trace data: A survey,” Concurrency and Computation: Practice and Experience, vol. 29, no. 10, pp. e4068–n/a, 2017, e4068 cpe.4068. [Online]. Available: http://dx.doi.org/10.1002/cpe.4068
[3] M. Desnoyers and M. Dagenais, “The lttng tracer: A low impact performance and behavior monitor for gnu/linux,” in Proceedings of the Ottawa Linux Sympo-sium, vol. 2006, 2006.
[4] M. Desnoyers and M. R. Dagenais, “Lockless multi-core high-throughput buffering scheme for kernel tracing,” ACM SIGOPS Operating Systems Review, vol. 46, no. 3, pp. 65–81, 2012.
[5] S. Rostedt, “Finding origins of latencies using ftrace,” Proc. RT Linux WS, 2009.
[6] F. C. Eigler and R. Hat, “Problem solving with system-tap,” in Proc. of the Ottawa Linux Symposium. Citeseer, 2006, pp. 261–268.
[7] A. C. de Melo, “The new linux’perf’tools,” in Slides from Linux Kongress, 2010.
[8] P.-M. Fournier, M. Desnoyers, and M. R. Dagenais, “Combined tracing of the kernel and applications with lttng,” in Proceedings of the 2009 linux symposium, 2009. [9] G. Matni and M. Dagenais, “Automata-based approach
for kernel trace analysis,” in Electrical and Computer Engineering, 2009. CCECE’09. Canadian Conference on. IEEE, 2009, pp. 970–973.
[10] F. Wininger, N. Ezzati-Jivan, and M. R. Dagenais, “A declarative framework for stateful analysis of
execution traces,” Software Quality Journal, vol. 25, no. 1, pp. 201–229, Mar 2017. [Online]. Available: https://doi.org/10.1007/s11219-016-9311-0
[11] K. Kouame, N. Ezzati-Jivan, and M. R. Dagenais, “A flexible data-driven approach for execution trace filtering,” in 2015 IEEE International Congress on Big Data, June 2015, pp. 698–703. [Online]. Available: https://doi.org/10.1109/BigDataCongress.2015.112 [12] A. Montplaisir, N. Ezzati-Jivan, F. Wininger, and
M. R. Dagenais, “State history tree: An incremental disk-based data structure for very large interval data,” in 2013 International Conference on Social Computing, Sept 2013, pp. 716–724. [Online]. Available: https://doi.org/10.1109/SocialCom.2013.107
[13] K. Veeraraghavan, D. Lee, B. Wester, J. Ouyang, P. M. Chen, J. Flinn, and S. Narayanasamy, “Doubleplay: Parallelizing sequential logging and replay,” ACM Transactions on Computer Systems (TOCS), vol. 30, no. 1, p. 3, 2012.
[14] E. B. Nightingale, D. Peek, P. M. Chen, and J. Flinn, “Parallelizing security checks on commodity hardware,” in ACM Sigplan Notices, vol. 43, no. 3. ACM, 2008, pp. 308–318.
[15] M. Süßkraut, T. Knauth, S. Weigert, U. Schiffel, M. Mein-hold, and C. Fetzer, “Prospect: A compiler framework for speculative parallelization,” in Proceedings of the 8th annual IEEE/ACM international symposium on Code generation and optimization. ACM, 2010, pp. 131–140. [16] C. Zilles and G. Sohi, “Master/slave speculative
paral-lelization,” in Microarchitecture, 2002.(MICRO-35). Pro-ceedings. 35th Annual IEEE/ACM International Symposium on. IEEE, 2002, pp. 85–96.
[17] F. Wolf and B. Mohr, “Automatic performance analysis of hybrid mpi/openmp applications,” Journal of Systems Architecture, vol. 49, no. 10, pp. 421–439, 2003.
[18] M. Geimer, F. Wolf, B. J. Wylie, and B. Mohr, “Scalable parallel trace-based performance analysis,” in Recent Advances in Parallel Virtual Machine and Message Passing Interface. Springer, 2006, pp. 303–312.
[19] M. Geimer, F. Wolf, B. J. N. Wylie, and B. Mohr, “A scalable tool architecture for diagnosing wait states in massively parallel applications,” Parallel Computing, vol. 35, no. 7, pp. 375 – 388, 2009. [Online]. Available: http://www.sciencedirect.com/ science/article/pii/S0167819109000398
[20] A. Tumeo, O. Villa, and D. G. Chavarria-Miranda, “Aho-corasick string matching on shared and distributed-memory parallel architectures,” Parallel and Distributed Systems, IEEE Transactions on, vol. 23, no. 3, pp. 436–443, 2012.
[21] D. L. Schuff, Y. R. Choe, and V. S. Pai, “Conservative vs. optimistic parallelization of stateful network intrusion detection,” in Performance Analysis of Systems and soft-ware, 2008. ISPASS 2008. IEEE International Symposium on. IEEE, 2008, pp. 32–43.
[22] G. Vasiliadis, M. Polychronakis, and S. Ioannidis, “Midea: a multi-parallel intrusion detection architecture,”
in Proceedings of the 18th ACM conference on Computer and communications security. ACM, 2011, pp. 297–308. [23] R. E. Ladner and M. J. Fischer, “Parallel prefix
compu-tation,” Journal of the ACM (JACM), vol. 27, no. 4, pp.
831–838, 1980.
[24] W. D. Hillis and G. L. Steele Jr, “Data parallel algo-rithms,” Communications of the ACM, vol. 29, no. 12, pp. 1170–1183, 1986.
[25] T. Mytkowicz, M. Musuvathi, and W. Schulte, “Data-parallel finite-state machines,” in Proceedings of the 19th international conference on Architectural support for programming languages and operating systems. ACM, 2014, pp. 529–542.
[26] M. Desnoyers. Common trace
for-mat (ctf) specification. [Online].
Avail-able: http://git.efficios.com/?p=ctf.git;a=blob_plain; f=common-trace-format-specification.md;hb=master [27] A. Vergé, N. Ezzati-Jivan, and M. R. Dagenais,
“Hardware-assisted software event tracing,” Concurrency and Computation: Practice and Experience, vol. 29, no. 10, p. e4069, 2017, e4069 cpe.4069. [Online]. Available: https: //onlinelibrary.wiley.com/doi/abs/10.1002/cpe.4069 [28] A. T. Clements, M. F. Kaashoek, and N. Zeldovich,
“Scalable address spaces using rcu balanced trees,” in ACM SIGARCH Computer Architecture News, vol. 40, no. 1. ACM, 2012, pp. 199–210.
[29] F. Reumont-Locke, “Méthodes efficaces de parallélisa-tion de l’analyse de traces noyau,” Masters thesis, École Polytechnique de Montréal, 2015.
Fabien Reumont-Locke Fabien Reumont-Locke is a Software Engineer
at Google. He received his Master’s degree in Computer Engineering and BS degree in Software Engineering at Polytechnique Montreal in 2015. His research interests include tracing and multicore systems.
Naser Ezzati-Jivan Naser Ezzati-Jivan is currently a Research
Asso-ciate in the department of Computer and Software Engineering at École Polytechnique de Montréal, Montreal, Canada. His research interests include the Big Data Analysis, Cloud Computing and Distributed Systems Debugging. He received his Ph.D. in Computer Engineering from École Polytechnique de Montréal, Montreal, Canada in 2014.
Michel R. Dagenais Michel Dagenais is professor at Ecole
Polytech-nique de Montreal and co-founder of the Linux-Québec user group. He authored or co-authored over one hundred scientific publications, as well as numerous free documents and free software packages in the fields of operating systems, distributed systems and multicore systems, in particular in the area of tracing and monitoring Linux systems for performance analysis. In 1995-1996, during a leave of absence, he was the director of software development at Positron Industries and chief architect for the Power911, object oriented, distributed, fault-tolerant, call management system with integrated telephony and databases. In 2001-2002 he spent a sabbatical leave at Ericsson Research Canada, working on the Linux Trace Toolkit, an open source tracing tool for Carrier Grade Linux. The Linux Trace Toolkit next generation is now used throughout the world and is part of several specialised and general purpose Linux distributions.