3D Visualization of Cadastre: Assessing the Suitability of Visual
Variables and Enhancement Techniques in the 3D Model of
Condominium Property Units
Thèse
Chen Wang
Doctorat en sciences géomatiques
Philosophiæ doctor (Ph.D.)
Québec, Canada
Condominium Property Units
Thèse
Chen Wang
Sous la direction de :
Jacynthe Pouliot, directrice de recherche
Frédéric Hubert, codirecteur de recherche
iii
La visualisation 3D de données cadastrales a été exploitée dans de nombreuses études, car elle offre de nouvelles possibilités d’examiner des situations de supervision verticale des propriétés. Les chercheurs actifs dans ce domaine estiment que la visualisation 3D pourrait fournir aux utilisateurs une compréhension plus intuitive d’une situation où des propriétés se superposent, ainsi qu’une plus grande capacité et avec moins d’ambiguïté de montrer des problèmes potentiels de chevauchement des unités de propriété. Cependant, la visualisation 3D est une approche qui apporte de nombreux défis par rapport à la visualisation 2D. Les précédentes recherches effectuées en cadastre 3D, et qui utilisent la visualisation 3D, ont très peu enquêté l’impact du choix des variables visuelles (ex. couleur, style) sur la prise de décision.
Dans l’optique d'améliorer la visualisation 3D de données cadastres, cette thèse de doctorat examine l’adéquation du choix des variables visuelles et des techniques de rehaussement associées afin de produire un modèle de condominium 3D optimal, et ce, en fonction de certaines tâches spécifiques de visualisation. Les tâches visées sont celles dédiées à la compréhension dans l’espace 3D des limites de propriété du condominium. En ce sens, ce sont principalement des tâches notariales qui ont été ciblées. De plus, cette thèse va mettre en lumière les différences de l’impact des variables visuelles entre une visualisation 2D et 3D. Cette thèse identifie dans un premier temps un cadre théorique pour l'interprétation des variables visuelles dans le contexte d’une visualisation 3D et de données cadastrales au regard d’une revue de littéraire. Dans un deuxième temps, des expérimentations ont été réalisées afin de mettre à l’épreuve la performance des variables visuelles (ex. couleur, valeur, texture) et des techniques de rehaussement (transparence, annotation, déplacement). Trois approches distinctes ont été utilisées : 1) discussion directe avec des personnes œuvrant en géomatique, 2) entrevue face à face avec des notaires et 3) questionnaire en ligne avec des groupes ciblés. L’utilisabilité mesurée en termes d’efficacité, d’efficience et de degré de satisfaction a servi aux comparaisons des expérimentations.
Les principaux résultats de cette recherche sont : 1) Une liste de tâches visuelles notariales utiles à la délimitation des unités de propriété dans le contexte de la visualisation 3D de condominium ; 2) Des
recommandations quant à l'adéquation de huit variables visuelles et de trois techniques de rehaussement afin d’optimiser la réalisation d’un certain nombre de tâches notariales ; 3) Une analyse comparative de la
iv
3D visualization is being widely used in GIS (geographic information system) and CAD (computer-aided design) applications. It has also been introduced in cadastre studies to better communicate overlaps to the viewer, where the property units vertically stretch over or cover one part of the land parcel. Researchers believe that 3D visualization could provide viewers with a more intuitive perception, and it has the capability to demonstrate overlapping property units in condominiums unambiguously. However, 3D visualization has many challenges compared with 2D visualization. Many cadastre researchers adopted 3D visualization without thoroughly investigating the potential users, the visual tasks for decision-making, and the appropriateness of their representation design. Neither designers nor users may be aware of the risk of producing an inadequate 3D visualization, especially in an era when 3D visualization is relatively novel in the cadastre domain.
With a general aim to improve the 3D visualization of cadastre data, this dissertation addresses the design of the 3D cadastre model from a graphics semiotics viewpoint including visual variables and enhancement techniques. The research questions are, firstly, what is the suitability of the visual variables and enhancement techniques in the 3D cadastre model to support the intended users' decision-making goal of delimitating condominium property units, and secondly, what are the perceptual properties of visual variables in 3D visualization compared with 2D visualization?
This dissertation firstly identifies the theoretical framework for the interpretation of visual variables in 3D visualization as well as cadastre-related knowledge with literature review. Then, we carry out a preliminary evaluation of the feasibility of visual variables and enhancement techniques in a form of an expert-group review. With the result of the preliminary evaluation, this research then performs the hypothetico-deductive scientific approach to establishing a list of hypotheses to be validated by empirical tests regarding the suitability of visual variables and enhancement techniques in a cartographic representation of property units in condominiums for 3D visualization. The evaluation is based on the usability specification, which contains three measurements: effectiveness, efficiency, and preference. Several empirical tests are conducted with cadastral users in the forms of face-to-face interviews and online questionnaires, followed by statistical analysis. Size, shape, brightness, saturation, hue, orientation, texture, and transparency are the most discussed and used visual variables in existing cartographic research and implementations; thus, these eight visual variables have been involved in the tests. Their perceptual properties exhibited in the empirical test with concrete 3D models in this work are compared with those in a 2D visualization, which is derived from a literature-based synthesis. Three enhancement techniques, including labeling, 3D explosion, and highlighting, are tested as well.
There are three main outcomes of this work. First, we established a list of visual tasks adapted to notaries for delimiting property units in the context of 3D visualization of condominium cadastres. Second, we describe the
v
in the context of 3D visualisation of condominium property units, based on the usability specification for delimitating visual tasks. For example, brightness only shows good performance in helping users distinguish private and common parts in the context of 3D visualization of property units in condominiums. As well, color hue and saturation are effective and preferable. The third outcome is a statement of the perceptual properties’ differences of visual variables between 3D visualization and 2D visualization. For example, according to Bertin (1983)’s definition, orientation is associative and selective in 2D, yet it does not perform in a 3D visualization. In addition, 3D visualization affects the performance of brightness, making it marginally dissociative and selective.
vi
Résumé ... iii
Abstract ... iv
Table of Contents ... vi
List of Tables ... ix
List of Figures ... x Acknowledgement ... xii Chapter 1 Introduction ... 1 1.1 Context ... 1 1.2 Problematic ... 2 1.3 Research Questions ... 7 1.4 Objectives ... 8 1.5 Methodology ... 9
1.6 Contributions of the work ... 12
1.7 Thesis organization ... 13
Chapter 2 - 3D Visualization: Concepts, Theories, and Challenges ... 15
2.1 Introduction to the general theory of visualization ... 15
2.2 Data in visualization ... 18
2.3 User and User’s Visual Tasks ... 20
2.4 The 3D geo-visualization design space ... 23
2.4.1 Introduction ... 23
2.4.2 Symbols and visualization primitives ... 25
2.4.3 Visual variables ... 26
2.4.4 Environment settings ... 30
2.5 3D geo-visualization challenges ... 34
2.5.1 A review of challenges ... 34
2.5.2 A review of current solutions ... 37
2.6 Summary ... 40
Chapter 3 - 3D Visualization of Condominium Property Units: Data, Users, Usages, and 3D Cadastre Model Designs ... 41
3.1 Introduction to cadastre ... 41
3.2 Cadastre data in condominium situation ... 42
vii
3.2.2 Netherlands ... 44
3.2.3 Singapore ... 44
3.2.4 Australia... 45
3.3 Cadastre Users and Usages ... 45
3.4 3D cadastre visualization design: state of the art ... 48
3.5 Summary ... 52
Chapter 4 Suitability of Visual Variables and Enhancement Techniques for 3D Visualization of Condominium Property Units ... 53
4.1 Empirical tests of the suitability of visual variables ... 53
4.1.1 A preliminary evaluation of visual variables’ feasibility ... 53
4.1.2 Empirical tests visual variables in the face-to-face interview with notaries ... 59
4.1.3 Perceptual property synthesis and discussions ... 68
4.2 A comparison of visual variables’ perceptual properties between 3D and 2D ... 74
4.3 Conclusion of the chapter ... 79
Chapter 5 Transparency for Delimitating Property Units with Physical Counterparts ... 82
5.1 Introduction ... 82
5.2 Case study ... 82
5.3 Design of the experiment ... 83
5.3.1 Methodology ... 83
5.3.2 Prebuilding 3D models ... 84
5.3.3 The online questionnaire ... 88
5.4 Results and analysis ... 91
5.5 Limits and discussion ... 98
5.6 Summary ... 100
Chapter 6 Conclusion and Further Research ... 102
6.1 Report on research objectives ... 102
6.2 Research significance ... 105
6.3 Discussions ... 106
6.4 Future research ... 109
6.4.1 Towards a 3D geo-visualization ontology ... 109
6.4.2 Further empirical tests of visual variables in 3D geo-visualization ... 110
6.4.3 The practice of 3D visualization of cadastre ... 111
viii
Appendix 1 Examples of the 3D models created for preliminary evaluation ... 127
Appendix 2 List of the tested 3D models in a face-to-face interview with notaries ... 135
Appendix 3 Test results of the face-to-face interview with notaries ... 149
Appendix 4 List of the tested 3D models in the online questionnaire ... 154
Appendix 5 Analysis of Correctness Data in the Online Questionnaire ... 157
Appendix 6 Analysis of Certitude Data in the Online Questionnaire ... 159
ix
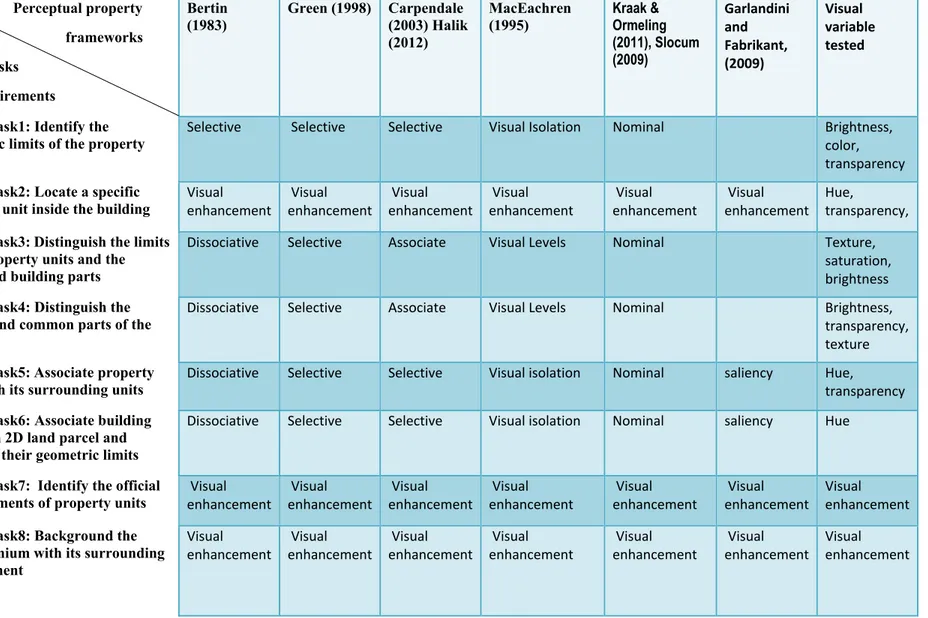
Table 4.1. The preliminary evaluation of the visual variables' feasibility for each visualization requirement ... 57 Table 4.2. Perceptual property involves in each tested visual task and visualization requirement according to six different frameworks respectively ... 70 Table 4.3. The perceptual properties of visual variables in 3D visualization synthesized from our test and organized by different frameworks ... 72 Table 4.4. Compare visual variables’ perceptual properties in 3D with Bertin(1983)’s result in 2D ... 75 Table 4.5. Compare 3D perceptual properties with Green (1998)’s perceptual properties of visual variables .. 75 Table 4.6. Compare 3D perceptual properties with Carpendale (2003) and Halik (2012)’s perceptual properties of visual variables ... 76 Table 4.7.Compare 3D perceptual properties with MacEachren (1995)’s perceptual properties of visual variables ... 77 Table 4.8.Compare 3D perceptual properties with Kraak & Ormeling (2011) and Slocum (2009)’s perceptual properties of visual variables ... 77 Table 4.9.Compare 3D perceptual properties with Garlandini and Fabrikant (2009)’s perceptual properties of visual variables ... 78 Table 5.1.List of tested 3D models with their related Alpha values ... 87 Table 5.2. Average correctness, certainty, and time elapse of the six tested 3D models ... 93
x
Figure 1.1. Complementary Plan for condominium property unit in Quebec (Pouliot, Vasseur, & Boubehrezh, 2012) ... 2 Figure 1.2. Representation of condominium property units in Russian 3D cadastre prototype (Elizarova et al., 2012) ... 6 Figure 1.3. Move-floor-model for 3D visualization of property units in Russian 3D cadastre prototype
(Vandysheva et al., 2012) ... 7 Figure 1.4. Research steps of this work, by UML activity diagram ... 10 Figure 2.1. The pipeline model of visualization from data to viewer's knowledge, adjusted from Chen and Jänicke (2010) ... 17 Figure 2.2. An example of complex 3D symbol of a cardiovascular hospital ... 25 Figure 2.3. Same 3D scene with different projection: A, orthographic projection; B, perspective projection ... 31 Figure 2.4. Different directional lightings and the shadows influence the brightness of surfaces. A: the light source is placed on the right, B: the light source is placed on the left. The two images use a same 3D model.31 Figure 2.5. Shading effect changes the perception of a symbol’s shape. The circle with brighter top illustrates a shape of convex and the circle with darker top shows a shape of concave. ... 32 Figure 2.6. Background influences the perception of symbol's size ... 33 Figure 2.7. Atmospheric effect fog makes the further symbols dimmer ... 34 Figure 2.8. Representation of 3D topologic relationship: three different representation designs. A. Black boundary, white surface; B. Black boundary, white surface, transparent surface; C. Different color for the surface of different property units, transparent surface. ... 36 Figure 2.9. A comparison of the photorealistic (A) and non-photorealistic (B) representation (Neubauer & Zipf, 2007) ... 39 Figure 2.10. 3D labeling for non-geometrical information (Bazargan & Falquet, 2009) ... 40 Figure 4.1. The building under study that contains overlapping condominium property units ... 60 Figure 4.2. Two 3D models using the visual variable color to encode different property units for visual task 1, identify the geometric limits of the property units. A: one floor, B: multiple floors together. Transparency is used as a visual enhancement to manage occlusion ... 64 Figure 4.3. An example of how perspective view interferes the perception of brightness. In this figure, surface A appears darker than surface B. However, they have a same brightness value. ... 80 Figure 5.1.The property boundary of unit A lies along the A. interior, B. median or C. exterior boundary of the building part. ... 83 Figure 5.2. Fictional scenario used for tests, the red arrow points to a private property unit, and "A", "B", "C" point to three wall parts. Each wall part either belongs to the private property units or not ... 85 Figure 5.3. Examples of 3D models in the test, the red arrow points to a private property unit, and the green arrow points to a wall part. The participants have to decide whether this wall part belongs to the private property unit or not. A. Yes, B. No ... 86 Figure 5.4. A snapshot of the interface in the demonstrative section of the online questionnaire; the left part is the description of 2 possible situations (interior and exterior); the right part is the 3D web viewer of 3D cadastre model; the lower right is the navigation aid ... 90 Figure 5.5. A snapshot of test interface in the online questionnaire, it contains a 3D model, two questions and a navigation aid. When the participant finished answering, it can click “Page Suivante”(the next page). ... 90 Figure 5.6. The number of participants by discipline ... 92
xi
Figure 5.7. Participant's experience with cadastre data, organized by their disciplines ... 92
Figure 5.8. Participant's experience with 3D visualization, organized by their disciplines ... 93
Figure 5.9. Histogram of log of the participants’ response time, showing a normal distribution pattern ... 95
Figure 5.10. Plot of standard residuals versus fitted values, no pattern spotted ... 95
Figure 5.11. Example of bipartite background with transparent foreground coded as ABPQ regions ... 99
Figure 6.1. The structure of visual variable in the 3D geo-visualization ontology (sketched). The solid line represents rdfs:subClassOf, the dash line represents class property with cardinality constrains ... 110
xii
Acknowledgement
This thesis, with a length of around 170 pages, covers much of my works during 4 years study and research in Laval University. However, I may never achieve this accomplishment without other people’s generous support and help. I would like to offer my sincere gratitude to them.
First of all, I shall express my earnest thanks to my advisor professor Jacynthe Pouliot. She gave me the opportunity to pursuit my ambitious in geo-spatial research. Her wisdom, knowledge, and foresight guide my research, especially in a methodological and philosophical way. Her effort is extreme precious considering that she is the director of the department and undertakes a huge amount of administrative tasks. I shall also give my heartfelt gratitude to my co-advisor professor Frédéric Hubert. Thanks for his support, and thanks for his kind courage during my several hard times. I also express my gratitude towards the other professors, including professor Françis Roy, professor Stéphane Roche, professor Marc Cocard, professor Marc Gervais, and professor Jantien Stoter (from Delft University of technology, external examiner). Thank you for all your support and kind comments!
I would like also to express my gratitude to all the other students that contribute to my research. They are: Alborz Zamyadi, Marc Vasseur, Abbas Boubehrezh, and Vivien Fuchs. We are not only team members, but also friends. We share a same interest, work together for different projects, and participant as a group in multiple activities. Thank you all for the good memories in Laval University.
I also thank Groupe VRSB for their valuable cadastre data. Their detailed cadastre data of a condominium in Quebec is the basis of many of my works. I appreciate all participants of our experiment. Thank you for your precious time.
My father and my mother provided huge amount of mental support even they were not in Canada. Without their encouraging and caring, I may never overcome the downs in my life during Québec. They always tell me that the success only comes with great effort. They also solve my questions with their experience and wisdom about life and relationship. I would like to thank them one more time. I would also appreciate the good time with all my friends in Quebec. They are Roshanak Rahmani, Thomas Butzbach, Émile Couture, Basilique Tek, Nanxin Fu, Hai Zhang, XuFeng Xing, Philippine Parmentier, and Aude Popek. I would like to hang out with you in future! Finally, I would like to thank China Scholarship Council and NSERC (Natural Sciences and Engineering Research Council of Canada) for financing my stay in Québec. Their financial support enables me to concentrate largely on my research without any distraction. I also thank the China Montreal Consulate for helping me manage related documents and activities.
1
Chapter 1 Introduction
"New symbol systems are being developed constantly to meet the needs of a society increasingly dependent on data. Once developed, they may stay with us for a very long time, so we should try to get them right"--Colin Ware (2012)
1.1 Context
3D visualization is currently a basic part of many geospatial solutions, for example, commercial Geographic Information System software such as ArcScene and CityEngine. Also, it is a hot topic in the academic world as geospatial researchers try to improve it using new software (Ribeiro, Almeida, & Ellul, 2014), new visualization strategies (Sieber, Hollenstein, & Eichenberger, 2012), and through applications to geospatial sub-domains (Ross, Bolling, Döllner, & Kleinschmit, 2009). It is also a realm that reflects the cross-domain nature of geospatial research, as researchers try to integrate knowledge or research methods from a wide spectrum of research outside the geospatial domain, like information visualization (Bleisch & Nebiker, 2008), cognitive science (Wood, G.Pearson, Calder, Miller, & Tinto, 2005), and human-computer interaction (Popelka & Dolez, 2015). The common features of 3D visualization, which could refer to either an environment or a computer system, can be identified here as: first, it uses a 3D model, namely the volumetric representation of real world objects; and second, it enables the perception of the volumetric representation from different angles with an illusion of depth. In this dissertation, 3D visualization only refers to those on a monoscopic display like 2D LCD (liquid crystal display) or CRT (cathode ray tube). Despite the availability of stereo 3D devices, 2D displays like LCD and CRT are still widely used.
As a geospatial sub-domain, cadastre is also starting to adopt 3D visualization, as can be seen in the discussion of first, second, and third 3D cadastre workshops (Aditya, Iswanto, Wirawan, & Laksono, 2011; Jeong, Jang, Lee, & Hong, 2012; Vandysheva et al., 2012). Cadastres play a significant role in modern society, as they register immovable properties and provide necessary information for land administration, tax calculations, real estate transactions, and mortgages (Stoter, 2004). The term cadastre, as used herein, may refer to the cadastre system and/or the cadastre map (called the cadastre plan in Quebec, Canada). A cadastre system is a property information system that is based on immovable property units and is up-to-date. A cadastral map is normally one part of a cadastre, and it supports cadastre information visualization.
According to the review of different countries' responses to a 3D cadastre questionnaire issued by Van Oosterom1, modern mainstream cadastre visualization does not have 3D visualization capabilities except in Germany and in ShenZhen, China. However, the registration of overlapping properties, where the property
2
vertically stretches over or covers only one part of the land parcel, may require a special graphical representation in order to facilitate cadastre registration, updating, and communication (Khoo, 2011; MRNF, 2003; Shojaei, Kalantari, Bishop, Rajabifard, & Aien, 2013). 2D visualization approaches such as floor plans, cross-sections, and isometric diagrams may have limits. For example, in Quebec, for overlapping situations, Complementary Plan (PC), as shown in Figure 1.1, is provided to represent the cadastre survey for 2D visualization. The PC uses floor plans for each floor and a vertical profile of all the floors together to visualize the condominium situation. As indicated by Pouliot et al. (2011), it requires considerable mental effort and a certain level of experience for the user to understand the spatial arrangement of property units with PC.
Figure 1.1. Complementary Plan for condominium property unit in Quebec (Pouliot, Vasseur, & Boubehrezh, 2012)
1.2 Problematic
The interest of using 3D visualization to face some limits of the 2D visualisation of property boundaries is clearly identified in the literature (Aditya et al., 2011; Guo et al., 2013; Jeong, Kim, Nam, Li, & Cho, 2011; Karki, Thompson, Mcdougall, Cumerford, & Oosterom, 2011; Shojaei, 2012; Vandysheva et al., 2012). However, many issues are yet to be addressed.
The third dimension is a double-edged sword (Elmqvist, Assarsson, & Tsigas, 2007). Despite the existence of rich literature regarding the advantages of 3D visualization and many positive examples in the cadastre domain, 3D visualization has some negative influences on human perception. Van Oosterom (2013) mentioned that occlusion in 3D visualization may be an obstacle to a user's perception of property units in a complex building
3
or in underground construction. Meanwhile, regarding information visualization, Ware (2012) mentioned that shadows, which are common in 3D visualizations, may sometimes be confusing to users. Moreover, since the volumetric representations could be aggregated together as a complex structure in three dimensions, a saliency-guided approach may be necessary to help users focus on relevant sub-region for details (Kim & Varshney, 2006). These examples demonstrate that 3D visualization has shortcomings and limits.
Additionally, the designers and researchers should consider factors other than visualization technology. MacEachren and Kraak (2001) formulated five issues associated with visual representation (data, semiotics, map uses, map users, and technology) in geo-visualization, and technology is only one of them. In the discussion of information visualization challenges, Chen (2005) mentioned other factors, including prior knowledge, aesthetics, usability, and elementary cognitive tasks. 3D visualization of properties is one application of geo-visualization, but it may require a specific visualization approach since research suggests that visualization design and implementation are largely ad-hoc (Rogowitz, Treinish, & Bryson, 1996). Intended users, their tasks, and attitudes towards 3D visualization are also critical factors. The result of a 3D visualization approach may largely be task dependent (Taylor, Herbert, & Chen, 2015) and influenced by end users' cognitive capabilities and preferences (Haklay, 2010). Usability, which is a benchmark indicating how easily, efficiently, and satisfactorily users achieve their visual tasks with a human computer interface, is an important criterion for the evaluation of visualization and, thus, should be considered as well. According to ISO 9241-11 (1998), usability could be evaluated using three factors: the effectiveness and efficiency of the user's visual tasks with the interface and the user's subjective satisfaction. It has already been argued by a few researchers that this is a fundamental benchmark for 3D visualization of a cadastre (Shojaei et al., 2013; Van Oosterom, Stoter, & Ploeger, 2011).
Despite the expectations of 3D visualization, most recent research regarding cadastres simply mentions the implementation of 3D visualization as being one part of a prototype system, without thoroughly discussing the reasoning and decision-making behind the designs and implementations. Based on a review of over 100 pieces of literature published since 2011, fewer than 10 articles primarily focused on 3D visualization and 3D representation (Pouliot & Wang, 2014), and most discussed it from a technical aspect. Many research studies were feasibility studies of technology and 3D cadastre system design. For instance, Shojaei et al. (2012) developed a 3D visualization system based on Google Earth for 3D ePlan/LandXML data to be used in overlapping property situations. Shojaei, Rajabifard, Kalantari, Bishop, and Aien (2014) then established a web-based 3D cadastral visualization system with a comprehensive review of functional visualization requirements and the applicability of 3D visualization platforms. Aditya et al. (2011) developed two 3D cadastre web map prototypes based on KML with Google Earth and X3D with ArcGIS online, respectively, and Olivares García, Virgós Soriano, & Velasco Martín-Varés (2011) explained how to use KML and Google Earth to visualize a
4
volumetric representation of property units in condominiums. Much of their research, as evaluated here, indicates that current technical capability has reached a point that most of the 3D visualization functions required by cadastre could be well supported.
Moreover, intended users and their tasks are the preliminary concerns in visualization research (Chen & Czerwinski, 2000; MacEachren & Kraak, 2001; Plaisant, 2004). However, there is minimal current research in the 3D visualization of cadastre, except for Elizarova et al. (2012) and Shojaei et al. (2013), as they discussed those in a comprehensive way and embedded the direct participation of the end user. Since 3D visualization of cadastre is novel compared with the current 2D approach, the end user's opinion of it, their capability to use it, and the real value gained from it remains obscure. Based on a literature review, the only cases that cooperate with users for design, implementation or evaluation are in the pilot system of Russia and Victoria, Australia. In the Russian pilot system, experts in Rosreestr (the Russian cadastre institution) and other cadastral engineers are invited to evaluate the pilot system in the form of a questionnaire (Elizarova et al., 2012). Moreover, in Victoria, Australia, the visualization requirements of professional users are discussed in detail (Shojaei et al., 2013). Twenty academy and industry experts in cadastres have participated in evaluating the prototype. In summary, in order to support cadastre-related tasks, the design and application of 3D visualization in cadastres of overlapping properties should consider not only the pros and cons of 3D visualization but also other factors, such as the cadastre domain context, the intended users, their tasks, and the usability of the visualization results, which a number of current research papers failed to do.
In a 2D context, the visualization framework that involves visual variables and graphic semiotics is a representation framework that is influential among both cartographers (Roth, 2012) and researchers in information visualization such as Carpendale (2003), Voigt & Polowinski (2011), and Zuk (2008). This could be the groundwork upon which a user's interaction is based. Research studies involving visual variable-based theories reveal much experience in and knowledge about the suitability of visual variables and graphical semiotics. There are many visual variables, but the most often discussed are size, shape, brightness, saturation, hue, orientation, texture, and transparency. Each visual variable performs differently, depending on the characteristics of the intended visual tasks (Bertin, 1983; Carpendale, 2003; Halik, 2012).
Considering the impact of visual variable-based theories in the research of cartography and information visualization in 2D visualization, a careful design of a 3D cadastre model that considers the suitability of visual variables and graphic semiotics may also be valuable. An example is the study of Jobst and Döllner (2008). They discussed how to use cartographic-oriented design to construct a 3D city model considering semiotics, symbols, and visual variables. The 3D models in 3D visualization are also termed three-dimensional cartographic
5
models by Terribilini (1999) and graphic aspects of 3D Map by Haeberling (2002), from an aspect of the semiotics of graphics.
Much cognition research suggests that human perception of visual variables may greatly change in a 3D situation compared with that in 2D; thus, the conclusions and principles regarding the capability of visual variables and semiotics of graphics in 2D visualization to communicate information should not be applied to 3D visualization readily. For example, Todd (2004)'s work disclosed that the perception of visual variable shape in a 3D context is influenced by other visualization factors such as occlusion contours and edges of high curvature. At the same time, shape perception is relatively straightforward in a 2D context. Tory et al. (2006)'s research concludes that precise orientation and position perception is hard in a 3D context. 3D visualization also gives more capability to the visual variable transparency. In 3D visualization, transparency could not only represent underlying data but also be a visual enhancement to ease the occlusion. The viewer's judgment of transparency may change, too. For example, using variations of brightness and hue to create transparency illusions, as shown in the studies of D’Zmura, Colantoni, Knoblauch, & Laget (1997) and Metelli, Da Pos, & Cavedon (1985), is applicable to 2D visualization. However, it is no longer feasible in 3D visualization since the viewer could perceive the surface from multiple angles. As a result, investigating the suitability of visual variables in a 3D context for cadastral tasks is the preliminary step for a meticulous study of the 3D visualization from a graphic semiotics' view. However, there is no such research paper placed in the cadastre domain and very few in the geospatial domain, except Hardisty (2001) (preliminary evaluation of visual variables in 3-D visualization), Fosse, Veiga, and Sluter (2005) (preliminary assessment of color hue in 3-D visualization), and Jobst and Döllner (2008) (non-photorealistic 3-D city).
Besides visual variables, visual enhancement techniques like labeling and highlighting have been used in interactive visualization and provide convincing profits like an attention guide (Robinson, 2009). They also provide the capability to address some drawbacks of 3D visualization (Elmqvist et al., 2007; Trapp, Beesk, Pasewaldt, & Döllner, 2011). The most discussed visual enhancements include labeling in order to represent data that is hard to encode to visual variables, occlusion management in order to mitigate visual obstruction like objects detaching, and visual highlighting in order to guide viewer's attention. They are based on representation with symbols and visual variables but diverge from conventional graphic semiotics to help user's perception. For example, use text for annotation (Métral, Ghoula, & Falquet, 2012b; Shojaei et al., 2013), unevenly change the scale of the 3D scene to create fisheye view (Elmqvist, 2007), or add an new symbol of arrow above an original symbol to attract viewer's attention (Trapp et al., 2011). In sum, an investigation of visual enhancement techniques in the 3D visualization of cadastre may be beneficial, yet no dedicated research has been implemented in the cadastre context.
6
Stemming from the misuse of visual variables and enhancement techniques, many of the current representation designs may be insufficient for unambiguous communication with the viewer about the overlapping properties in condominiums to support decision-making. Taking the prototype of Russian 3D cadastre for example, in figure 1.2, the 3D visualization of a condominium combines properties with its physical counterpart together. Moreover, this representation uses visual variable colors to indicate different property units as well as physical objects. However, it is hard to unambiguously distinguish which color or which group of colors corresponding to the physical objects, notably those without an ordinary shape of a wall, like the frames in this model. Furthermore, this representation could not depict the inside structure of this building about the property units. For occlusion issues, they used visual enhancement techniques to move the floor model to enable users to drag out one floor along with the 2D floor plan, as shown in figure 1.3. However, "drag out" changes the horizontal position of the property unit, thus hindering the perception of the spatial relationship between property units with land parcels and with property units of other floors. Additionally, in figure 1.2, the highlighting of a wall's boundaries by using the visual variable color "red" is confusing since viewers may doubt whether it highlights the outer wall or just its boundaries and whether there is a relationship between the red used for highlighting and the property units that are colored red.
7
Figure 1.3. Move-floor-model for 3D visualization of property units in Russian 3D cadastre prototype (Vandysheva et al., 2012)
To sum up, insufficient investigation of 3D visualization in cadastre research, especially in relation to visual variables, graphic semiotics, and enhancement techniques, may bring about the risk of producing 3D visualization solutions that do not support the user's decision-making. Currently, researchers, system developers, and end users are not aware of or do not pay enough attention to the hazards of unsuitable 3D visualization solutions. Inadequate 3D representations may reduce the perceptual efficiency of their end users. Furthermore, they may trigger user misunderstandings and mistakes and, thus, damage cadastral integrity and the interests of property stakeholders. Comprehensive 3D visualization research that considers the factors mentioned above is urgently needed. In an era in which 3D visualization is relatively novel in the cadastral domain, users' adaptation of 3D visualization to existing 2D solutions will be determined by their experience with specific 3D solutions, e.g., whether they can unambiguously and efficiently achieve their goals with a particular design to a great extent. It is also a period in which design conventions and users' habits have not yet been established; thus, 3D visualizations that come out first may influence later designs and user expectations, whether with a good impact or a bad one.
1.3 Research Questions
Considering the problematic, the general research subject of this work is how to improve 3D visualization
of condominium property units, considering intended users and their decision-making goals. The focus
of this dissertation is on the 3D cadastre model from a semiotics of graphics aspect, namely visual variables and visual enhancement techniques. Two research questions are identified:
1. What is the suitability of visual variables and visual enhancement techniques in the 3D visualization of condominium property units to support users’ decision-making goals?
8
2. Do the visual variables in the 3D visualization of condominium property units exhibit the similar visual variables’ perceptual properties, as in 2D visualization?
Here, suitability refers to the capability of a visual variable or enhancement technique to represent the underlying data in order to enable viewers to accomplish their decision-making goals or their visual tasks. There are multiple indicators of the suitability of a specific visualization design, for example, appreciation, usability, usefulness, and the appropriateness of adoption (Van Velsen, Van Der Geest, Klaassen, & Steehouder, 2008). The selection of the indicator will be further discussed in the following sections as a part of the research methodology.
1.4 Objectives
The general aim of this work is to improve the 3D visualization of condominium property units while considering the intended users and their decision-making goals. This dissertation addresses
the subject of the 3D cadastre model from a semiotics of graphics point of view, in which visual variables and enhancement techniques are applied to perform 3D visualization. Considering the great number of the applicable visual variables, visual enhancement techniques, and the potential user, it is recommended to establish the objectives of the thesis based on a pre-selection set of graphic elements and decision-making. The list of visual variables and visual enhancement techniques is selected from current cartographic and information visualization research. It includes eight visual variables (size, shape, brightness, saturation, hue, orientation, texture, and transparency) and three enhancement techniques (labeling, object detaching, and highlighting), as they are the most used and discussed in the literature. Besides the usage of a specific visual variable, the detailed settings of the visual variable may also affect the suitability. Due to the time limit of this dissertation, only one visual variable is selected for detailed tests of its settings. We select transparency, because, first, of its importance in 3D visualization as an occlusion management, and second, the viewer's perception of transparency in 3D visualization greatly changed from 2D visualization.
Among all potential cadastre visualization users, such as surveyors, urban planners, and property owners, the potential users considered are mainly notaries and notarial students since the notaries' work directly ensured the integrity of property transaction and registration in Quebec. In order to limit the investigation, this research considers one main decision-making goal: to delimitate property units in condominiums.
Three objectives are specified to answer the previous research questions:
1. To evaluate the suitability of a preselected list of visual variables and visual enhancement techniques for performing unambiguous delimitation of overlapping property units in condominiums in the context of 3D visualization.
9
2. To evaluate the suitability of transparency with different transparency settings for performing unambiguous delimitation property units and their physical counterpart in 3D visualization. 3. To compare the perceptual properties of visual variables exhibited in 3D visualization of
condominium property units with those in 2D visualization.
The overall intention of these research objectives is to improve the design of the 3D model of condominium property units considering intended users and their decision-making goals in order to promote good practices of 3D visualization of cadastre.
1.5 Methodology
As stated in the research question and objectives, the research is placed in a context of condominium, which is one common type of overlapping property units. Figure 1.4 demonstrates the general workflow of the research in this dissertation. A comprehensive review of the reliable literature is the starting point of this research, and it accompanies the entire research process for information synthesis and results comparison. These are the main methods for synthesizing visualization concepts and identifying potential cadastre data and users. It also supports the comparison between 3D and 2D visualization by listing conclusions in other studies. Studies on a similar scale -- for example, those in an urban context with a scale ranging from a city to a single building -- are favorable. For reliability, best evidence synthesis (Slavin, 1986) has to be used due to the massive amount of literature and its varying credibility. The selection of reliable literature in this work uses four pieces of evidence: (1) controlled experiments, (2) empirical tests with credible test design, (3) logical reasoning with examples, and (4) widely accepted articles with external validation.
10
Figure 1.4. Research steps of this work, by UML activity diagram
In order to evaluate the suitability of visual variables and enhancement techniques, the dissertation uses the expert group method to determine feasibility. All of Bertin's visual variables are tested, including position, size, value, color, orientation, shape, and texture. For the visualization enhancement technique, information labeling is tested. The expert group consists of two professors and four graduate students in our 3D research groups at Laval University. They first determine the five visualization requirements necessary to support the decision-making goal of delimitating property units based on a literature review and their experience. Then, more than 200 3D models were constructed and evaluated. In each 3D model, only one visual variable or only one enhancement technique is used to encode underlying data, and the other visual variables and environment
11
settings are kept largely constant. The assessment of the suitability of each 3D model is largely subjective but based on the expert reviewers' knowledge and experience, and the conclusions are derived from their evaluations with thorough reasoning and discussion. This step is helpful for us to limit the following evaluation by providing preliminary knowledge about the feasibility of each visual variable and visualization enhancement technique and by quickly eliminating the non-feasible or obviously feasible solutions.
This dissertation then performs the hypothetico-deductive scientific approach to empirically evaluate the suitability of the selected visual variables and enhancement techniques. The empirical test process is the center of this dissertation. In each test, it establishes a series of hypotheses to be falsified by empirical studies. Using empirical study is not only a requirement of the hypothetico-deductive scientific approach but also a fundamental need to achieve user-centered design (Wallach & Scholz, 2012). Many researchers have evaluated their visualization design empirically like Bleisch (2012) for geospatial visualization, MacEachren et al. (2012) for information visualization, and Shojaei et al. (2013) for cadastre visualization. Compared with simple subjective evaluation and analysis, empirical studies could more precisely evaluate the suitability of a visualization design (Green, 1998).
The evaluation criteria are the benchmark of a specific visualization design's suitability. They are the measurements that empirical evaluation tries to access, and the design process aims to improve. Among all the evaluation criteria, such as those listed by Van Velsen, Van Der Geest, Klaassen, & Steehouder (2008), the usability is selected to be the main suitability indicator in the test of this dissertation as it seems tightly linked with both the visualization design and the viewer's reaction. It has already been discussed in 3D visualization research of cadastre by a few researchers as a fundamental requirement for 3D visualization of cadastre (Shojaei et al., 2013; Van Oosterom et al., 2011). According to the usability specifications in ISO 9241, the experiment assesses the visual variables' and visual enhancement techniques' usability based on the observation and analysis of the user's effectiveness, efficiency, and preference with 3D models. However, due to the experiment limits, as different geometry of 3D model may influence the efficiency measurement, some of the tests only consider the effectiveness and preference.
The empirical test of the suitability of visual variables and enhancement techniques is a recursive process. In each round of test, the first step is to select a few visual variables and enhancement techniques to be empirically tested. Then, the precise visual tasks for determining the decision-making goals are devised. The selection of visual variables and visual tasks is based on the conclusions of the experiments performed during the preliminary test. The selection also considers the length of the test, as its duration should not be too long. The test then produces a series of hypotheses regarding the suitability of visual variables and enhancement techniques. Each hypothesis involves one visual variable for only one visual task. Then, the test scenarios are
12
designed, and the 3D models are constructed according to the hypotheses. Meanwhile, a group or a few groups of participants are selected and invited to participate in the tests. The analysis of the test results may support or reject the hypotheses and, thus, may contribute valuable material to fulfill the research objectives of suitability evaluation. Each round of empirical tests will contribute valuable information, and each subsequent round aims to solve the new research questions that are prompted by previous rounds. For this dissertation, there will be a preliminary evaluation with an expert group and two rounds of empirical tests centered around the first research objective of eight visual variables (size, shape, brightness, saturation, hue, orientation, texture, and transparency) and the second research objective of transparency. In a preliminary evaluation of the visual variable's suitability, we only evaluate by the criterion of feasibility, which is the effectiveness subjectively assessed by experts. The selection of the participants is largely a convenient sampling, which means we chose all notarial participants we could find. During the empirical test, some of the user's attributes, such as their educational background and their experience with 3D visualization, are collected and analyzed. However, more focus is placed on visualization design rather than on users.
In order to achieve the third research objective, we identify the perceptual properties involved in each tested visual task and then synthesize the performance conclusion for each visual variable. Current theories and evaluation of visual variable's' perceptual properties in 2D visualization differ, and it may be impossible to tell which one is better since they are addressed from different aspects. As a result, this thesis compared the perceptual properties exhibited in the test with eight different research papers respectively, and six different theory frameworks are involved. General changes are spotted and synthesized at the end of this research together with the knowledge derived from the current research of information visualization and cognitive science.
1.6 Contributions of the work
The main contributions of this research include:
1. A 3D geo-visualization framework from an aspect of semiotics of graphics.
2. A list of visual tasks for delimitating property units in 3D cadastre visualization of condominiums that has been validated by notaries, for example, distinguishing the limits of property units from the associated physical limits of building construction in 3D visualization.
3. A statement about the suitability of eight visual variables (size, shape, brightness, saturation, hue, orientation, texture, and transparency) of the property units and three enhancement techniques (labeling, 3D object detaching and highlighting) in the context of 3D visualisation of condominium property units based on the usability specification for delimitating visual tasks. For example, brightness
13
only shows good suitability in helping users distinguish private and common units in the context of 3D visualization of condominium property units.
4. A statement about the differences, with respect to eight visual variables' perceptual properties, between 3D visualization of property units in condominiums and 2D visualization. For example, orientation is selective in 2D, yet it is not selective in the 3D visualization of property units in condominiums.
To complete this list of contributions, the outcomes of the thesis may also be recognised as foundation for further developments such as:
1. Designing a guide for best practices of 3D cadastral visualization.
2. Establishing methodological benchmark for empirical approach to test the suitability of visual variables and visual enhancement techniques in 3D cadastre model.
3. Improving current visualization theories in geo-visualization and cartography domains.
1.7 Thesis organization
This first chapter presented the research context, the problematic, research questions, research objective, and the methodology. Five chapters are afterward proposed:
Chapter 2: 3D Visualization: Concepts, Theories, and Challenges. This chapter gives a literature review of current visualization concepts and theories that are capable of being applied to the research in 3D geo-visualization. The concepts mentioned in chapter 1's introduction are further developed and precisely defined, for example, the terms "3D visualization" and "usability." In this chapter, we also present a 3D geo-visualization framework containing symbols and visual variables to support the literature review and discussion in the following chapters. This chapter also investigates the general challenges and current solutions of 3D geo-visualization in order to contribute background knowledge of 3D geo-visualization for further tests.
Chapter 3: 3D Visualization of Condominium Property Units: Data, Users, Usages, and 3D Cadastre Model Designs. First, this chapter examines the important terms used in cadastres and the inventory of cadastral data that cadastral visualization may contain in the condominium situation. Then, it discusses the users and their goals concerning visualization of condominium property units. Moreover, it reviews existing representation designs in 3D visualization adapted to the cadastral domain. The
14
aim of reviewing current designs is to yield knowledge about the suitability of visual variables and enhancement techniques in 3D cadastral visualization.
Chapter 4: Suitability of Visual Variables and Enhancement Techniques for 3D Visualization of Condominium Property Units. This chapter has two parts. The first part presents the assessment of the suitability of the visual variables and enhancements techniques while the second part compares the results with those from literature in 2D visualization. Regarding empirical tests, this chapter describes a preliminary evaluation of visual variables' feasibility in the research. Then, it describes the design, implementation, and results analysis of an empirical test of the suitability of visual variables in the form of face-to-face interviews with notaries. The comparison with 2D visualization starts with identifying the perceptual properties involved in the tested visual tasks. Such a comparison is carried out using seven current studies of visual variables in 2D visualization. In the end, this chapter discusses general conclusions about the suitability of visual variables and enhancement techniques in the 3D visualization of condominium property units and the influence of using the third dimension.
Chapter 5: Transparency for Delimitating Property Units with Physical Counterparts. This chapter describes the design, implementation, and results analysis of an empirical test of the suitability of transparency for demarcating legal and physical sections in condominiums in the form of an online questionnaire. The purpose of this test is to address the second research objective. For the result analysis, necessary statistical methods are used.
Chapter 6: Conclusion and Future Research. This chapter summarizes the process of this research, the main discovery, and its deficiencies considering the research questions and objectives. Then, it discusses the research results and contributions in a more general context of 3D geo-visualization, leading to the suggestion for future studies.
15
Chapter 2 - 3D Visualization: Concepts, Theories,
and Challenges
Several concepts of visualization, like usability and visual variables, were briefly discussed in Chapter 1 but must be precisely defined to enable the following discussion of this research. This is of particular importance for this work as there are diverse models and theories such as pipeline model (Haber & McNabb, 1990), semiotics of graphics (Bertin, 1973, 1983), and data state model (Chi, 2000). A wide spectrum of disciplines including cartography, information visualization, human-computer interaction, computer graphics, and cognitive science contains visualization studies. We do not pretend to present an extensive analysis of all current visualization theories, but only those applicable to this research, which is a special application of geo-visualization in 3D geospatial domain. This chapter only presents application independent knowledge, and the next chapter will go further into the application dependent knowledge of cadastre and of condominium property units.
2.1 Introduction to the general theory of visualization
Visualization is a process that expresses data through the interface of images, diagrams, and animations to allow user’s discovery, exploration, and visual analysis in order to acquiring insight of the data for particular purpose (Jones, 1996; Mcnamara, 2010; Tory & Möller, 2004). It has been used long in human history containing a huge amount of forms from characters and paintings to diagrams and scientific drawings. There is extensive research to explore the potential of visualization in a quite wide variety of topics like visual arts, computer graphics, information visualization, science visualization, cartography, and geo-visualization. There is no “correct” model for visualization. The visualization theory is always in accordance with the epistemological view of different disciplines and is designed for divergent purposes. Various models of visualization have been proposed by different researchers and groups to facilitate research in various domains under diverse topics, for example, semiotics of graphics (Bertin, 1983) for information visualization, Gestalt (Koffka, 1935) for perceptual science, and three-dimensional cartography model (Terribilini, 1999) for 3D geo-visualization. Voigt and Polowinski (2011) divided visualization research into seven different subfields including data, domain, graphical vocabulary, graphic representation, task and interaction, user, and system. They argued that many visualization theories only address a small subset of these fields. For example Tory and Möller (2004)’s user model in visualization discussed only the visual task and viewer’s interaction, and Chi (2000) proposed an influential data-state reference model centered on the data part. Here, this chapter defines the visualization theory that involves data, graphic, and viewer together to be a general theory. There are many general visualization theories. For example, in the domain of information visualization, Pfitzner, Hobbs, and Powers (2003) presented an information visualization taxonomy that includes data, task, interaction, user’s skill and operation context. Voigt and Polowinski (2011) proposed an ontology for the entire visualization process. In the domain of cartography,
16
Häberling (2005) defines the design process of a 3D map with three design aspects including modeling, symbolization, and usability tests with users.
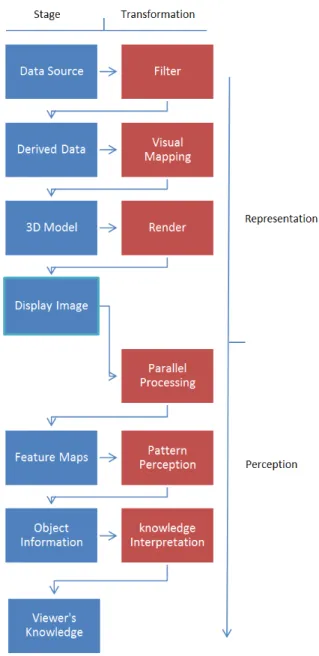
As a general theory, the pipeline model introduced by Haber and McNabb (1990) is a widely accepted epistemological interpretation of visualization process in current information visualization research (Voigt & Polowinski, 2011). This model interprets visualization as a series of transformation from data to display image. Many researchers (Card, Mackinlay, & Shneiderman, 1999; Chen & Jänicke, 2010; Malyanov, d’Auriol, & Lee, 2013) used pipeline model as the general visualization theory in their works with necessary extension including the human perception part like user’s profile, their visual tasks, and their interaction with computer interface. Pipeline model is in accordance with the cartography and geo-visualization related research, since they all view the visualization process as a series of transmission. As a result, it has also been adapted in geo-visualization domain, termed portrayal pipeline (Doyle & Cuthbert, 1998) or geo-visualization pipeline (Open Geospatial Consortium, 2010). The pipeline model helps to explain the role of semiotics of graphic and visual varaibles in the entire visualization process. Among various pipeline models, this chapter adapted that of Chen and Jänicke's work (2010), as their pipeline contains not only the process of visualization from data to display but also perception process from display to human knowledge. However, minor modifications are necessary since Chen and Jänicke’s pipeline model addresses visualization process from the aspect of signal transmission theory. Figure 2.1 shows the pipeline model of visualization where two groups of actions may be recognised: (1) the representation processes from data to display image and (2) the perception processes from display image to user's knowledge. In this figure, the different stages of visualization and perception are color blue while the transformation between stages is colored red.As visualization consists of converting the information to human knowledge through means of graphic representation, describing the procedure how the graphics created and how users perceive the graphics are both important. The visual design should consider the human sensory capabilities to ensure a quick and unambiguously perception of elements and patterns (Ware, 2012).
17
Figure 2.1. The pipeline model of visualization from data to viewer's knowledge, adjusted from Chen and Jänicke (2010)
In the representation part of the pipeline model, the data goes through transformation steps of filter, visual mapping, and rendering to the final display images. Graphic semiotics is carried out in visual mapping step. The display images are the end of representation process and the starting point where the viewer’s perception begins. In the perception part, the display image is perceived and interpreted in three transformation steps of parallel processing, pattern perception and knowledge interpretation into the final viewer’s knowledge (Treisman & Souther, 1985; Ware, 2012). The pipeline model is static; however, it is important to emphasize the dynamic and iterative nature of visualization and human perception. For human perception, pattern perception step could not process the entire scene at a glance. Instead, it is an iterative procedure consisted of a number of steps
18
(Milner & Goodale, 1995; Rensink, 2002; Ware, 2012). Answering a visual query may lead to several new visual queries in which other selections of objects are needed. On the other hand, the visualization process from data to display image is also becoming a dynamic process as state-of-the-art computer based visualization tools like Google Earth, Arcscene, and Blender enable user to interact with the visualization result and customize the visual mapping process to fulfill their visualization demands.
As a conceptual model, the pipeline model separates the 3D model with final visualization realization, and divides the visualization process from the human perception process. It only represents a static profile of the dynamic visualization and perception process. The pipeline or part of it will repeat and iterate until the visual purpose is fulfilled. It is a general description of the entire visualization process. Many detailed components concerning graphic semiotics process, like the data and design possibilities, are excluded. The user’s role in visualization process should also be demonstrate to support the following argument in this thesis, which involves direct user study. Thus, the following sections discuss the data, the user, and the design space in 3D geo-visualization.
2.2 Data in visualization
Data are the starting point of visualization process according to the pipeline model. Derived data is also the basis of the graphic semiotics. It is a critical factor for both viewers and computers that involved in the visualization process (Pfitzner et al., 2003). In addition, it is the starting point of several visualization research like the data state reference model (Chi, 2000) and data-centered theory (Purchase & Andrienko, 2008). Moreover, the interpretation of data pattern and structure is one of the essential goals of user's perception and analysis (Demiralp, Scheidegger, Kindlmann, Laidlaw, & Heer, 2014).
In geo-spatial domain, researchers tend to categorize data into spatial data and non-spatial data, as demonstrated by Longley, Goodchild, Maguire, & Rhind (2011) in their famous book “Geographic information systems and science”. Spatial data, which is the measurement of spatial variables (location, geometry shape and spatial relation) of the spatial object is the basis of many geo-visualization and cartography research like that of Schilling(2014) and Häberling, Bär, and Hurni (2008). Non-spatial data is either the attribute data of the spatial object, or the descripive data of spatial object, such as the lot number of a land parcel. For the non-spatial data, four scales of measurements proposed by Stevens (1946) have been used in geo-visualization research like Kraak & Ormeling (2011) and Slocum (2009) for assessment of visual variables. In addition, some of the studies in information visualization evaluate the visualization results considering the data scale, like Rogowitz, Treinish, and Bryson (1996), Lohse, Min, and Olson (1995), Ware (2012), and Borland and Taylor (2007). The four scales of measurements are:
19
Nominal data: The measurements of this data are differentiated by its qualitative classification or naming. Sometimes numeric measurement will be used to represent naming or classification. However, in this circumstance, they do not represent any quantitative meaning, any ordinal direction nor distance difference. For example, the nominal scale could be “Montreal”, “Toronto”, or “Quebec”. It could also be “0” or “1” which represent a Boolean measurement.
Ordinal data: The ordinal data are those data measurements that could be ranked but have unequal distance between them. For example, Likert scale (Likert, 1932) is widely used in user survey to measure subjective attitude. A typical Likert scale contains five degrees: Strongly disagree, disagree, neutral, agree and strongly agree. It is a formal way to rank the result; however, the distance between different levels could not be esteemed equal.
Interval data: They are those data measurements that could be ranked and the distance between them could be measured. For example, temperature data. However, any scale calculation is impossible for interval data because they do not have a true “zero” point. For example, 30 degree Celsius is not three times hotter than 10 degree Celsius.
Ratio data: Data with measurements that allow ranking, measurement of distance and with a true “zero” point. For example, angle, duration time and latitude.
Bertin (1981) proposed two fundamental characteristics of data: data value and data structure. We evaluate that Bertin’s proposal of two parts of data could further extend its data structure into data model for more structural and digitized expression. Data value is the real digit or string that stored like -3.4, 1, A+, or "Quebec". It could represent the real world phenomenon only in combination with a data model. Data model is a structural specification of a set of data and their relationship for representing parts of the real world in a digital system. It decides what data is collected, how these data is organized meaningfully to describe the reality, what their meanings are, and how they could be processed in a digital system. The same data value, for example, "2.0" could be interpreted as a measurement of temperature, an amount of money or a position over axis Z according to the underlying data model.
Both data model and data value are influential factors that a visualization research should consider. For example, 3-dimensional (3D) geospatial data model and 2-dimensional (2D) geospatial data model may require different visualization strategies. For data value, the range of data value, the amount of different measures and the value distribution are considered influential in visualization discussion. For example, each visual variable like color or size can represent three to five distinguishable values (Carpendale, 2003; Ware, 2012). When there are more values, the designer should either use multiple visual variables or add a numerical scale.
20
Besides data value and data model, there are many other data taxonomies. Shneiderman (1996) proposed a taxonomy with seven data types: 1-dimensional, 2-dimensional, 3-dimensional, temporal, multi-dimensional, tree and network. Roth and Mattis (1990) characterized data by data type and relational structure. Their theory contains three characteristics of data type: “Set ordering: nominal, ordinal and quantitative”, ”Coordinates versus Amounts”, “Domain of Membership”, and three properties of relational structure: coverage, cardinality and uniqueness. Ware (2012) evaluated that data could be categorized by the attributes of entities and their relationships. He proposed that the classification includes, but not limits to “Data Dimensions: 1D, 2D and 3D” and “Types of numbers: Nominal, Ordinal, Interval, and Ratio”. Viewed from the classification of data value and data model, the above-mentioned data taxonomies are mainly based on data model rather than data value, as they all concern the interpretation of data under certain data model. There are also data value based taxonomies. For example in the domain of the database, data is classified into integral data, decimal data, and string data.
2.3 User and User’s Visual Tasks
While data is the starting point of visualization, user is the ultimate receiver of the information that transformed by visualization process. It has been recognized as a critical factor in current research of cartography (Virrantaus, Fairbairn, & Kraak, 2009), geo-visualization (MacEachren & Kraak, 2001; Robinson, Chen, Lengerich, Meyer, & MacEachren, 2005) and information visualization (Plaisant, 2004). In an era of computerized visualization, user’s requirement, cognitive capabilities and preferences greatly influence the visualization design (Haklay, 2010). User research with empirical experiment is the key to access the visualization (Anderson, 2012). The capability, pros and cons of a visualization design could be exposed through user studies. Meanwhile, by user studies, the designer could understand more about users’ requirements, their perceptual capability, and how they interact with the display. Moreover, many existing elementary visualization knowledge and design principles of visualization are derived from the direct user research. For example, CIE 1931 XYZ color space is a reference color space adopted by International Commission on Illumination. It has been used directly or with transformation in the research of scientific visualization (Moreland, 2009) and cartography (Brewer, MacEachren, Pickle, & Herrmann, 1997). User experiments with a large number of participants are the basis of CIE 1931 XYZ color space’s creation (Guild, 1932; Wright, 2002).
Considering the importance of user in visualization, a few researchers advocated or employed a user-centered visualization design like Haeberling (1999); MacEachren and Kraak (2001); Shojaei, Kalantari, Bishop, Rajabifard and Aien (2013). The user-centered design is a doctrine that highlights user’s need and involves the intended user in the design process (Abras, Maloney-Krichmar, & Preece, 2004). It was proposed in the domain of human-computer interaction, but has also widely discussed in the research of information visualization (Chen, 2005; Koh, Slingsby, Dykes, & Kam, 2011) and cartography (Elias & Paelke, 2008; Tsou, 2011). For a system easy to learn, useful and pleasant to use, Gould and Lewis (1985) recommended three implementation
21
principles, which have then been evaluated essential for user-centered design (Wallach & Scholz, 2012). The three principles are:
Early focus on users and tasks: designers should understand user’s cognitive capabilities, its knowledge background, its decision-making goals and visual tasks at very early stages in a design process.
Empirical measurement: the evaluation of visualization design will be based on observation, register and analysis of intended users’ objective performance with the design and their subjective opinions. Iterative Design: the design will be a cycle process in which the visualization designs and the
understanding of intended user will improve through multiple tests with the user, analysis of results, and re-design.
A user model is the collective information of a particular user or user group that can be used to adjust the system(Domik & Gutkauf, 1994; Van Velsen et al., 2008). It contains attributes that differentiate the user for specific purpose, like the user identification and domain for Windows login, the address and payment information for an online shopping site, and the gender, age, weight for a medical survey. In the visualization research, there are multiple influential factors in user model including user's discipline, their socio-demographic attributes, their physical and psychological situation, and their visual tasks (Domik & Gutkauf, 1994; Schulz, Nocke, Heitzler, & Schumann, 2013).
Many researchers divided users by their disciplines like Shojaei et al. (2013) and Schulz, Hadlak and Schumann (2011). It is reasonable to argue that users from different disciplines may use visualization system for different purposes. For example, surveyors may use cadastre visualization for survey related tasks and government employees use it for the tax calculation purpose. Users from the same domain may also differ in their knowledge, experience, socio-demographic attributes, and physical, psychological situation. These attributes may also influence their effectiveness and preference when using a visualization design. Domik and Gutkauf (1994) listed a few user’s socio-demographic attributes and psychological situation that could affect their perception including gender, age, color perception, color memory, and fine motor coordination. Brewer, MacEachren, Pickle, and Herrmann (1997) emphasized that cartographic design aiming for general public should consider the user with color perception deficiencies, as statistically 8 percent of males and 0.4 percent of females have color perception deficiencies (Wyszecki & Stiles, 1982).
User’s visual tasks are the goals and perceptual activities that a user tried to achieve with the visualization display. A list of intended users’ visual tasks is the basis of centered visualization design according to