COBAFISH
E. VERHEYEN, W. WILLEMS, K. MARTENS, A.V. BORGES, F. DARCHAMBEAU,T.LAMBERT,J.-P.DESCY,S.PETROVIC,S.BOUILLON,C. TEODORU,D.X.SOTO,C.COCQUYT,J.C.TAYLOR,J.SNOEKS,E.DECRU, J.BAMPS,T.MOELANTS,L.ANDRÉ
Atmosphere and terrestrial and marine ecosystems
Promotors
Erik Verheyen, Royal Belgian Institute of Natural Sciences Alberto V. Borges, University of Liège
Steven Bouillon, KU Leuven
Christine Cocquyt, Botanic Garden Meise Jos Snoeks, Royal Museum for Central Africa
Authors
Erik Verheyen, Royal Belgian Institute of Natural Sciences Wim Willems, Royal Belgian Institute of Natural Sciences Koen Martens, Royal Belgian Institute of Natural Sciences
Alberto V. Borges, University of Liège François Darchambeau, University of Liège
Thibault Lambert, University of Liège Jean-Pierre Descy, University of Liège
Sandro Petrovic, University of Liège Steven Bouillon, KU Leuven Cristian Teodoru, KU Leuven
David X. Soto, KU Leuven
Christine Cocquyt, Botanic Garden Meise Jonathan C. Taylor, Botanic Garden Meise Jos Snoeks, Royal Museum for Central Africa
Eva Decru, Royal Museum for Central Africa
Jolien Bamps, Royal Museum for Central Africa and Royal Belgian Institute of Natural Sciences
Tuur Moelants, Royal Museum for Central Africa Luc André, Royal Museum for Central Africa
(SSD)
FINAL REPORT
Congo basin: From carbon to fishes COBAFISH
Published in 2017 by the Belgian Science Policy Avenue Louise 231 Louizalaan 231 B-1050 Brussels Belgium Tel: +32 (0)2 238 34 11 – Fax: +32 (0)2 230 59 12 http://www.belspo.be
Contact person: Georges Jamart +32 (0)2 238 36 90
Neither the Belgian Science Policy nor any person acting on behalf of the Belgian Science Policy is responsible for the use which might be made of the following information. The authors are responsible for the content.
No part of this publication may be reproduced, stored in a retrieval system, or transmitted in any form or by any means, electronic, mechanical, photocopying, recording, or otherwise, without indicating the reference:
E. Verheyen, W. Willems, K. Martens, A.V. Borges, F. Darchambeau, T. Lambert, J.-P. Descy, S. Petrovic, S. Bouillon, C. Teodoru, D.X. Soto, C. Cocquyt, J.C .Taylor, J. Snoeks, E. Decru, J. Bamps, T. Moelants, L. André. Congo basin: From carbon to fishes
COBAFISH. Final Report. Brussels : Belgian Science Policy 2017 – 85 p. (Research
COORDINATOR:
P1. Erik Verheyen, Royal Belgian Institute of Natural Sciences, Operational Direction Taxonomy and Phylogeny – Vertebrates, Vautierstraat 29, 1000 Brussels, Belgium,
erik.verheyen@naturalsciences.be OTHER PARTNERS:
- P2. Alberto Borges, Université de Liège, Chemical Oceanography Unit, Institut de Physique (B5a), B-4000 Liège, alberto.borges@ulg.ac.be
- P3. Steven Bouillon, KU Leuven, Department of Earth and Environmental Sciences, Celestijnenlaan 200E, B-3001 Leuven, steven.bouillon@ees.kuleuven.be
- P4. Christine Cocquyt, Botanic Garden Meise,
christine.cocquyt@botanicgardenmeise.be
- P5. Jos Snoeks, Koninklijk Museum voor Midden-Africa, Unit Vertebrates,Tervuren,
jos.snoeks@africamuseum.be AUTHOR(S):
E. Verheyen1, W. Willems1, K. Martens1, A.V. Borges2, F. Darchambeau2, T. Lambert2, J.-P. Descy2, S. Petrovic2, S. Bouillon3, C. Teodoru3, D.X. Soto3, C. Cocquyt4, J. Taylor4, J. Snoeks5, E. Decru5, J., Bamps5, T. Moelants5, L. André5
Numbers in superscript refer to partner institution (1: Coordinator, 2: Partner 2, etc)
TABLE OF CONTENT SUMMARY ... 7 1. INTRODUCTION ... 11 1.1 Context ... 11 1.2 Objectives... 11 1.3 Expected outcomes ... 12
2. METHODOLOGY AND RESULTS ... 13
2.1 Scientific methodology ... 13
2.2 Results ... 18
3. POLICY SUPPORT ... 67
4. DISSEMINATION AND VALORISATION ... 69
5. PUBLICATIONS ... 71
6. Acknowledgements ... 79
7. References ... 81
ACRONYMS and ABREVIATIONS BBPf: Belgian Biodiversity Platform bSiO2: biogenic silica
C: carbon
cDOM: chromophoric dissolved organic matter CH4: methane
CHEMTAX: program for estimating class abundances from chemical markers CO2: carbon dioxide
CSB: Centre de Surveillance de Biodiversité DGCD: Belgian Development Cooperation DIC: dissolved inorganic carbon
DNA: Deoxyribonucleic acid
DOC: dissolved organic carbon (concentrations expressed in mg L-1) DOM: dissolved organic matter
DSi: dissolved silicon
EA-IRMS: elemental analyzer – isotope ratio mass spectrometry FAO: Food and Agriculture Organization
FCH4: CH4 flux across the air-water interface
FCO2: CO2 flux across the air-water interface fDOM: fluorescent dissolved organic matter GHG’s: greenhouse gases
HPLC: High Performance Liquid Chromatography
IUCN: International Union for the Conservation of Nature JRC: Joint Research Centre
k: gas transfer velocity
LM: light microscope MAB: Man And Biosphere
MOB: methane-oxidizing bacteria N: Nitrogen
N2O: Nitrous oxide
O2: Oxygen
pCO2: partial pressure of CO2
POC: particulate organic carbon (concentrations expressed in mg L-1) R: pelagic community respiration
SEM: scanning electron microscope Si: silicon
SUVA254: specific ultraviolet absorbance of DOM at 254 nm, positively correlated with
the degree of aromaticity of DOM.
SR: Spectral ratio. Inversely correlated with the average molecular weight of DOM.
TA: total alkalinity (in mmol kg-1)
TSM: total suspended matter concentration (in mg L-1) WWF: World Wide Fund for Nature
δ13C
DOC: stable carbon isotopic composition of DOC, used as a tracer of DOM
sources.
ΔCH4: air-water gradient of CH4 ΔCO2: air-water gradient of CO2
SUMMARY
Context
The Congo River harbours the richest known fish species diversity on the African continent. Its fish fauna also represents a major source of proteins for the riparian human population. Despite of this, the ecology, dynamics and ecosystem functioning of the Congo River remain poorly understood.
The overall goal of the COBAFISH project is to link terrestrial inputs, primary producers (algae and aquatic macrophytes), macro-invertebrate and fish biodiversity to ecosystem dynamics and functioning in the Congo River in order to delineate factors that drive species and trophic biodiversity of fishes.
Objectives
To achieve this overall goal, COBAFISH addresses four key questions:
(1) How diverse are fish communities in two sub-catchments of the Congo River (Lobilo and Lomami) in terms of biodiversity and functional/trophic diversity? (2) Which factors can be identified in regulating this diversity?
(3) To which extent do fish communities in these river systems depend on autochtonous (aquatic) primary production or on lateral allochtonous (terrestrial) production?
(4) What is the importance of seasonal flood events on global ecosystem functioning?
Main conclusions
Three extensive field campaigns were carried out (December 2012, September 2013, and March 2014). Three areas were thoroughly sampled for aquatic biogeochemistry, fish, aquatic macro-invertebrates and diatoms. Samples taken in the Lobilo River, which drains water from the UNESCO Man and Biosphere (MAB) Yangambi Reserve, represent the near-pristine condition, whereas the samples collected in the Lower Lomami River represents a human impacted area with different land-use patterns and vegetation. This allowed us to sample in stream water with different characteristics according to the features of the surrounding area/vegetation/land use.
Primary production and phytoplankton biomass were highest in the Congo River maintream, and negligible in black water streams such as the Lobilo. Green algae (both chlorophytes and streptophytes) dominated in the mainstem in high waters, whereas diatoms dominated in falling waters; cryptophytes and cyanobacteria were more abundant but still relatively low in the falling water period, both in the tributaries and in the main channel. Phytoplankton biomass and production was higher than previously reported in tropical river channels, and net phytoplankton growth occurred in the Congo River mainstem, whereas in other tropical rivers phytoplankton production mainly takes place in the floodplain lakes. This is due to generally low total suspended matter (TSM) values in the Congo and the relative shallowness of river channels that allows net phytoplankton production in the mainstem unlike in other deeper and more turbid tropical rivers such as the
Amazon. Pelagic community respiration (R) was overwhelmingly higher than primary production indicating a net heterotrophic status that is fuelled by allochthonous carbon inputs from terrestrial or wetland origin. Indeed, dissolved organic matter (DOM) in the Congo River and its tributaries mainly originates from terrestrial sources. A greater phytoplanktonic development was observed during low flow periods in the mainstem Congo River, but without any effect on the concentration and the composition of DOM. This can be related to the fact that phytoplankton exudates are very labile and rapidly assimilated by bacteria as shown in tropical lake waters such as Kivu (refer to results from the BELSPO EAGLES project). The data presented here strongly suggest that the autochthonous production is very limited and/or is not enough to significantly contribute to the DOM pool. Yet, CO2 emissions
to the atmosphere in three COBAFISH study sites and elshewhere in the Congo basin were higher up to an order of magnitude than R. This indicates that the dissolved CO2 is laterally imported either from soils or wetlands. Within the Congo
and across 12 African rivers dissolved CO2 and CH4 concentrations correlated to
wetland coverage in the catchement, suggesting that the lateral inputs from wetlands are as important (if not more) that terrestrial soils. Indeed, hydrological connectivity is much higher in wetlands than non-flooded uplands where the CO2 from soil
respiration is usually released to unsaturated soil horizons and can be directly emitted back to the atmosphere and not be transported laterally into rivers. Finally, the comparison of the Congo and the Amazon reveals that CO2 levels are similar in
the river channels but CH4 concentrations are three to four times higher in the river
channel of the Congo than in the Amazon. This seems to be related to differences in seasonal water level changes that are lower in the Congo than in the Amazon, allowing the development of extensive and permanent floating macrophyte meadows along the mainstem and major tributaries that promote the transfer of CH4 directly to
river channels. Floating macrophytes in the Amazon are present in the floodplains but not along the river banks due to stronger currents and higher depths.
The total number of fish species found was 132. Lomami harboured a slightly higher number of species (81) than the other two rivers. The Lobilo clearly had the highest number of unique species (31) more than double the number in the two other systems, hence illustrating its special character, that also showed in the physio-chemical parameters. For most fish groups, taxonomic problems were encountered, which illustrates the poor knowledge of the ichthyofauna of the Congo basin. Some of these were tackled during the project. A revision of the Distichodus antonii assemblage, resulted in the removal of one species from the list of Congo species and the discovery of two new species. For this group and for the genus Citharinus new identification keys were compiled. Another illustration of the poor knowledge of the fish fauna of the region studied is the relatively low identification success compared to other barcoding studies, as a result of many discrepancies between morphology-based species identifications and the different lineages recognized by this molecular technique. In addition, clear indications were found for the presence of cryptic species and hybridization events in the area.
One of the most interesting results of the combination of morphological and molecular techniques was found in Enteromius. In this genus of small carp-like fishes, 23 genetic lineages (COI, mtDNA) were found within four species as identified based on the literature available. Subsequent morphological analyses revealed most lineages to be also morphologically different, suggesting they might represent distinct species, almost all new to science.
No indication was found for genetic population structuring for the fishes in the three systems. Multivariate analyses of fish occurrence data confirmed the separation of the Lobilo from the two other systems, but also differences in species composition between the three expeditions became apparent. In a preliminary analysis with a forward selection procedure, pH and temperature came out as important variables with uncorrelated contributions to fish distribution.
The general picture resulting from the stomach analyses is that of a dominance of omnivorous species in all rivers, followed by invertivores, illustrating again the mainly generalist character of the fish fauna of the region. However, one of the main findings is that the majority of the species in some way are dependent on the terrestrial environment for food. Indeed, 61% of fishes representing 37% of species had eaten prey of terrestrial origin.
Analysis of the aquatic foodweb using both gut content analyses and stable isotope analyses allows us to conclude that (i) terrestrial invertebrates comprise a surprisingly large contribution to the diet of many fish species, highlighting the importance of riparian vegetation and habitats not only as a refuge but also to provide access to terrestrial food sources, and (ii) despite the low aquatic primary productivity, the isotope data indicate a wide diversity of food sources can contribute and suggest that at least part of the fish community is specialized towards certain basal food sources. A significant number of invertebrate and fish samples show particularly low δ13
C signatures, which we currently hypothesize to reflect a contribution of methane-derived carbon via methanotrophic bacteria.
Finally, the environmental monitoring data obtained from two stations near Kisangani (one located on the mainstem Congo River, one on the Tshopo River) at two-weekly intervals is ongoing and will be continued outside of the COBAFISH project through an agreement with the CSB/ University of Kisangani. This forms an important longer-term commitment and is leading to an unpredecentedly large dataset on riverine biogeochemistry in this part of the world, currently covering 4 full years of data acquisition.
Output for sustainable development
Present day total anthropogenic CO2 emissions are estimated at 9.4 PgC
(1015 gC) yr-1, part of which accumulates in the atmosphere at a rate of 4.2 PgC yr-1, while oceans and land equally absorb ~2.6 PgC yr-1. This terrestrial sink of anthropogenic CO2 motivated the United Nations‟ “Reducing Emissions from
Deforestation and forest Degradation” (REDD) program, which aims at mitigating climate change through reducing emissions of greenhouse gases (GHGs) and removing GHGs through enhanced forest management in developing countries. The latter is of particular relevance for Sub-Saharan African countries, which host significant tropical rain forest cover. Our estimates of CO2 and CH4 emissions from
rivers in Central Africa and in the Congo show that the emissions of these GHGs from inland waters strongly offset the terrestrial carbon sink. We recommend that emissions from rivers are better quantified in a systematic fashion for a thorough accounting to the United Nations Framework Convention on Climate Change (UNFCCC) in the frame of the national inventory reports and in the frame of REDD. For the particular case of Congo, our data acquired in the chosen three sites in COBAFISH do not encompass the full range of aquatic biogeochemistry and in particular GHG emissions, hence, we also recommend large scale basin wide quantification of GHG emissions from inland waters (rivers and lakes).
Gut content analysis indicates that most of the fish have food sources from riparian vegetation. We recommend in case of forest clearing for land usage that a riparian vegetation fringe is accommodated to maintain food sources for fish and for sustainable fisheries management.
Keywords
Congo basin, Congo River, fish ecology, biodiversity, foodwebs, diatoms, biogeochemistry, greenhouse gases, fisheries.
1. INTRODUCTION
1.1 Context
The COBAFISH project aims to yield a better understanding of interactions between biodiversity and the functioning of the Congo River ecosystem, which is the basis for future studies on ecosystem services in the context of environmental and climate change. Moreover, the obtained results are intended to result in baseline data that will enable future studies on the impact of human-induced changes (including climate changes) on loss of biodiversity and related ecosystem services.
The overall objective of COBAFISH is to contribute to the description of the biodiversity and functional/trophic diversity of fish communities in the Congo River and to investigate the factors that structure fish biodiversity. To achieve these goals, the project builds on recent and past data series gathered in the field, on fish collections mainly from the late1940s and early 1950s in the Lobilo River and more recent observations made in the Lomami River during two expeditions (2009 & 2010) carried out by the project team in the context of the Congo2010 project.
Fishes represent one of the major protein sources for riparian human populations in the Congo River basin. COBAFISH puts the participating Belgian researchers in a unique position to investigate the second largest river system in the world. Because the international scientific community is extremely interested to initiate research projects on the Congo River, this project would provide a basis on which partners involved in this project could claim a leading role should research initiatives at European and international levels be launched. This would in particular be the case for calls on cooperation and development with African countries that might arise in the European Commission Seventh Framework Program, for instance in relation to Observatory for Sustainable Development and Environment of the Joint Research Centre (JRC), or in the frame of the „Millennium Development Goals‟, more specifically „Food Security Targets‟ of the EU-AFRICA Strategic Partnership.
To achieve the operational objectives, we organized three field campaigns to acquire new data on several aspects such as limnology, biogeochemistry, biology and ecology.
Knowledge and instruments (databases) developed by COBAFISH will allow to help local decision makers and policy makers at regional (ICCN) and international (IUCN & FAO) to develop science-based management strategies towards the sustainable exploitation of fish stocks in the Congo River basin.
1.2 Objectives
The four main operational objectives of COBAFISH are:
(1) Evaluating the diversity of fish communities (biodiversity, taxonomic diversity and functional/trophic diversity) in two sub-catchments of the Congo River (Lobilo and Lomami). Our working hypothesis is that diversity of fish communities will be different in these two sub-catchments, based on a limited preliminary data-set.
(2) Identifying the factors that regulate this diversity. Our working hypothesis is that the possible regulating factors are: i) availability and origin of organic matter; ii) environmental physical and chemical conditions.
(3) Determining to which extent fish communities in these river systems depend on autochthonous (aquatic) primary production or on lateral allochthonous (terrestrial) production.
(4) Determining the importance of seasonal flood events on ecosystem functioning. Our working hypothesis is that sources of carbon that flow through the food-web up to higher trophic levels change seasonally.
1.3 Expected outcomes
WP 1: Carbon sources, cycling and aquatic metabolism
D.1. Data-set, analysis and synthesis of carbon stocks and isotopic signatures in the terrestrial littoral, the water column and in the sediments
D.2. Data-set, analysis and synthesis of aquatic metabolic rates
D.3. Data-set, analysis and synthesis of dissolved and biogenic silica isotopes
WP 2: Aquatic floral and faunal diversity
D.4. Data-set, analysis and synthesis of phytoplankton taxonomic composition D.6. Inventory of macro-invertebrate communities biodiversity (collections) D.7. Inventory of ichthyofauna biodiversity (collections)
D.8. Inventory of ichthyofauna biodiversity (DNA barcoding)
D.9. Ichthyofauna diversity Indices (identification tools and conservation)
WP 3: Ecosystem trophic structure (foodweb analysis)
D.10. Evaluation of aquatic food web structure
D.11. Evaluation of the support for faunal communities (allochtonous versus autochthonous)
WP 4: network integration and coordination
2. METHODOLOGY AND RESULTS
2.1 Scientific methodology
WP 1: Carbon sources, cycling and aquatic metabolism
Task 1.1: Relative contributions of allochthonous and autochthonous production to aquatic C reservoirs (KUL, ULg)
The periodic monitoring program at Kisangani of several biogeochemical variables in the Congo River and in one of its tributaries, the Tshopo, started in December 2012, and is on-going at two-weekly intervals. Partners 2 and 3 have committed to continuing this monitoring in collaboration with CSB-UNIKIS in an effort to provide a long-term dataset on riverine geochemistry for this section of the Congo River basin. The monitoring involves the characterization of biogeochemical variables by quantitative measurements of different carbon reservoirs (sediment organic C, particulate and dissolved organic carbon (POC, DOC) in the water column), by fluorescence signals from the different components of the dissolved organic matter (cDOM and DOM excitation-emission fluorescence matrix), and by stable isotope measurements on both dissolved inorganic carbon (DIC), POC and DOC. In addition, stable O and H isotope measurements are conducted on these water samples as well as on monthly precipitation samples (rain gauge installed at the UNIKIS campus in 2013), in collaboration with the International Atomic Energy Agency (Vienna); the resulting data are part of the GNIR and GNIP networks (Global Network for Isotopes in Rivers and Precipitation, respectively), and publically accessible.
To characterize the terrestrial end-member, samples of surface soils and litter were collected, and aquatic macrophytes and periphyton were sampled where present. The information base gathered here provides a critical contribution to the work on foodweb structure and resource used by fish communities (Task 3.2), and is highly complementary to the work on aquatic primary production and net community metabolism (Task 1.2). A recently started Marie Curie postdoctoral project (AQUAHYDRO) will process COBAFISH foodweb samples to explore the use of hydrogen stable isotope ratios in further distinguishing terrestrial versus aquatic contributions to the aquatic foodweb.
Finally, data from geographical information systems (GIS) on land-use, soils and vegetation (Global Land Cover 2000 database of Africa, Woods Hole Research Center pantropical national level carbon stock dataset, Global Lakes and Wetlands Database, Global Lithological Map, Soil Map of Africa), as well as meteorological (WorldClim – Global Climate Data) and morphological (HYDRO1K global hydrologic data set) data were linked to field-based data riverine physical and -chemical variables, organic matter composition and processing in a representative range of smaller-scale sub-basins with a more uniform vegetation and land-use. These datasets allow us to delineate sub-catchments and correlate their characteristics with biogeochemical data in the aquatic system.
Task 1.2: Aquatic primary production, respiration, and net community metabolism (ULg, KUL)
In order to determine the fate of autochthonous carbon inputs, the level of allochthonous production, the net community metabolism, and the impact of the latter
on the exchange of CO2 with the atmosphere, we carried out a series of process rate
measurements:
Net plankton primary production based on short-term (2h) deliberate 13C-tracer experiments at various light intensities; plankton community respiration based on short-term (24h) dark consumption O2 incubations; exchange of CO2 between
surface waters and the atmosphere. The latter was also compared to the exchange of CH4 that usually has lower exchange rates than CO2 but much higher global
warming potentials (Denman et al. 2007).
These process rates are compared to the isotopic Si mass balances (as proxy of diatom production, cf. Task 1.3) and interpreted with ancillary measurements of ecological and biogeochemical variables such as water discharge, light availability (water transparency and total suspended matter (TSM) concentration), inorganic nutrient (nitrate, nitrite, ammonia, phosphate, silicate) concentrations, POC and DOC concentrations, fluorescence and isotopic signatures (Task 1.1), bacterial community composition (flow cytometry), phytoplankton community composition (Task 2.1), O2
levels and CO2 concentrations.
Data acquired in the frame of COBAFISH were integrated to other data-sets acquired in the Congo river mainly from the Congo2010 expedition and the three cruises from a FNRS funded project (TransCongo) for a larger description at the scale of the basin. Similarly, the Congo data were put into perspective with a joint analysis across 12 Sub-Saharan bassins mainly acquired in the frame of ERC StG AFRIVAL (involing partners 3 and 2), as well as with a comparison with data from the Amazon acquired by Gwenaël Abril (University of Bordeaux) who served in the Follow-up Committee of COBAFISH.
Task: 1.3: Identification of Si sources as nutrients and the contribution of diatoms to primary production (MRAC, NBGB)
This task aimed at assessing the sources and the seasonality of Si and at quantifying the seasonal diatom production in the watershed. Due to recurrent technical issues with the new mass spectrometer installed at the ULB, all samples collected during these fieldtrips still await further analyses (Task 1.2).
WP 2: Aquatic floral and faunal diversity
Task 2.1: Qualitative and quantitative diversity of aquatic primary producers (ULg, NBGB)
Abundance and diversity of the phytoplankton assemblage were evaluated by a combination of microscope observations and pigment analyses. Variations in abundance of phytoplankton taxa were studied in relation to the abiotic parameters (e.g. light availability, residence time andnutrient levels, Task 1.2).
The analysis of marker pigments by high performance liquid chromatography (HPLC) was used to determine the taxonomic composition of the phytoplankton assemblage at the class level using the CHEMTAX software (e.g. Descy et al. 2005). This approach allowed screening numerous samples, which will be complemented by microscopic analyses for determining composition at lower taxonomic level (species or genus). The approach combining marker pigment analysis and identification of the main phytoplankton taxa (Sarmento & Descy, 2008) allowed to identify functional groups (Reynolds et al., 2002) closely related to environmental factors such as light, nutrient supply, environmental variability, …). Bulk periphyton samples collected from
different substrates were also analysed by the same technique, allowing a global assessment of the algal flora (including cyanobacteria).
The dominant diatom species in the phytoplankton and benthos have been identified and enumerated on a semi quantitative basis. Phytoplankton samples were collected with a plankton-net (10 µm mesh size); epiphytic samples were collected from submerged parts of aquatic plants; epipsammic and benthic samples were collected from the bottom of the rivers and streams. After cleaning with peroxide; the material was mounted in Naphrax ® (RI: 1.71). The obtained permanent microscopic slides were studied using an Olympus BX51 light microscope equipped with differential interference contrast. Additional observations with a scanning electron microcopy were undertaken for taxonomical purposes. All diatom taxa have been determined up to genus level. Identification up to species level is problematic as no literature is available for the Lomami and Lobilo watershed and is even limited for D.R. Congo. Many species are unknown to science or resemble existing taxa needing in-depth investigation.
Task 2.2: Trophic diversity of macro-invertebrate communities (RBINS)
We established biodiversity, densities and biomass of macro-invertebrate communities in the stations where fish community structure were evaluated. Macro-invertebrates were at the taxonomic level required for their classification into Functional Feeding Groups (FFGs). The trophic niche of representatives of the different macro-invertebrate FFGs was established by stable isotope analysis (see Task 3.2). Furthermore, fish stomachs of selected fish species were analyzed and compared with standing densities/biomass of various macro-invertebrate FFG‟s/ taxa collected in the field.
The obtained stable isotope data link the macro-invertebrates to lower trophic levels, while the diversity/ density/ biomass assessments are used to describe extant levels available to fish, and the fish stomach analyses were used to link the macro-invertebrates to the higher trophic levels (see Task 3.1).
Replicate samples for macro invertebrates were taken near the points of standardized fish sampling: CPUE (catch per unit effort) samples were taken with a hand net in vegetation, grab samples (PONAR) for meiobenthos and larger molluscs, standardized transects along nearby shorelines were carried out.
Task 2.3: Qualitative and quantitative diversity of fish communities (RMCA, RBINS)
2.3.a. Fish sampling, morphology based identifications (RMCA)
During the project, two food web stations on the Lobilo River situated in the Yangambi Biosphere Reserve and two food web stations on the Lower Lomami River were intensively sampled for fishes. For this, we used standardized gill net sampling with monofilament gill nets (8, 10, 12, 15, 20, 25 and 30 mm mesh size k.t.k.) from 17h to 06h on each of the selected sampling points.
Additional sampling with fykes, dip nets and purchase from local fishermen was included for the fish biodiversity survey. A representative sample of all species collected at each of the sampling stations was preserved in 10% formalin. Stomachs of the most abundant species and species with the highest biomass were injected with 10% formalin to be available for possible stomach content analysis. Fin-clips were taken of all sampled species with a representative of at least two specimens of each species for each sampling point for DNA-analysis and COI barcoding. A
detailed set of limnological, biogeochemical and ecological variables will also be collected at each of the sampling points (see WP1).
Correct identification of fish species is of prime importance for the fish biodiversity section of the research project. Species for which no identification keys are available were compared with type- and other specimens housed at the RMCA. For specific taxonomic cases, analysis of morphological data with multivariate [Principal Component Analysis (PCA)] as well as univariate (Mann-Whitney U test) methods were used (see Snoeks 2004).
2.3.b. Use of DNA barcodes to facilitate species separation for cryptic species (RBINS)
During the sampling fin clips were taken from all different species. DNA was extracted and sequenced to barcode those species. More reliable and faster species identifications because of link between specimen and sequences will be made available to (1) Fish Barcode of Life Initiative FISHBOL (http://www.fishbol.org/), (2) fish specimen and sequence data are ready to be entered in the
http://jemu.myspecies.info/dna-barcoding-selected-congolese-vertebrates website initiated to disseminate biodiversity data to stakeholders, with the possibility to identify species on the basis of mitochondrial DNA sequences against EMBL and/or the specimen collection of the RBINS and the RMCA; and (3) a web portal that was developed by the Belgian Biodiversity Platform to make all biodiversity, biogeochemical and cartographical gathered during the Congo2010 expedition available for the international scientific community.
WP 3: Ecosystem trophic structure (food web analysis)
A general assessment of the primary producer community was made to assess the relative biomass of micro- and macrophytes in the rivers systems.
Data on presence and abundance of microphytes and macrophytes in the fish diet was inferred from stomach content analyses, and isotope signature of the micro- and macroflora that complement these data. The trophic information gathered by the density study of the macro-invertebrate communities (Task 2.2) allowed to quantify the relative importance of the various functional feeding groups (FFG‟s).
Macro-invertebrate specimens were classified into scrapers/grazers, consuming algae and associated material; shredders, consuming leaf litter or other CPOM (Coarse Particulate Organic Matter), including wood; collector-gatherers, collecting FPOM (Fine Particulate Organic Matter) from the stream bottom; collector-filterers, which collect FPOM from the water column using a variety of filters; and predators, which feed on other consumers (Naiman and Bilby, 2001, Monakov 2003). A potential sixth category, other, includes omnivores, or simply do not fit into the other categories. This approach allowed us to determine the origin of carbon and nutrients within the macro-invertebrate trophic levels. Isotope analyses were carried out on selected macro-invertebrate specimens (see Task 3.2).
Due to its importance for resolving trophic links and origin of food for fishes, a specific task was entirely dedicated to fish gut content analyses (Task 3.1). The isotopic signature of the various components of the food web (terrestrial litter, aquatic macrophytes, phytoplankton, epiphytic algae, macro-invertebrate consumers classified into FFG‟s and main fish species) gained from Task 3.2 allows depicting and evaluating the importance of the various trophic links between components. Isotopic data coupled with in situ estimates of primary producers (Task 1.2), macro-invertebrate functional feeding groups (Task 2.2), fish gut contents (Task 3.1), and
indirect methods for estimating consumer production were used in a foodweb analysis for both tributaries of the Congo River.
Task 3.1: Fish stomach content analysis (RMCA, RBINS, NBGB)
The stomach of the fishes of the third expedition from which a sample for stable isotopes was taken was injected with formaldehyde to ensure that the stomach content was preserved. In the lab, the stomach was removed and the content was divided in different prey categories.
Task 3.2: Stable isotope-based foodweb analysis (KUL)
Sampling for isotope studies of trophic structure included analyses of δ13C and δ15
N signatures of potential organic matter sources (see Task 1.1.), as well as combined δ13C and δ15N analyses on invertebrates and fish fauna. For the latter, a representative set of fish species were selected (see Task 2.3) whereby multiple specimens from each selected species (to the extent possible) were analysed in order to asses intra-population variations. Within the framework of a recently project, (a subset of) COBAFISH samples are also being analysed for δ2
2.2 Results
WP 1: Carbon sources, cycling and aquatic metabolism
Fig 1: (a) Map of the Congo Basin showing the drainage area of the river studied in this project. (b) Zoom on the stations sampled during the different COBAFISH cruises.
22 23 24 25 26 27
Congo Lomami Lobilo
Water temperature ( C) 0 10 20 30 40 50 60
Congo Lomami Lobilo
Specific conductivity (µS cm-1) 0.00 0.10 0.20 0.30 0.40
Congo Lomami Lobilo
Total Alkalinity (mM) 0 20 40 60 80 100
Congo Lomami Lobilo
Ca2+ (µM) 0 40 80 120 160 200
Congo Lomami Lobilo
Na+ (µM) 0 50 100 150 200 250
Congo Lomami Lobilo
DSi (µM) 0 10 20 30 40 50 60
Congo Lomami Lobilo
K+ (µM) 0 4 8 12 16 20
Congo Lomami Lobilo
NO3-(µM) 0.0 2.0 4.0 6.0 8.0
Congo Lomami Lobilo
O2(mg L-1) 0.0 2.0 4.0 6.0 8.0
Congo Lomami Lobilo
pH 0 1,000 2,000 3,000 4,000 5,000 6,000
Congo Lomami Lobilo
pCO2(ppm) 0 200 400 600 800
Congo Lomami Lobilo
CH4(nM)
9.0 9.5 10.0
Congo Lomami Lobilo
N2O (nM) 0.0 0.5 1.0 1.5 2.0
Congo Lomami Lobilo
Sechi depth (m) 0 10 20 30 40 50 60
Congo Lomami Lobilo
TSM (mg L-1) 0.0 1.0 2.0 3.0 4.0
Congo Lomami Lobilo
POC (mg L-1) 0 5 10 15 20 25 30
Congo Lomami Lobilo
%POC (%) 0 2 4 6 8 10 12
Congo Lomami Lobilo
DOC (mg L-1) 0 10 20 30 40 50
Congo Lomami Lobilo
a(350) 0.0 0.2 0.4 0.6 0.8 1.0 1.2
Congo Lomami Lobilo
Chl-a (µg L-1) 0 5 10 15 20 25 30
Congo Lomami Lobilo
BSi (µM) 0 50 100 150 200 250
Congo Lomami Lobilo
primary production (mg m-2d-1) 0.0 1.0 2.0 3.0 4.0 5.0 6.0 7.0 8.0 9.0
Congo Lomami Lobilo
O2consumption (µM d-1) 0.E+00 1.E+05 2.E+05 3.E+05 4.E+05
Congo Lomami Lobilo
bacterial counts (cells/ml)
10.8 10.9 11.0 11.1 11.2
Congo Lomami Lobilo
POC:PN -29.0 -28.5 -28.0 -27.5 -27.0 -26.5 -26.0
Congo Lomami Lobilo
δ13C-POC (‰) -30.5 -30.0 -29.5 -29.0 -28.5 -28.0 -27.5
Congo Lomami Lobilo
δ13C-DOC (‰) Fig. 2: Average water biogeo-chemistry at the 3 COBAFISH sites based on the 3 cruises (Dec. 2012, Sept. 2013, March 2014)
The COBAFISH project investigated the biogeochemistry and aquatic ecology of 3 river bassins, the Lobilo River located close to Yangambi, the Lomami R. and the Congo R. upstream of the confluence of the Lomami (Fig.1). These three rivers are very different in size, the Congo being the largest and the Lobilo the smallest, with catchment area spanning three orders of magnitude and freshwater discharge spanning two orders of magnitude (Table 1).
Table 1: Morphological, hydrological and catchment characteristics of the three COBAFISH study sites (Congo, Lomami and Lobilo).
Congo Lomami Lobilo
Drainage area (km²) 1,035,637 116,215 1,424
Mean slope (°) 0.93 0.19 0.05
Discharge (m3 s-1) 8,654 1,215 44
Catchment land cover (%)
Dense and mozaic forest 48 71 100
Grasslands, woodlands and shrublands 41 28 0
Catchment lithology (%)
Unconsolidated sediments 16 61 58
Siliciclastic sedimentary rocks 9 27 0
Metamorphics 72 12 42
Evaporites and volcanic 3 0 0
Dominant soil types (%)
Ferralsols 35 78 100
Cambisols 20 0 0
Acrisols 22 22 0
The land cover is also very different. In the Congo, the catchment is equally covered by forest and savannah; the Lobilo is exclusively covered by forest; the Lomami shows an intermediary land cover between both. Due to this different land cover, the Congo and Lomami have biogeochemical characteristics of white water rivers, and the Lobilo of black water rivers (Fig. 1). Soils in the Congo are highly heterogeneous, with a slight dominance of ferralsols while in the Lomami and the Lobilo, ferralsols represents 78 % and 100 % of soil types, respectively.
The forest cover on the Lobilo can explain the lower water temperatures than the other two rivers (Fig. 2). The Lobilo is characterized by low conductivity, total alkalinity (TA), major elements (Ca2+, Na+, K+) and dissolved silica (DSi) than the other two rivers (Fig. 2), due to lower rock weathering related to lower slope and higher forest cover (Table 1). Additionally, the Congo has highly soluble volcanic and evaporite rocks (Table 1). The Lobilo is also characterized by lower NO3
-concentrations (Fig. 2), and by higher water transparency (Secchi depth) due to lower total suspended matter (TSM). The particulate organic carbon (POC) content of the Lobilo is lower, but the contribution of mineral phase to TSM is lower as indicated by higher %POC (Fig. 2). The higher contribution of soils compared to direct vegetation inputs to the TSM pool in the Congo compared to the Lobilo is also reflected in the lower POC:PN ratio in the Congo (Fig. 2). The higher carbon stable isotope ratio of dissolved organic carbon (δ13C-DOC) and of POC (δ13C-POC) in the Congo compared to the Lobilo (Fig. 2) is due to higher contribution of C4 vegetation to DOC and POC in the Congo and to a denser forest cover in the Lobilo (shading effect). The absorption coefficient at 350 nm (a(350)) of dissolved organic matter (DOM) followed the pattern of DOC concentration (Fig. 2) with higher values in the Lomami than the Congo due to higher forest cover, but surprinsingly lower DOC values in the Lobilo. This is probably related to a higher contribution of ferralsols (Table 1) in the Lobilo that leads to a strong soil DOC adsorption (Davis 1982, Kaiser
and Zech 2000, Lucas et al. 2012). Furthermore, there was a correlation between DOC and flooded dense forest at the catchment scale that was highest in the Lomami (Fig. 3). In all rivers DOC concentrations were higher during the high flow period (2012 campaign) and decreased during the first low flow period occuring in march (2014 campaign) (Fig. 4a). DOM composition was investigated through two proxies derived from the absorption properties of DOM, namely the specific ultraviolet absorbance of DOM at 254 nm (SUVA254), positively related to the degree of DOM
aromaticity (Weishaar et al., 2003), and the spectral slope ratio (SR), inversely related
to the average DOM (MW) (Helms et al., 2008). Both parameters exhibited little variation regarding the range of variability that can be observed in natural freshwaters (Jaffé et al., 2008, Spencer et al., 2012). Thus, SUVA254 values were
elevated in all stations and were associated with low SR values during the two field
campaigns (Fig. 4c and 4d), indicating that DOM was dominated by aromatic compounds of high MW. Along the rivers, DOM aromaticity and MW increased in the order Congo < Lomami < Lobilo. Overall, the DOM composition in the Congo Basin is dominated by aromatic compound of high molecular weight (MW). The highly aromatic character of DOM in tropical ecosystems (especially in rivers draining forest basins) compared to temperate and Arctic freshwaters was recently illustrated in a large scale studies including African large rivers (Lambert et al., 2015). The elevated SUVA254 and low SR values all together indicate that DOM is mainly derived from
terrestrial sources freshly transported towards the aquatic ecosystem. An importance source of DOM appears to be the flooded forest. This is suggested by the good correlation between DOC and the extent of flooded dense forest, and is also consistent with the well-documented role of wetland areas in delivering great quantity of aromatic DOM in freshwaters despite their limited extent at the catchment scale (Hanley et al., 2013; Mann et al., 2014; Lambert et al., 2016).
Fig. 3: Correlation between the average DOC concentrations measured in the three studied sites and the extent of flooded dense forest at the catchment scale
Fig. 4: (a) DOC concentrations, (b) stable carbon isotopic composition, (c) DOM aromaticity and (d) DOM molecular weight in the studied sites during the 2012 (white bars) and 2014 (black bars) campaigns.
Primary production was extremely low in the Lobilo and higher in the Congo, due to a higher phytoplankton biomass in the Congo as indicated by chlorophyll-a (Chl-a) and biogenic silica (BSi) (Fig. 2). The low primary production in the Lobilo is probably due to low light conditions due to shading by forest cover and also due to very low pH values (Fig. 2). Bacterial counts generally followed DOC concentrations while O2 consumption only showed modest changes with tendency towards higher O2
consumption in the Lobilo. Nevertheless, O2 and CH4 concentrations and the partial
pressure of CO2 (pCO2) were distinctly higher in the Lobilo than in the Congo. Nitrous
oxide showed very modest changes and was highest in the Lomami.
Task 1.1: Relative contributions of allochthonous and autochthonous production to aquatic C reservoirs (KUL, ULg)
Monitoring of water biogeochemistry at Kisangani (Congo and Tshopo)
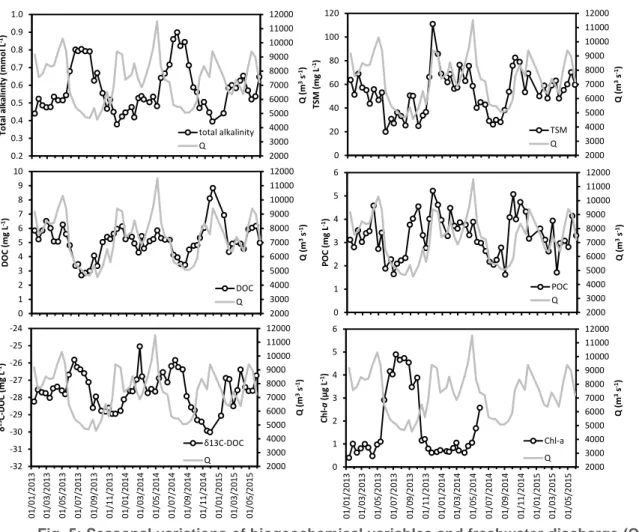
Fig. 5: Seasonal variations of biogeochemical variables and freshwater discharge (Q) in the Congo River at Kisangani.
The fortnightly monitoring at Kisangani of several biogeochemical variables in the Congo River and in one of its tributaries, the Tshopo, started in December 2012, and is on-going. Most of the biogeochemical variables in the Congo (Fig. 5) and the Tshopo follow regular seasonal variations that are either positively or negatively related to freshwater discharge. This can be explained by the fact that during high-water, the main water flows occur through superficial soils while during low-water a more important fraction of the water flow has passed through deeper parts of the soils, with an increased contribution from groundwaters (i.e. baseflow). This explains the higher conductivity and TA during low-water with flow of water from deeper parts of soils (groundwaters enriched in ions from rock dissolution). Also, the marked increase of TSM and the less marked increase of POC are related to transport during high-water of particles from superficial soils. During high-water DOC increases due to mobilization by surface runoff of organic exudates from superficial soils, while during low waters groundwaters have lower DOC content with a more refractory nature as indicated by the increase of δ13C-DOC. The δ13C-POC on the other hand does not show a marked seasonal variation (not shown). During low-water, residence time
2000 3000 4000 5000 6000 7000 8000 9000 10000 11000 12000 0.2 0.3 0.4 0.5 0.6 0.7 0.8 0.9 1.0 Q (m 3s -1) To tal al kal in ity (m m o l L -1) total alkalinity Q 2000 3000 4000 5000 6000 7000 8000 9000 10000 11000 12000 0 20 40 60 80 100 120 Q (m 3s -1) TS M ( m g L -1) TSM Q 2000 3000 4000 5000 6000 7000 8000 9000 10000 11000 12000 0 1 2 3 4 5 6 7 8 9 10 Q (m 3s -1) D OC (m g L -1) DOC Q 2000 3000 4000 5000 6000 7000 8000 9000 10000 11000 12000 0 1 2 3 4 5 6 Q (m 3s -1) PO C (m g L -1) POC Q 2000 3000 4000 5000 6000 7000 8000 9000 10000 11000 12000 0 1 2 3 4 5 6 01 /01/2 013 01 /03/2 013 01 /05/2 013 01 /0 7/ 2 01 3 01 /09/2 013 01 /11/2 013 01 /01/2 014 01 /03/2 014 01 /05/2 014 01 /07/2 014 01 /09/2 014 01 /1 1/ 2 01 4 01 /01/2 015 01 /03/2 015 01 /05/2 015 Q (m 3s -1) Ch l-a (µ g L -1) Chl-a Q 2000 3000 4000 5000 6000 7000 8000 9000 10000 11000 12000 -32 -31 -30 -29 -28 -27 -26 -25 -24 01 /01/2 013 01 /03/2 013 01 /05/2 013 01 /07/2 013 01 /09/2 013 01 /11/2 013 01 /01/2 014 01 /03/2 014 01 /05/2 014 01 /07/2 014 01 /09/2 014 01 /11/2 014 01 /01/2 015 01 /03/2 015 01 /05/2 015 Q (m 3s -1) δ 13C -D OC (m g L -1) δ13C-DOC Q
also increases and lower dilution from decreased water inputs to rivers, which might explain the increase of Chl-a during low-water as phytoplankton accumulates. However, it is not excluded that the decrease of TSM and DOC during low-water might also contribute to better light conditions and also explain the increase of chl-a.
The Congo River was enriched in DOC (5.2±1.3 mg L-1, n = 72) compared to the Tshopo River (3.9±0.9 mg L-1, n = 72) (Fig. 6a). Overall, DOC concentrations followed the water level fluctuations in both rivers, being higher during high flow periods relative to low flow periods. The relationship between DOC and stream water was however stronger in the Congo River than in the Tshopo River (Fig. 6). Likewise, changes in DOM composition were more marked in the Congo River than in the Tshopo River (Fig. 6b-d). Thus, δ13
CDOC values in the Congo River were highly
variable (-27.8±1.1 ‰, min = -30.0 ‰, max = -25.0 ‰). Lowest values were observed during high discharge events, and were associated with elevated DOC concentrations and DOM of high aromaticity (high SUVA254) and high MW (low SR).
δ13
CDOC increased after peak discharge, coinciding with decreasing DOC
concentration and DOM of lower aromaticity and MW. The seasonal pattern of DOM in the Tshopo River was more complex and varied from one year to another. Thus, δ13
CDOC values showed limited variability (-29.8±0.5 ‰, min = -30.7 ‰, max = -28.3
‰). Significant increases during low flow periods were only observed in March and August 2014, while no changes were detected in August 2013 and 2015. DOM aromaticity and MW were also relatively stable. A slight decrease in SUVA254 and
associated increase in SR coincided with the small increase in δ13CDOC values.
Overall, DOM in the Thopo River was more aromatic (4.7± 0.3 mgC L-1 m-1) and characterized by higher MW (0.75±0.04) than in the Congo River (SUVA254 = 4.5±
0.5 mgC L-1 m-1, SR = 0.77±0.04).
The seasonal changes in DOM concentration and composition are more important in the Congo River than in the Tshopo River. The large variation in δ13CDOC
values in the Congo River at Kisangani along the hydrological cycle can be related to a shift in the source of DOM mobilized in the upper part of the basin due to differences in water routing during the hydrograph. Decreasing δ13CDOC signatures
that occurred with increasing water discharge during high flow periods has been attributed to the mobilization of fresh DOM from superficial soil horizons in wide variety of catchments (Neff et al., 2006; Sanderman et al., 2009; Lambert et al., 2011; Bouillon et al., 2012). Inversely, highest δ13
CDOC values during low flow periods
reflect the deepening of water flow paths and the subsequent mobilization of more degraded and less aromatic DOM from deeper soil horizons, as evidenced by the decrease of SUVA254 and parallel increase of SR values. The less marked changes in
the Tshopo River imply a strong connection with superficial terrestrial DOM sources along the hydrological cycle. This is likely due to the very small fluctuations of water level that are typically less than 10 cm (Fig. 5).
The differences observed between the Congo and Tshopo (Table 2) can be related to differences in land cover (Fig. 8) or lithology (Fig. 9). The watershed of the Tshopo consists exclusively of forest (dense and mosaic) while the one of the Congo upstream of Kisangani is constituted of 47% of forest and 46% of savannah (woodlands, shrublands and grasslands). The unexpected lower DOC concentrations in the Tshopo relative to the Congo can also be explained by the dominance of ferrralsols in the Tshopo basin (100% of the basin).
As noted elsewhere in the Congo basin (Seyler et al., 2006 ; Bouillon et al., 2014), conductivity, total alkalinity, TSM are lower and conversely %POC is higher in basins with a higher forest cover. Also, the higher values of δ13C-POC and δ13
C-DOC in the in the Congo compared to the Tshopo can be attributed the C4 plants in the
grasslands and savanna compared to the C3 plants present in the forest. However, surprisingly, the POC and DOC concentrations are lower in the Tshopo than the Congo, since based on the land cover the reverse would have been expected (Bouillon et al. 2014).
Table 2: Average ± standard deviation of biogeochemical variables on the Congo and the Tshopo.
Congo Tshopo
Total alkalinity (mmol L-1) 0.6±0.2 0.3±0.1
TSM (mg L-1) 53.5±20.0 11.8±9.7 POC (mg L-1) 3.4±0.9 1.3±0.9 DOC (mg L-1) 5.2±1.4 3.7±0.8 %POC (%) 6.5±1.5 13.7±6.8 δ13C-POC (‰) -27.0±0.6 -29.7±0.8 δ13C-DOC (‰) -27.8±1.1 -29.7±0.5
Fig. 6 Temporal variability of (a) DOC concentrations, (b) δ13CDOC, (c) SUVA254 and (d) SR in the Congo and the Tshopo rivers during the monitoring. The water discharge fluctuation in the Congo River is plotted in the background.
Fig. 7 Correlation between water discharge (Congo River) or water height variation (Tshopo River) and DOC concentrations.
Fig. 8: Land cover on the catchment of the Congo River upstream of Kinsangani, and of Kinshasa and of the Tshopo, based on Mayaux et al. (2014).
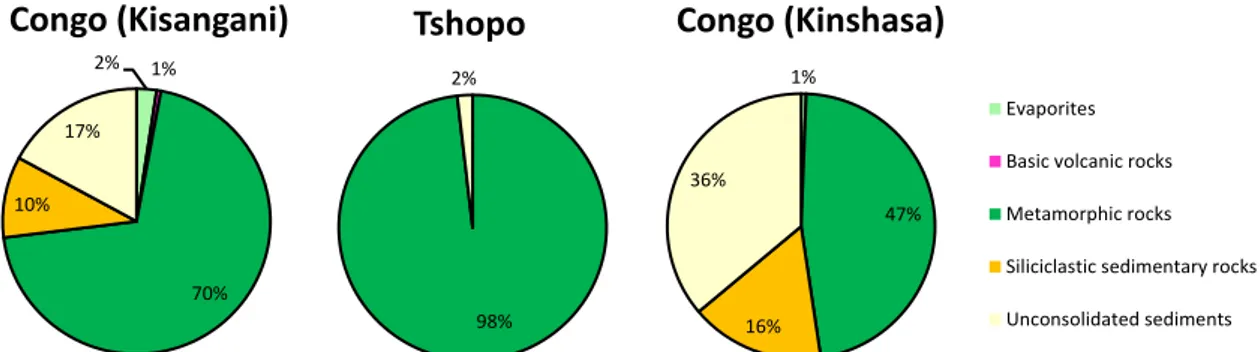
Fig. 9: Lithology on the catchment of the Congo River upstream of Kinsangani, and of Kinshasa and of the Tshopo, based on Hartmann & Moosdorf (2012).
The higher conductivity and total alkalinity in the Congo than the Tshopo can be explained by the differences in lithology. The catchment of the Tshopo is almost exclusively (98%) constituted of metamorphic rocks (granite, gneiss, micaschiste) (Fig. 9) (Nkounkou & Probst 1987) that undergo the lowest chemical erosion among major rocks outcropping on continents (Amiotte Suchet & Probst 1993).
The catchment of the Congo upstream of Kisangani has a lower proportion of metamorphic rocks (70%) and a higher proportion of siliciclastic sedimentary rocks (10% mainly as sand stone) and unconsolidated sediments (17% as sand and clays) that are more soluble than metamorphic rocks. Further, the catchment of the Congo upstream of Kisangani also contains evaporites (2%) and volcanic rocks (1%) that highly soluble. Indeed, the Virunga region that is rich in volcanic rocks (including basalts) has been shown to be a hotspot of chemical weathering (Balagizi et al. 2015). 39% 9% 44% 2% 6% Congo (Kisangani) 92% 8% Tshopo 50% 18% 27% 3% 2% Congo (Kinshasa) Dense Forest Mosaic Forest / other Woodlands and shrublands Grasslands Croplands 2% 1% 70% 10% 17% Congo (Kisangani) 98% 2% Tshopo 1% 47% 16% 36% Congo (Kinshasa)2% 1% 70% 10% 17% Congo (Kisangani) Evaporites Basic volcanic rocks Metamorphic rocks Siliciclastic sedimentary rocks Unconsolidated sediments
Comparison of the Congo at Kisangani and Kinshasa
Kisangani is situated 1700 km upstream of Kinshasa, and in-between the Congo River drains the “Cuvette Centrale Congolaise” that is the second largest wetland area in the World after the Amazon. This is apparent in the changes in land cover upstream of Kisangani and Kinshasa with a reduction of savannah cover from 44% to 27% and a concomitant increase in forest cover (Fig. 8). The water of the “Cuvette Centrale Congolaise” have low total alkalinity, TSM and POC, and are extremely rich in DOC (Laraque et al. 2009; Bouillon et al. 2014). Hence, the inputs from the “Cuvette Centrale Congolaise” lead to a dilution of POC, TSM and total alkalinity, and a marked increase in DOC, when comparing composition at Kinshasa with Kisangani (Table 3). Also, the relative contribution of DOC to total organic carbon strongly increases from Kisangani to Kinshasa.
Fluxes were calculated from concentrations and average discharges. All of the fluxes (TSM, DOC, POC, TA) increase at Kinshasa compared to Kisangani owing to the increase of flow by a factor of five (Table 4). Yet, fluxes of TSM, POC and total alkalinity only increase by a factor of 2, whether the fluxes of DOC increase by a factor of nearly 10. This is obviously related to the relative increase of concentrations (Table 3) and the influence of the “Cuvette Centrale Congolaise”.
Table 3: Comparison of concentrations of several variables on the Congo at Kinshasa and Kisangani (COBAFISH data for 2013-2014). Data for Kinshasa are from Coynel et al. (2005) and Wang et al. (2013).
Congo at Kisangani Congo at Kinshasa
Total alkalinity (µmol L-1) 568 175
DOC (mg L-1) 5.2 10.6
POC (mg L-1) 3.4 1.7
TSM (mg L-1) 53.8 26.3
DOC/(DOC+POC) (%) 61 86
Table 4: Freshwater discharge (Q) and fluxes at Kisangani and Kinshasa.
Kisangani Kinshasa Ratio
Q (m³ s-1) 7,454 37,047 5.0
TSM Tg yr-1 12.9 30.7 2.4
POC TgC yr-1 0.8 2.0 2.4
DOC TgC yr-1 1.3 12.4 9.7
Total alkalinity TgC yr-1 1.5 2.1 1.4
Stable isotope signatures of primary producers
Overall, stable isotope signatures of terrestrial primary producers all corresponded to C3 plants, for which average δ13C signatures of 32.3 ± 2.3 ‰ and -29.8 ± 1.6 ‰ were measured during the first two field campaigns (n=44 and 15, respectively). These are relatively low values for C3 vegetation, but consistent with expectations for tropical rainforests where δ13C values are often low due to high precipitation and „understory effects‟ (i.e. the contribution of 13
C-depleted soil-respired CO2 which is re-assimilated by plants, Kohn 2010). The only C4 plants
sampled were the Hippo Grass, Vossia cuspidata, from patches growing along the river banks.
As expected these grasses have typical C4 signatures of -13.0 ± 1.0 ‰ (n=16). Aquatic macrophytes showed 13C signatures within a relatively narrow range (-30.3 ± 1.9 ‰ and -29.9 ± 3.0; n=31 and 8 for the first two field campaigns) with 2 exceptions, i.e. a Ranunculus sp. from the Lobilo River with highly 13C-depleted signature (-44.5 ‰) and an unidentified macrophyte from the Lomami with a low value of -37.6 ‰. It must be noted here that the macrophyte data presented include data from both submerged and floating species (e.g., Eichhornia crassipes), whereby the latter type derive their CO2 from the atmosphere and therefore have signatures
similar to those of terrestrial C3 vegetation.
Task 1.2: Aquatic primary production, respiration, and net community metabolism (ULg, KUL)
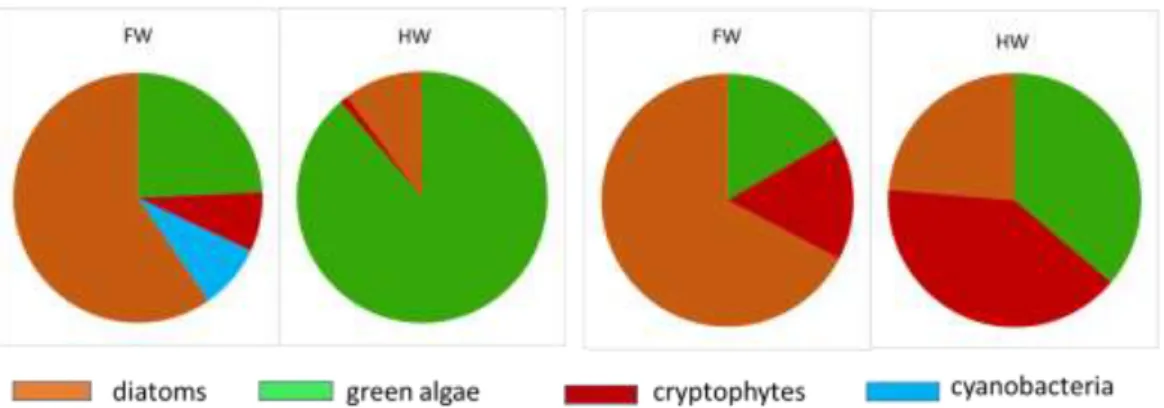
A very comprehensive data-set of phytoplankton composition in the Congo River was acquired along a 1700 km stretch (Kisangani-Kinshasa) in the mainstem during high water (December 2013) and falling water (June 2014). A total of 164 samples for phytoplankton analysis were collected in the main river, in tributaries and one lake. Based on marker pigment concentration by high performance liquid chromatography (HPLC) verified by microscopic examination, green algae (both chlorophytes and streptophytes) dominated in the mainstem in highwaters, whereas diatoms dominated in falling waters; cryptophytes and cyanobacteria were more abundant but still relatively low in the falling water period, both in the tributaries and in the main channel (Fig. 10).
Fig. 10: Average relative contribution to chlorophyll a of the main phytoplankton groups during the sampling campaigns of December 2013 (high water, HW) and June 2014 (falling water, FW)
Phytoplankton biomass and production was higher than previously reported in tropical river channels, allowing net growth within the mainstem in many sites, whereas in other rivers phytoplankton production mainly occurs in the floodplain lakes. This is due to generally low TSM values in the Congo and to its relative shallowness that allows net phytoplankton growth in the mainstem unlike other deeper and more turbid tropical rivers such as the Amazon. Pelagic community respiration (R) was overwhelmingly higher than primary production (Fig. 11) indicating a net heterotrophic status that is fuelled by allochthonous carbon inputs from terrestrial or wetland origin. Yet, CO2 emissions to the atmosphere in three
study sites and elshewhere in the Congo basin were up to an order of magnitude higher than R (Fig. 12). This indicates that the dissolved CO2 is laterally imported
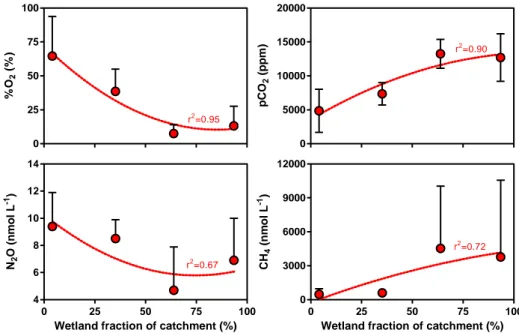
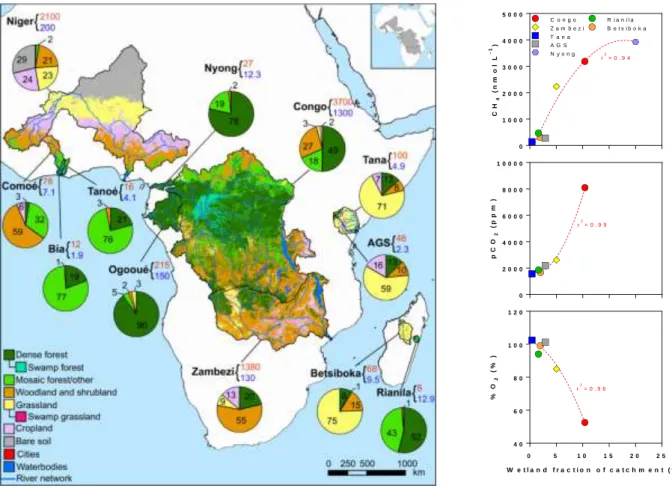
either from soils or wetlands. Indeed, within the Congo basin, there was a correlation between the wetland fraction of the catchment surface and the concentration of GHGs (Fig. 13). The pCO2 and CH4 values were positively related to wetland
fraction, while %O2 and N2O were negatively related to the latter. This is in line with
findings in the Amazon basin where CO2 emissions from wetland lakes and river
channels have been attributed to organic C from wetlands (Engle et al. 2008; Melack and Engle 2009; Abril et al. 2014) that also sustain intense CH4 evasion (Melack et
al. 2004).
Fig. 11: Primary production versus pelagic respiration in the three COBAFISH sites and in the rest of the Congo basin based on data gathered during CONGO2010 and the three TRANSCONGO cruises.
Fig. 12: Air-water CO2 fluxes versus pelagic
respiration in the three COBAFISH sites and in the rest of the Congo basin based on data gathered during CONGO2010 and the three TRANSCONGO cruises.
Fig. 13: Wetland presence drives the pattern of GHGs and O2 in the Congo River. pCO2 (ppm),
CH4 (nmol L -1
), N2O (nmol L -1
) and %O2 (%) in 46 rivers of the Congo basin as function of
wetland fraction of catchment surface (%). Data were bin-averaged by intervals of 25%. Two extreme CH4 values (>25000 nmol L-1) were removed from the analysis. Error bars correspond to the standard deviation on the mean. Lines correspond to a second degree polynomial fit.
0 100 200 300 400 500 0 100 200 300 400 500 P ri mary prod uc ti on ( mm ol m -2 d -1) Respiration (mmol m-2d-1)
other Congo data COBAFISH 0 100 200 0 100 200 0 500 1000 1500 2000 2500 3000 0 500 1000 1500 2000 2500 3000 A ir -w a ter CO 2 flux (mmol m -2 d -1)
Pelagic respiration (mmol m-2d-1)
other Congo data COBAFISH 0 25 50 75 100 % O2 ( % ) r2=0.95 0 5000 10000 15000 20000 p C O2 ( p p m ) r2=0.90 0 25 50 75 100 4 6 8 10 12 14
Wetland fraction of catchment (%)
N2 O ( n m o l L -1) r2=0.67 0 25 50 75 100 0 3000 6000 9000 12000
Wetland fraction of catchment (%)
C H4 ( n m o l L -1) r2=0.72
Comparison of greenhouse-gases of the Congo with other African basins and with the Amazon
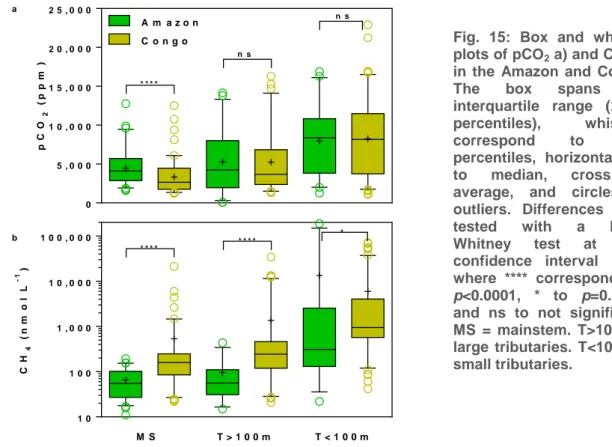
The COBAFISH biogeochemistry data has been integrated into a larger data-set from the Congo basin, that was used for a comparison of greenhouse-gases (CO2, CH4, N2O) across different African basins (Fig. 14) and with the Amazon (Fig.
15).
A relationship between CH4, pCO2 and oxygen saturation level (%O2) with
wetland fraction was found across seven river systems in Africa (Fig. 13), consistent with findings in the Amazon basin where CO2 emissions from wetland lakes and river
channels have been attributed to organic C from wetlands (Engle et al. 2008; Melack and Engle 2009; Abril et al. 2014) that also sustain intense CH4 evasion (Melack et
al. 2004). However, basins that are virtually devoid of wetlands such as the Tana (<0.5% of the catchment) were still found to be sources of CO2, although admittedly
lower than other African rivers. This suggests that part of the CO2 emissions from
African rivers is also partly sustained by non-flooded biomass. Combined pCO2 and
CH4 data were compiled in the Amazon (n=136) and Congo (n=208). Data were
aggregated into mainstem (MS), large and small tributaries (T>100 m and T<100 m width, respectively). The pCO2 in the Amazon mainstem was significantly higher than
in the Congo mainstem, but pCO2 values were not significantly different in large and
small tributaries (Fig. 15). The CH4 in the mainstem, large and small tributaries were
significantly higher in the Congo than in the Amazon (Fig. 15). The median CH4 in the
Congo was three to four times higher than in the Amazon, for mainstem/small tributaries and large tributaries, respectively.
Several hypotheses can explain the different behavior of CH4 in the Amazon
and Congo river channels:
The Congo flooded wetland is in majority flooded forest. In the Central Amazon, flooded forest accounts for 80% of flooded wetland, and the remaining 20% corresponds to temporary and permanent lakes. Floodplain lakes are characterized by high gas transfer velocity values, that promote the evasion of CH4
to the atmosphere and water oxygenation that will favor bacterial CH4 oxidation.
Local upland runoff is the main source of the wetland water in the Congo, and not flooding by riverine overflow as in the Amazon. This unidirectional flow pattern will promote the transport of the CH4 produced in the flooded forest towards the small
and large river channels of the Congo, unlike the Amazon where during rising water and high water, the water transport is from the river channels towards the wetlands.
The Congo wetlands are mostly permanently flooded unlike the Amazon floodplains that are seasonally flooded. Permanently flooded wetlands are known to be stronger CH4 emitters and presumably CH4 producers than seasonal flooded
wetlands.
In the Congo, floating macrophytes (mainly Vossia cuspidata) commonly occur along channel edges and within channels, and form large meadows in streams, rivers and mainstem, in all types of waters (white and black). Floating macrophytes are known to host high CH4 production and emission that will be directly delivered
into the Congo river channels. This does not occur in the Amazon where floating macrophytes are mainly present in floodplain lakes and do not occur in large tributaries and the mainstem due to strong currents, and are absent in black waters. The CH4 released by floating macrophytes in the Amazonian wetland lakes
will be lost locally by evasion to the atmosphere and CH4 oxidation (see above),