Construction and Demolition Wastes: specific conditions for
recycling in North West Europe
Simon Delvoie1, Luc Courard1, Julien Hubert1, Zengfeng Zhao1, Frédéric Michel1
1 Building Materials, Urban and Environmental Engineering, University of Liège, Belgium
Abstract
The Construction and Demolition Wastes (C&DW) are estimated at one third of total wastes generated in the European Union and represent the main flux in volume. Inert materials (e.g. concrete, bricks, tiles and ceramics) constitute the largest fraction of construction and demolition wastes. These wastes can be recovered as secondary raw materials after a recycling process resulting in the production of recycled sands and aggregates. The market for recycled sands and aggregates is however complex and sensitive. It can be affected by many parameters and may be very variable from one region to another, even in the same country. A quantitative analysis of market is carried out in five North West European countries: Belgium, France, Germany, Luxembourg and the Netherlands. For achieving this analysis, attention is paid to the following data/parameters: generation of inert construction and demolition wastes, production of recycled sands and aggregates and production of natural sands and aggregates. Since the market of recycled products is also governed by transportation costs (mainly transported by road), the study has also compiled data on the density of recycling plants for construction and demolition wastes, the density of pits and quarries extracting natural materials, the density of inert landfills and taxes applied for C&DW landfilling. National/regional legislation and requirements are also included in the analysis. Based on the compiled data and objective reasons, it is observed that the market of recycled sands and aggregates is more developed and more suitable in the Netherlands and in Flanders (North of Belgium) than is the other investigated countries/regions.
Keywords
Recycling, construction and demolition waste, market, legislation, plant, quarry, transportation, drivers, barriers, landfill, aggregate, sand
Corresponding author: Luc Courard, Prof. Dr. Ir.
Building materials, Urban and Environmental Engineering Research Unit, University of Liège Allée de la Découverte, 9 – 4000 LIEGE (Belgium)
Phone : + 32.4.366.93.50 Email : Luc.Courard@uliege.be
1. Introduction
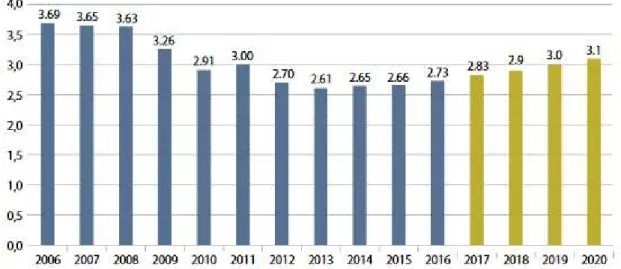
In 2014, the EU-28 countries produced a total amount of 2,503 million tons (Mt) of wastes by all economic activities and households (Eurostat, 2017). The construction industry accounts for one third of all the generated wastes and consists of one of the heaviest and most voluminous waste stream in the EU. Construction and demolition wastes (C&DW) represent an amount of about 850 Mt generated every year by the EU-28 or 1.7 tons produced per year and per EU inhabitant. In the other side the annual European demand (EU-28+EFTA) in aggregates has amounted between 2,600 and 2,700 Mt since 2012 (Figure 1). In 2016, the production of aggregates in the EU28 plus EFTA countries was 2.73 billion tonnes (UEPG, 2017). This indicates an increase of 2.6% in 2016 compared to 2015, continuing the very modest growth trend since the post-crisis trough of 2013. The European demand represents about 10% of the global demand in aggregates (UEPG, 2017).
Fig. 1. Trend in total EU + EFTA Tonnages (in billion of tonnes) (UEPG, 2017). According to the Waste Framework Directive (2008/98/EC) (Directive, 2008), member states shall take the necessary measures to achieve by 2020 that a minimum of 70% (by weight) of non-hazardous C&DW excluding unpolluted naturally occurring material (17 05 04 in the List of Wastes) shall be prepared for re-use, recycled or undergo other material recovery, including backfilling operations using waste to substitute other materials.
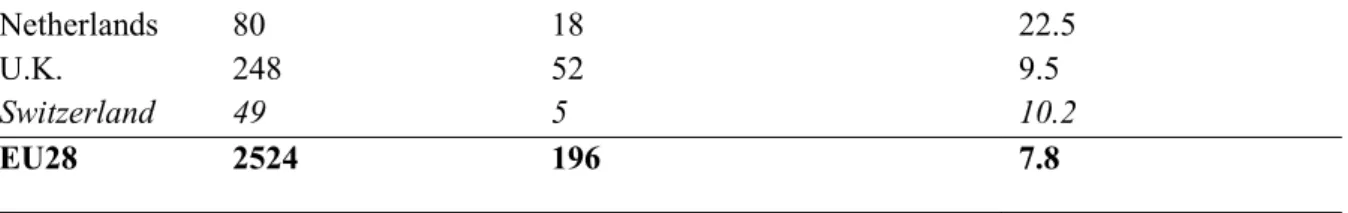
Table 1.
Estimation of total and recycled sands and aggregates production (UEPG, 2017; data 2015) Total production
(millions of tons)
Recycled sands and aggregates (RS&A) production (millions of tons) Percentage of RS&A vs total production (%) Belgium 81 15 18.5 France 323 20 6.2 Germany 545 68 12.5 Ireland 28 0 0 Luxembourg 4 0 0
Netherlands 80 18 22.5
U.K. 248 52 9.5
Switzerland 49 5 10.2
EU28 2524 196 7.8
Referring to European Waste Framework Directive 2008/98/EC, most of the NWE countries have already reached the European objective. Figure 2 shows the origin of the aggregates for the EU27 countries in 2016. The main application for the re-use of C&DW is backfilling. However it is clear that the portion of recycled C&DW is limited. The low percentages of recycled sands and aggregates (RS&A) in Table 1 clearly indicate a need for R&D in the NWE countries in order to improve RS&A properties and optimize recycling processes (Deloitte, 2016).
Fig. 2. 2016 aggregates production in Europe in millions of tonnes by country and type (UEPG, 2017).
The market of recycled sands and aggregates needs to be healthful at country scale to foster member states to reach the EU target. The most cited drivers that can boost C&DW recycling are: Green Public Procurement, taxation on C&DW landfilling, taxation on natural sands and aggregates, availability on cost of natural sands and aggregates, quality certification of recycled sands and aggregates, better public perception and increased consumer acceptance, low distance of C&DW recycling plants (e.g. (Gabarino et al., 2013; Silva et al., 2017)).
This study focuses on three main key parameters that influence the market of recycled materials: the landfill of inert C&DW, the challenge with primary raw materials and the availability of inert C&DW recycling plants. The market context is investigated in five NW
European countries (Belgium, France, Germany, Luxembourg and the Netherlands) towards a quantitative analysis of the generation of C&DW, the production of natural and recycled sands and aggregates, the density of recycling plants, the density of extraction sites for natural materials, and the C&DW landfilling legislation.
2. Market context
Table 2 presents the results of a quantitative analysis carried out on key parameters that influence the market of recycled sands and aggregates, for the five investigated NW European counties. Attention has been paid to provide the most current available data. Some data of the market of recycled sands and aggregates have been provided by NWE Interreg project SeRaMCo partners (Delvoie et al., 2019).
C&DW are mainly composed of CBTC (concrete-bricks-tiles-ceramics) and, in smaller proportions, bituminous materials, metals, wood, plastics and others. These materials are usually sorted and recycled in facilities devoted to produce recycled sands and aggregates. These secondary products are mainly used for road infrastructures and backfilling applications. Excavated soils, sands and gravels are also often considered as C&DW. These excavated materials are far to be negligible in terms of weight since they usually compose more than half of the total C&DW produced at country scale. However, from a legislative point of view, excavated materials are usually considered differently from the other C&DW. For example, the ban for inert C&DW landfilling is not applied to excavated soils and sands/gravels in Belgium. This ambivalent status for excavated materials entails confusion in the published national statistics related to C&DW production. Some countries include the amount of excavated materials in the quantity of generated C&DW while others do not consider this fraction in their annual statistics. Another source of confusion in national statistics pertains to the production of recycled sands and aggregates. Some countries include the materials recycled on-site and recovered on the same site in the amount of recycled products, while other countries only consider C&DW treated in recycling facilities, as it is the case in France.
2.1. Belgium
In Belgium, the 3 regional governments (Flanders, Wallonia, Brussels-Capital) are almost fully competent regarding C&DW management and recycling. These topics are not coordinated or harmonized amongst regions in a mandatory manner. C&DW management in each Belgian region is developed hereafter.
In Flanders, C&DW represented 15 Mt in 2014 (OVAM, 2016). About a half (47%) of these wastes are generated by the demolition of buildings. The other half is produced by refurbishment of buildings (24%), roads (18%) and construction of new buildings (8%). The major amount of C&DW materials are composed of 40% of concrete (reinforced and unreinforced), 40% of masonry and 12% of asphalt (Vrijders, 2015). Wallonia produced between 5 to 7 Mt of inert C&DW in 2013 (SPW-DGO3, 2017). Estimations at regional scale show that these inert wastes are subdivided into 25% of unreinforced concrete, 13% of
reinforced concrete, 45% of mixed wastes and 11% of asphalt (RDC environment, 2010). In the Brussels-Capital Region, inert C&DW generated account for 480,000 tons (excluding excavated soils) (Bernair, 2018). At the country scale, it can be estimated 22 Mt are annually generated in Belgium (Table 1).
Fig. 3. Working process in a construction and demolition waste crushing facility (in Delvoie et al. (a), 2018 adapted from Medina et al., 2015).
A landfill banishment has been introduced in Flanders since 1998 (Order, 1997) for both unsorted wastes and separately collected wastes to be taken into consideration for recovery. In Wallonia, the Decree of the Walloon Government of March 18, 2004 (Arrêté, 2001), gives criteria for the admission of wastes in landfills. According to the decree, inert C&DW are not allowed to be stored in landfills since January 1st, 2006: as a result, recycling of inert C&DW has become an obligation since 1998 and 2006 in Flanders and in Wallonia, respectively.
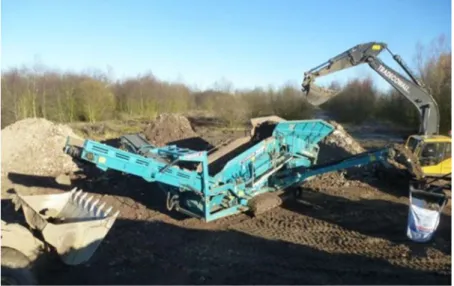
More than 16 Mt of recycled sands and aggregates were produced in 2016 in Belgium. The total amount of certified production plants of recycled aggregates approaches 350 in the country (Bernair, 2018). About 80% are fixed installations (Figure 3) and 20% are mobile plants (Figure 4). In Wallonia, the total production of recycled sands and aggregates can be estimated at 3.5 Mt in 2017 (Mariage, 2018), with a total number of recycling plants probably close to one hundred, mainly located around the two main cities of the region in terms of inhabitants: Charleroi and Liege. Almost 14 Mt of certified recycled sands and aggregates were produced in Flanders in 2013. Between 200 and 250 recycling plants are identified in Flanders. Only a
few C&DW recycling plants are localized in the Brussels-Capital region. Most of C&DW are exported to Wallonia or to Flanders for recycling (Bernair, 2018).
Fig. 4. Semi mobile installation for recycling CBTC.
Extractive industry is essential for the industrial and economical activities in Belgium. It represents between 160 and 200 extraction sites. The annual overall Belgian consumption of natural and recycled sand and aggregates is estimated at 100 Mt (Adant et al., 2014). The annual production of natural sand and aggregates is estimated at 70-75 Mt. Every year, about 15 Mt of extracted natural materials are exported outside Belgium, and 20 Mt of natural materials are imported, mainly from neighbouring countries. Due to geological context, the majority of the extraction sites are located in Wallonia. About 80% of the annual turnover of the Belgian extractive industry comes from the southern part of the country. As a result, the mean distance from quarries is 70 km in Flanders compared to 40 km in Wallonia.
2.2. France
The total amount of C&DW represented 241 Mt in 2012 (ADEME, 2016). This amount includes unpolluted soil, sands and gravels that accounted for 175 Mt (70% among inert C&DW). Inert C&DW excluding excavated soils, sands and gravels reach about 60 to 70 Mt per year. Among inert C&DW, concrete accounts for 28%, bituminous mixtures represent 15%, other materials from roadways are estimated at 19% and mixed inert wastes account for 27% (data 2008, (Deloitte France, 2015)).
According to the French Association of Producers of Aggregates UNPG (UNPG, 2018), 25.7 Mt of recycled aggregates were produced in 2016. Among them, 21.4 Mt came from construction and demolition and 4.3 Mt were manufactured. The amount of recycled aggregates from demolition corresponds to the quantity of aggregates and sands produced in recycling plants located in France. This represents about 6% of the total production of sands and aggregates (natural, manufactured and recycled). However, this data does not take into account inert materials that are recycled on-site. The quantity of sands and aggregates recycled on-site could be estimated at 40 to 50 Mt. It means that the total quantity of recycled sands and aggregates produced in France could be estimated around 65 to 75 Mt and corresponds to
15-20% of the total production of sands and aggregates (UNPG, 2018). About 400 C&DW recycling plants are inventoried in France by the UNPG.
Around 80 Mt of inert wastes (including excavated soils, sands and gravels) were landfilled in 2012. This represents 35% of the total amount of inert wastes produced in France. The country is covered by 657 landfills class 3 (for inert wastes, called ISDI for “Installations de Stockage de Déchets Inertes”) (UNPG, 2018). There is no banishment for landfilling inert C&DW in France. Furthermore, it is widely acknowledged that the current level of landfill tax, even if steadily increasing, is not high enough to be a sufficient deterrent (Deloitte France, 2015).
In 2016, 304.4 Mt of natural sands and aggregates were extracted from about 2,300 pit and quarries. This represents a yearly production of 4.5 million tons of natural sands and aggregates per inhabitant. The most productive regions are mostly located in the Southern and Western parts of the country. This distribution contrasts with the most productive area in recycled sands and aggregates: these regions are mostly located in the Northern part of France where 50% of the production is concentrated (UNPG, 2018). The consumption of sands and aggregates by the French market reached 423 million tons in 2014 with 23.1 % from recycling (on-site or in sorting-recycling plants) and 70-75 % from natural origin (UNPG, 2018). About 9 Mt of sands and aggregates were exported and 10.7 Mt were imported in 2016, mainly to/from neighbouring countries.
2.3. Germany
In Germany, 202 Mt of C&DW were generated in 2014. This amount includes 118.5 Mt of excavated soils and sands or gravels. By excluding these materials, the resulting quantity of C&DW represented 83.5 Mt. The concrete-bricks-tiles-ceramics (CBTC) fraction represent between 60 and 65% of the C&DW (excl. soils, sands and gravels) (Bundesverband, 2017).
The production of recycled sands and aggregates represented 67.6 Mt in 2014 [19]. Germany counted more than 2,000 C&DW treatment facilities. However, 30% of these are located in Bavaria which is the second most productive state for recycled sands and aggregates behind North Rhine-Westphalia. The total capacity of the recycling facilities was estimated at 107 Mt per year. Most of the states have enough spare capacities left and some of them run with significant overcapacities (Brandenburg, North-Rhine Westphalia) (Deloitte Germany, 2015).
Class 0 landfill is related to inert wastes in Germany. These 800 landfills, which are the most abundant type, are located all over the country. However, the total number of landfills has regularly decreased since 2005. Excluding excavated soils and sands or gravels, less than 5% (corresponding to 3-4 Mt) of the yearly generated C&DW have been landfilled since 2010 (Deloitte Germany, 2015). Landfill tax depends on the kind of waste and varies from one state to another in Germany. An example reported in the western part of Baden-Württemberg applies landfill taxes of 14 EUR/t for recyclable C&DW (Delvoie et al.(a), 2018).
Germany is the European largest producer of natural sands and aggregates with a production estimated at 475 Mt in 2016 (UEPG, 2016). Germany alone produces more than 20% of the
total sands and aggregates produced in the EU-28. The extractive industry represents approximately 3,200 extraction plants. According to MIRO (“Mineralische Rohstoffe”- German Aggregates Federation), the country has sufficient reserves of mineral raw materials and, particularly in terms of construction, does not need to import materials. The German annual demand of sands and aggregates is estimated at 500 Mt.
2.4. Luxembourg
Data from the Administration of the Environment in Luxembourg indicate that the total amount of inert C&DW represented 6.79 Mt in 2013. This amount can be subdivided into two categories: 6.26 Mt (92%) of soils, sands and gravels and 0.535 Mt (8%) generated from building construction and demolition. About 98% of this second category is recycled. The rest is landfilled. More than 80% of soils and sands or gravels are also landfilled (Muller et al., 2015). Among inert C&DW, CBTC category is estimated at 50% (about 0.27 Mt) (Deloitte Luxembourg, 2015). Concrete represented approximately 0.178 Mt in 2010 (Thapa et al., 2014). However, the amount of inert C&DW generated and recycled/recovered on-site is not known by the Administration of the environment and is not included into national statistics (Administration, 2018).
The production of recycled sands and aggregates was estimated at 1.8 Mt in 2010 (Thapa et al., 2014). This amount includes recycled soils, sands or gravels and other C&DW. About 650 thousand tons of inert wastes are also exported outside of Luxembourg for recycling. The Administration of the Environment in Luxembourg inventoried 32 mobile crushers and 2 recycling plants for road inert wastes covered the territory in 2012 (Less, 2012).
Landfilling of inert waste is not banished in Luxembourg: 5.4 Mt of C&DW were landfilled in 2013. However this amount is mainly constituted by more than 95% of excavated soils, sands and gravels (Muller at al., 2015). The territory is covered with 12 landfills for inert wastes in 2013 (Waldmann et al., 2014). According to UEPG (UEPG, 2016)], 13 extraction sites for aggregates and sands production are present in Luxembourg. Around 1 Mt of natural sands and aggregates are produced annually.
2.5. The Netherlands
In the Netherlands, 23.8 Mt of C&DW were produced in 2014. This amount is stable since 2000. Mineral waste for construction accounted for 80-85 % (19-20 Mt) in 2014. About 11 Mt of concrete wastes are produced every year. This represents 55 to 60 % of mineral wastes (CBS et al., 2017).
The members of the national federation of C&DW recyclers (BRBS – “Recycling, Branchevereninging Breken en Sorteren”) produce more than 75% (~18 Mt) of the total volume of C&DW generated in the country. These members are subdivided in three categories: crushing recycling plants (35%), sorting recycling plants (20%) and crushing + sorting recycling plants (45%). These recycling plants are widely spread all over the country (more than 150 locations) even if closer to the main cities: Amsterdam, Arnhem, Eindhoven, Hengelo, Maastricht,
Rotterdam, Utrecht (BRBS recycling, 2018). Most of the recycled materials come from the south-eastern part of the country (Gelderland and Limburg) (Hoen, 2017).
Inert C&DW in the Netherlands must be recovered and have been prohibited from landfilling since 1995 (Besluit, 1997). An exemption from this prohibition can be provided by the Provinces in case of the capacity of waste processors exceeds the waste supply. The Dutch approach is that landfilling is only allowed for waste flux for which no recovery or incineration is possible. This approach is known as “the order of preference” (CETMA et al., 2017).
The Dutch extractive activity is divided into a regular part and a regular one. The non-regular extractive activity is mainly related to backfilling and land elevation projects. The regular extraction of primary building materials in the Netherlands in the past ten years corresponds to about 55 to 80 Mt (average 65 Mt) per year. The regular activity is also mainly governed by materials used for backfilling and land elevation: 35 to 40 Mt of sands are extracted for this issue, representing 60-65% of the regular extracted materials. Only 7% of the supply is made of coarse gravels mainly coming from Limburg (South-East). It is clear that the demand of coarse aggregates is much higher than the national production. 70% of the coarse aggregates are imported from Germany, Belgium (Wallonia), Norway, Scotland and UK. These materials are transported on distances exceeding 100 km (Hoen, 2017). According to UEPG, primary raw materials for construction are extracted from approximately 300 quarries and extraction sites (UEPG, 2016).
The total need for sands and aggregates is estimated at 85-110 Mt per year (excluding non-regular extraction activity). The demand of natural raw materials is higher than the supply at national scale. This makes favorable the national market of recycled aggregates. Recycled materials represent from 20 to 35% of the regularly extracted primary raw materials (Delvoie et al. (a), 2018).
3. Targets
3.1. Belgium
The Walloon plan Horizon 2010 was giving the objectives in terms of C&DW management (Table 3):
Table 3.
Objectives for CDW management, Walloon plan Horizon 2010.
1995 2000 2005 2010 C&DW (T/year) 2,100,000 2,600,000 2,500,000 2,300,000 Objectives Recovery/Recycling/re-use (%) 68 74 81 87 Incineration (%) 0 1 1 1 Landfilling (%) 20 19 14 10 Other or unknown (%) 12 6 4 2
The Walloon plan Horizon 2020 (SPW-DG03, 2017) wants to promote the re-use of recycled aggregates. It specifies that 30% of aggregates used for public procurements must come from
waste recycling. In order to promote re-use of recycled aggregate, the Walloon plan Horizon 2020 mentions three interesting actions:
Improve confidence in recycled aggregates and enhance the quality of recycled products through verification by the client of the announced characteristics or via external controls validating the self-control of the producer. The introduction of qualitative criteria regarding the environment in public specifications would enhance the quality of recycled products and promote recycled products;
Promote recycled products both a level of public authorities (Public Service of Wallonia, provinces, municipalities) and private operators (architects, design offices, contractors...) through information meetings, publications and exemplary achievements;
Impose a minimum rate of re-use of recycled products for public worksites.
Specific actions have been supported by Wallonia authorities for evaluating the possibility of reusing more and more C&DW in road construction and concrete precast elements:
Interreg NWE SeRAMCo (2016-2020) Secondary Raw Materials for Concrete Precast Products (introducing new products, applying the circular economy) (http://www.nweurope.eu/seramco)
Interreg FWVL VALDEM (2016-2020) Solutions intégrées de valorisation des flux "matériaux" issus de la démolition des bâtiments : Approche transfrontalière vers une économie circulaire (Integrated solutions for the valorization of materials flows from C&DW : transborder approach for a circular economy) (http://www.valdem-interreg.eu)
FEDER ECOLISER (2014-2020) ÉCOliants pour traitement de Sols, Etanchéité et Routes (Ecobinders for soil treatment, waterproofing and roads) (https://www.ctp.be/files/pdf-liens/ECOLISER.pdf)
Beware Academia CONRePaD (Zhao et al., 2018) Composition de béton à base de granulats recyclés en utilisant la technique de compacité de l’empilement granulaire (Design of concrete with recycled concrete aggregates by means of compression packing theory)
APERROUTE (2013-2015) Amélioration des PErformances des Recyclés en domaine Routier par Optimisation des Unités de TraitEment (Increasing performances of C&DW aggregates by treatment plant optimization) (http://hdl.handle.net/2268/200156) These different research projects indicate the opportunities offered by recycled concrete materials in Concrete Precast Product manufacturing as well as industrial concrete by-products recycling within the industry as an economical and environmental way for increasing rates and incorporating construction industry within circular economy (Delvoie et al., 2019). Moreover, fine particles induced by construction and demolition waste recycling process represents the coming challenge: cementitious (Courard et al.) and brick fine particles (Tabarelli, 2018; Grellier et al., 2020) will be more and more used for elaborating self-compacting concretes and/or geopolymers.
3.2. The Netherlands
The Netherlands aims to be completely circular by 2050, as can be read in the Grondstoffenakkoord, a national agreement on resource use, signed by the government as well as the industry. In the Betonakkoord (a letter of intent that will be signed by a significant part of the Dutch concrete industry) the ambition to reduce CO2 emissions by 35% in 2030 and to use 95% secondary raw materials in concrete 2050 is agreed upon (MVO Nederland, 2017). Furthermore, replacing primary raw materials with secondary raw material in concrete production is going up from 2% in 2017 to 5% in 2018.
Since 2006 at least 95% of C&DW was recovered (i.e. waste serving a useful goal) and this will remain to be the national objective. The high rate is mainly caused by the use of recycled aggregates in roadwork foundations. Due to internal recycling (demolished roads are granulated and used in new roadworks) the market will be saturated in due course, risking a reduction of the recycling rate of C&DW and introducing the need for new applications of secondary raw materials from C&DW.
Fig. 5. Supply chain of construction and demolition waste (C&DW) recycling.
The supply chain of construction and demolition waste (C&DW) recycling and the quantification of material flows within this process is shown in the flow chart below (Figure 5). The amount of C&DW has significantly increased between 1995 and 2000. The share of recovery is raised from only 50% in 1985 to 98% in 2000. Between 2000 and recent days the amount of C&DW has remained stable, approximately 24 million tons a year.
4. Analysis
This study aims to point out some drivers and barriers related to the market of recycled sands and aggregates in North-West European countries. Three main key parameters are developed in more details: inert C&DW landfilling, the challenge with primary raw materials and the availability of inert C&DW recycling plants. In order to promote recycling, C&DW landfilling needs to be limited or prohibited. This can be performed by a legislation limiting or prohibiting landfilling, or by landfill taxation. The purpose of landfill taxation is to make landfilling more expensive than alternatives like sorting and recycling. The market of recycled sands and aggregates is also heavily influenced by the availability and the quality of natural materials. The price of primary raw materials can be largely influenced by transportation costs: the more locally the natural materials are produced, the higher the challenge for recycled sands and aggregates is. Furthermore, the type of recycling process has a major influence on the quality of the recycled products. Usually stationary facilities are able to produce recycled sands and aggregates with a higher quality than mobile recycling plants (Ulubeyli et al., 2017). The density of recycling facilities is also a key issue in order to limit transportation costs. While
C&DW (23,8 mln tons)
• Concrete 58% (CBS et al., 2017) • Other (such as wood, glass and plastic) 42%
Mixed resources (23,8mln tons) ((BRBS recycling, 2017)) • Recovery 97,5% • Landfill 2,3% • Incineration 0,1% • Dump 0,1% Recovery (23,2 mln tons)
• Roadwork backfilling 76% (BRBS recycling, 2017) • Other 22% (EIB, 2016)
• Concrete 2% (Ambition for 2018 5% (MVO Nederland, 2017))
extractive industry for primary raw materials is mainly constrained by the geological context, C&DW recycling facilities must optimize their location close to available materials that need to be recycled and close to construction sites where recycled materials could be reused (Delvoie et al. (b), 2018). Table 4 summarizes the main drivers and barriers for the market of recycled sands and aggregates related to the five investigated European countries: Belgium, France, Germany, Luxembourg and the Netherlands.
The Belgian market of recycled materials is quite different from one region to another. The country has also a regional legislation for waste management and recycling. The ban for inert C&DW landfilling in Flanders and in Wallonia certainly constitutes a major incentive for recycling. The market is more favorable in Flanders where the challenge with primary raw materials is lower than in Wallonia due to higher costs related to longer transportation distances. The C&DW recycling facilities are widely spread all over the country and the network of recycling plants is denser in Flanders, partially due to a higher density of population.
In France, inert C&DW recycling seems more developed in the northern regions of the country, where 50% of the production is generated in Ile-de-France, Grand Est and Hauts-de-France regions. These three regions are also responsible for the production of only 15% of massive rocks (UNPG, 2018): the challenge with primary raw materials is there lower than in the other regions. In France, landfilling of inert wastes has been a prevalent outcome yet. The applied landfill taxes for these kinds of wastes are too low to guide materials to recycling flux. Furthermore, the available network of recycling facilities seems to be not dense enough to limit transportation costs.
Table 4.
Drivers and barriers for the market of recycled sands and aggregates in NW European countries.
Belgium France Germany Luxembourg Netherlands
Inert C&DW
landfilling Driver Barrier Driver Driver Driver Challenge with
primary raw materials
Driver (in Flanders)
Barrier (in Wallonia)
Driver (in the North)
Barrier (in the West and the South)
Barrier Barrier Driver
Available inert C&DW recycling plants
Driver Barrier Driver Driver (density of facilities)
Barrier (low quality of recycled
materials)
Driver
Inert C&DW are not banished for landfilling in Germany. However, the landfill taxes seem to be high enough to push the majority of C&DW to recycling. Less than 5% of inert C&DW (excl. excavated soils, sands and gravels) are yearly landfilled. Germany is the largest producer of primary raw materials in the EU-28. The challenge with natural materials is consequently high. However, the country is covered by a dense network of C&DW recycling plants limiting transportation costs.
In Luxembourg, there is no ban for inert C&DW landfilling. However, less than 5% of inert materials (excl. excavated soils, sands and gravels) are landfilled every year. Even if the country is not a large producer of primary raw materials, the challenge with these natural materials is high due to importations from neighbouring regions. The large number of mobile plants available in the country constitutes an incentive for recycling. As mobile recycling facilities usually produce lower quality recycled materials, this situation fosters downcycling of recycled materials that are currently mainly used for road foundations.
The ban for inert C&DW landfilling has been applied for many years in the Netherlands. This is a major driver for recycling. Another main driver is constituted by low challenge with primary raw materials, mainly with hard rocks. Indeed, 70% of coarse aggregates are imported, increasing transportation costs for these materials. The market for recycled sands and aggregates is thus propitious in the Netherlands. This is promoted by a dense network of C&DW recycling facilities located all over the country.
4. Conclusion
The market of recycled sands and aggregates is difficult to understand because it needs to take into account very different parameters: on the one hand there is huge need of construction materials, specifically sand and aggregates for road foundations and concrete manufacturing. On the other hand, C&DW offer a large deposit, with several types of products and possible non constant production. Through a quantitative analysis, this study evaluates some of the main drivers and barriers related to the market of these recycled materials in NW Europe (Belgium, France, Germany, Luxembourg and the Netherlands). The quantitative analysis consists in a collection of national and regional statistics on key variables such as the amount of generated C&DW, the production on natural and recycled sands and aggregates, the density of recycling plants, the density of extraction sites for natural materials. These data are also combined with a review of the national and regional legislations on C&DW landfilling.
Results point out that the market of recycled sands and aggregates is more developed and more suitable in the Netherlands and in Flanders (North of Belgium) where all the three investigated key variables are considered as drivers. These regions are characterized by a lack of available local and good quality natural rocky materials, a developed framework of recycling plants for inert C&DW and a favorable legislation that push the waste flux to sorting and recycling. The market in Wallonia (South of Belgium), France, Germany and Luxembourg is challenged by primary raw materials where resources are locally abundant. The French market of recycled materials is furthermore disadvantaged by a lack of incentives that foster sorting and recycling, including landfilling.
A proactive policy of support for the recycling of construction and demolition waste therefore implies stopping the disposal of waste in landfills, the setting up of adequate recycling techniques, in particular through the installation of complete sorting centers and the networking of these recycling centers sufficiently dense, so as to reduce the impact of transport. There is a great opportunity for increasing the part recycled products on the NW European market of aggregates. More generally, the following recommendations can be formulated (according to Deloitte, 2016):
Enhance public procurement through the introduction of mandatory percentages of recycled aggregates in large civil engineering projects;
Develop reuse/reclaimed products programme of support and promotion (e.g. reuse percentage target);
Introduce end-of-waste criteria for recycled products;
Develop standards for recycled materials for various utilization for waste that did not meet end-of-waste criteria;
Facilitate material content traceability;
Introduce applications for recycled non-aggregates;
Encourage the construction products and materials supply chain to have much greater provision for taking back and incorporating recycled materials into new products; Deploy financial incentive to use recycled aggregates.
Acknowledgment
The study has been realized in the framework of the Interreg NWE SeRaMCo project
(“Secondary Raw Materials for Concrete precast product” -
http://www.nweurope.eu/projects/project-search/seramco-secondary-raw-materials-for-concrete-precast-products/#tab-1). The authors want to gratefully acknowledge project partners for their support in the data compilation essential for this study. We are particularly indebted to project partners from the University of Lorraine (France), the University of Luxembourg, the TU Kaiserslautern (Germany) and the TU Delft (the Netherlands) for the many interactions we have had all over the study.
References
Adant, I. and Chevalier, P., 2014. Les impacts socio-économiques pour l’industrie extractive belge du prélèvement kilométrique visant le transport de marchandises par route. Rapport d’analyse, Mai 2014, 10 p.
ADEME, 2016. Déchets, chiffres-clés, édition 2016. Agence de l’Environnement et de la Maîtrise de l’Énergie, 94 p.Arrêté 18 March 2004. Arrêté du Gouvernement wallon interdisant la mise en centre d’enfouissement technique de certains déchets. Retrieved from
http://environnement.wallonie.be/legis/dechets/decen008.htm
Administration de l’environnement, 2018. Plan national de gestion des déchets et des resources 2018. Administration de l’environnement, Ministère du Développement durable et des infrastructures, Gouvernement du Grand-Duché de Luxembourg, 240 p.
Besluit 8 December 1997. Besluit houdende een stortverbod binnen inrichtingen voor aangewezen categorieën van afvalstoffen (Besluit stortverbod afvalstoffen). Retrieved from http://wetten.overheid.nl/BWBR0009094/2018-02-06.
Bernair, C., Sobotka, I., Romnée, A., Pérez Dueñas, L., Boyer, C., Van Ginderdeuren, P., 2018. Le secteur de la construction à Bruxelles. Constat et perspectives: vers une économie circulaire, 91 p.
BRBS Recycling, 2018. Recycling, Branchevereninging Breken en Sorteren, Zaltbommel, Netherlands. Retrieved from www.brbs.nl/
Bundesverband Baustoffe – Steine und Erden e.V., 2017. Mineralische Bauabfälle – Monitoring 2014. Kreislaufwirtschaft Bau, Berlin, 19 p.
CBS, PBL, RIVM, WUR, 2017. Bouw- en sloopafval: vrijkomen en verwerking, 1985-2014 (indicator 0147, versie 10, 1 juni 2017). Centraal Bureau voor de Statistiek (CBS), Den Haag; PBL Planbureau voor de Leefomgeving, Den Haag; RIVM Rijksinstituut voor
Volksgezondheid en Milieu, Bilthoven; en Wageningen University and Research, Wageningen. Retrieved from www.clo.nl.
CETMA, ACCIONA, CBI, FENIX, QUB, ROS, NTUST and ACR+, 2017. D1.1 – Data collection on CDW, WPT1 – Mapping and analysis of CDW reuse and recycling in prefabricated elements, RE4 Project – Reuse and Recycling of CDW materials and structures in energy efficient pREfabricated elements for building Refurbishment and construction, European Union’s Horizon 2020 research project. Final version, 396 p.
Courard, L., Rondeux, M., Zhao, Z., Michel, F., Fine recycled C&DW particles: characterization and specific properties. Waste Management (under reviewing).
Deloitte France, 2015. Screening template for Construction and Demolition Waste management in France. Version 2, September 2015, 55 p.
Deloitte Germany, 2015. Screening template for Construction and Demolition Waste management in Germany. Version 2. September 2015, 55 p.
Deloitte Luxembourg, 2015. Screening template for Construction and Demolition Waste management in Luxembourg. Version 2. September 2015, 34 p.
Deloitte, 2016. Background paper. Workshop “Improving management of construction and demolition waste”, Brussels, 25 May 2016, 26 p.
(a) Delvoie, S., Zhao, Z., Michel, F., Courard, L., 2018. WPT1: market analysis and formal regulations in NWE. Interreg NWE SeRaMCo project, June 2018, 81 p.
(b) Delvoie, S., Zhao, Z., Michel, F., Tabarelli, E., Courard, L., 2018. Comparaison des techniques de recyclage pour la production de sables et de granulats recyclés. NoMaD 2018, Nouveaux Matériaux et Durabilité, Liège, 7-8 novembre 2018, 10 p.
Delvoie, S., Zhao, Z., Michel, F., Courard, L., 2019. Market analysis of recycled sands and aggregates in North-West Europe: drivers and barriers. IOP Conference Series: Earth and Environmental Science, 225, 8 p. (http://hdl.handle.net/2268/228444).
EIB (2016). EIB Economisch Instituut voor de Bouw (2016) Macro-economische verkenning betonakkoord. Retrieved from https://www.eib.nl/publicaties/mkba/macro-economische-verkenning-betonakkoord/
Directive 2008/98/EC. 19 November 2008 – Waste Framework Directive 2008/98/EC.
European Commission, 2017. CDW: Material recovery & backfilling. Consultation on Dec, 15th, 2017. http://ec.europa.eu/environment/waste/construction_demolition.htm.
European Parliament and the Council of the European Union, 2008. Directive 2008/98/EC of the European Parliament and of the Council of 19 November 2008 on waste and repealing certain Directives. Official Journal of the European Union, English version, L312/3 – L312/30. Eurostat, 2017. Waste statistics. Retrieved from https://ec.europa.eu/eurostat/statistics-
explained/index.php/Waste_statistics#Waste_treatment, accessed 12/09/2018
Garbarino, E., Blengini, G.A., 2013. The economics of construction and demolition (C&DW) management facilities. In: Pacheco-Torgal F, Tam V W Y, Labrincha J A, Ding Y and de Briton J (Eds). Handbook of Recycled Concrete and Demolition Waste, Woodhead Publishing Series in Civil and Structural Engineering, Number 47, Woodhead Publishing Limited, Cambridge, UK, 672 p.
Grellier, A., Bulteel, D., Zhao, Z., Remond, S., Courard, L., 2020. Characterization of fine recycled bricks: development of hydraulic binders. 10th ACI/RILEM International Conference on Cementitious Materials and Alternative Binders for Sustainable Concrete. Toulouse (accepted for publication).
Hoen, J., 2017. Rapportage Monitoring bouwgrondstoffen 2015-2016. H2H advies, Arnhem, the Netherlands, 16 p.
Less, S., 2012. Loi du 21 mars 2012 relative à la gestion des déchets – Transposition en droit national de la directive européenne 2008/98/CE. Division des déchets, Administration de l’environnement, Ministère du Développement durable et des infrastructures, Gouvernement du Grand-Duché de Luxembourg, 22 May 2012, Luxembourg, oral presentation.
Mariage, T., 2018. Évolution de la gestion des déchets de démolition. des déchets valorisables en construction et des terres excavées dans le cadre de la nouvelle économie circulaire. Colloque ECOCIR, 25 May 2018, Namur, Belgium.
Muller, D., Schreiner, M., 2015. Besser planen weniger baggern – Wege zur vermeidung und wiederverwertung von erdaushub bei bauarbeiten. Le Gouvernement du Grand-Duché de Luxembourg, Ministère du Développement durable et des Infrastructures, Administration de l’environnement, Esch-sur-Alzette, Luxembourg, 19 p.
MVO Nederland, 2017. Betonakkoord (Concept). Retrieved from https://mvonederland.nl/betonakkoord/documenten
OVAM, Vervaert M, Segers N, Van Hasselt D and Smeets K, 2016. Bedrijfsafvalstoffen productiejaar 2004-2014 (uitgave 2016), 45p. Retrieved from
http://www.ovam.be/bedrijfsafvalstoffen.
Order 17 December 1997. Order of the Flemish government for the establishment of the Flemish regulations relating to waste prevention and management. Retrieved from http://www.ejustice.just.fgov.be/cgi/article_body.pl?language=fr&caller=summary&pub_dat e=98-04-16&numac=1998035290.
RDC environment, 2010. Evaluation ex-post des actions et mesures prévues dans le Plan Wallon des déchets Horizon 2010 – Volet déchets industriels, 138 p.
Silva, R.V., de Brito, J., Dhir, R.K., 2017. Availability and processing of recycled aggregates within the construction and demolition supply chain: A review. Journal of Cleaner Production 143, 598-614.
SPW-DG03, 2017. Plan wallon des déchets-ressources. Projet de PWD-R, enquête publique du 8 mai au 21 juin 2017, 387p. Retrieved from dechetsressources.
Tabarelli, E., 2018. Recycling of crushed bricks for self-compacting mortar. Master thesis for Master's degree in Geological and Mining Engineering, University of Liège, 113p.
Thapa, V. B., Waldmann, D., 2014. Use of recycled concrete in construction in Luxembourg. Revue technique luxembourgeoise, 2, 17-19.
UEPG, 2016. Estimates of Aggregates Production data 2016. Retrieved from
http://www.uepg.eu/statistics/estimates-of-production-data/data-2016
UEPG, 2017. European Aggregates Association – Annual Review 2016-2017, Brussels, Belgium, 30 p.
Ulubeyli, S., Kazaz, A., Arslan, V., 2017. Construction and demolition waste recycling plants revisited: management issues. Procedia Engineering 172, 1190-1197.
UNPG, 2018. L’industrie Française des Granulats, édition 2017/2018, données 2016, UNPG-UNICEM. www.unpg.fr
Vrijders, J., 2015. De nieuwe uitdagingen & mogelijkheden voor het beheer van bouw- en sloopafval. Bouw- en sloopafval: nieuwe uitdagingen. Tweedaagse studiedag. 19 March 20.
Zhao, Z., Courard, L., Michel, F., Remond, S. Damidot, D., 2018. Influence of granular fraction and origin of recycled concrete aggregates on their properties. European Journal of Environmental and Civil Engineering 22(12), 1457-1467. (https://doi.org/10.1080/19648189.2017.1304281)
Table 2. Quantitative data on the market of recycled and natural sands and aggregates in NW European countries. Abbreviations: C&DW = construction and demolition wastes; CBTC = concrete-bricks-tiles-ceramics; N/A = not applicable; RA = recycled aggregates; RS = recycled sands; modified from Delvoie et
al. (a), 2018.
Belgium France Germany Luxembourg Netherlands Flanders Wallonia Brussels Belgium
Waste
production Quantity of inert C&DW excl. soils, sands and gravels (in Mt/yr)
15 5-7 0.5 ~22 64 83.5 0.5-0.6 23.2
Quantity of inert C&DW excl. soils, sands and gravels
(in t/capita)
2.3 1.4-2.0 0.4 ~1.9 1.0 1.0 0.9-1.0 1.4
Quantity of CBTC (in Mt/yr) 12.6 4.1-5.7 0.4 17.1-18.7 ~38 54.6 0.25-0.3 19-20 Quantity of CBTC (in t/capita) 2.0 1.1-1.6 0.3 1.5-1.6 ~0.6 0.7 0.4-0.5 1.1-1.2 RA & RS
production Quantity RA & RS (in Mt/yr) 13 3.5 ~0 16.5 21.4
a 66 1.8b 18c
Quantity RA & RS (in t/capita) 2.0 1.0 ~0 1.5 0.3a 0.8 3.1b 1.0 c
Proportion of RA & RS compared to the quantity of inert C&DW (excl. soils, sands and gravels) (in %)
87 50-70 ~75 33a 79 78 c
Proportion of RA & RS compared to total
production of sands & aggregates (in %) 46 6 18-20 7
a 13 18-25d
Landfilling Ban for inert C&DW landfilling Yes Yes N/A N/A No No No Yes C&DW
recycling plants
Number of recycling plants
~200-250 ~100 ~350 ~400 2,073 ~30 ~150
Type of facilities 80%
stationary, 20% mobile
Mainly mobile 35% crushing, 20% sorting, 45% crushing & sorting Density of recycling plants (per 1,000 km²) ~16 ~5 ~11 ~0.6 ~6 ~12 ~4
a The French production of recycled sands and aggregates is largely underestimated since the quantity of on-site recycled materials in not taken into account in the national statistics and
is difficult to estimate accurately.
c The referred quantity of recycled sands and aggregates in the Netherlands is produced by BRBS’s members (national federation of C&DW recyclers). This quantity could be slightly
underestimated.
d The referred data is calculated for the regular extraction activity of natural materials in the Netherlands.
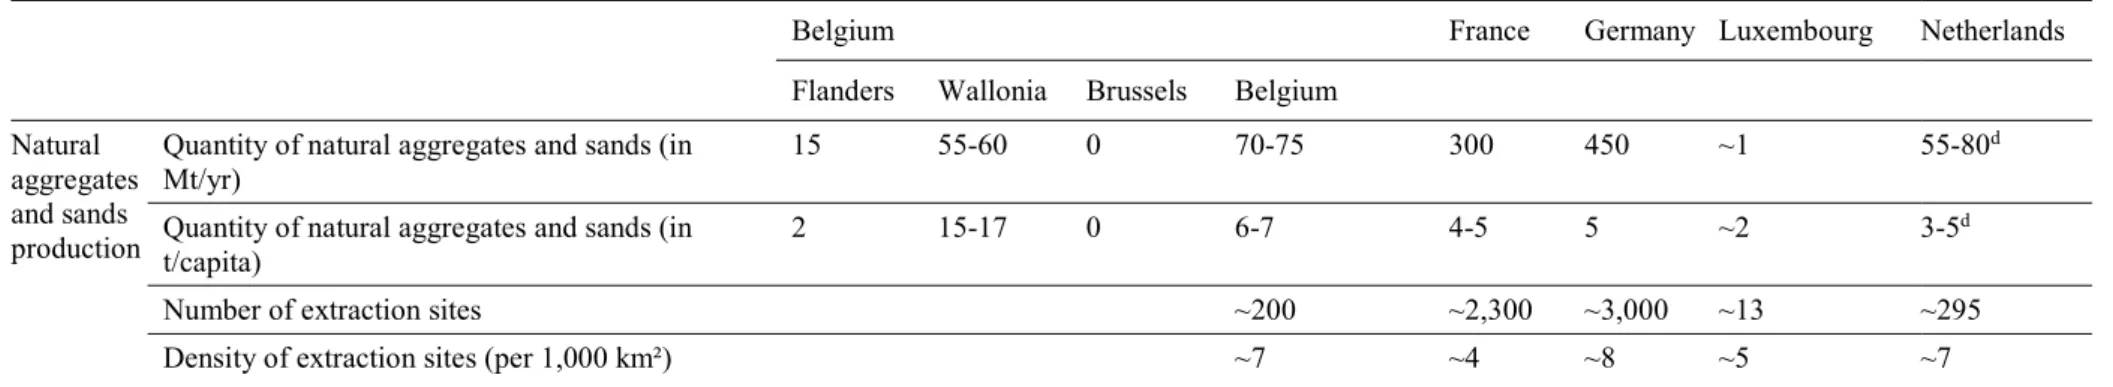
Table 2 (continued). Quantitative data on the market of recycled and natural sands and aggregates in NW European countries. Abbreviations: C&DW = construction and demolition wastes; CBTC = concrete-bricks-tiles-ceramics; N/A = not applicable; RA = recycled aggregates; RS = recycled sands; modified
from Delvoie et al. (a), 2018.
Belgium France Germany Luxembourg Netherlands Flanders Wallonia Brussels Belgium
Natural aggregates and sands production
Quantity of natural aggregates and sands (in Mt/yr)
15 55-60 0 70-75 300 450 ~1 55-80d
Quantity of natural aggregates and sands (in
t/capita) 2 15-17 0 6-7 4-5 5 ~2 3-5
d
Number of extraction sites ~200 ~2,300 ~3,000 ~13 ~295 Density of extraction sites (per 1,000 km²) ~7 ~4 ~8 ~5 ~7
a The French production of recycled sands and aggregates is largely underestimated since the quantity of on-site recycled materials in not taken into account in the national statistics and
is difficult to estimate accurately.
b The referred quantity of recycled sands and aggregates in Luxembourg is largely overestimated since it includes excavated soils, sands and gravels.
c The referred quantity of recycled sands and aggregates in the Netherlands is produced by BRBS’s members (national federation of C&DW recyclers). This quantity could be slightly
underestimated.