COMPARISONS BETWEEN SCIAMACHY SCIENTIFIC PRODUCTS AND
GROUND-BASED FTIR DATA FOR TOTAL COLUMNS OF CO, CH4 AND N2O.
M. De Mazière(1), B. Barret(1) *, T. Blumenstock (2), M. Buchwitz(11),R. De Beek(11), P. Demoulin (5), H. Fast (3), A. Gloudemans(12), A. Griesfeller(2), D. Griffith (4) ,D. Ionov(13), K. Janssens (1), N. Jones (4), E. Mahieu (5), J. Mellqvist (6), R. L. Mittermeier (3), J. Notholt (11), C. Rinsland (8), H. Schrijver(12), A. Schultz(7), D. Smale (9),
A. Strandberg(6), K. Strong(14), R. Sussmann (10), T. Warneke(11), S. Wood (9)
(1) Belgian Institute for Space Aeronomy, Brussels, Belgium; Email: martine@oma.be (2)Forschungszentrum Karlsruhe, IMK, Germany
(3) Meteorological Service of Canada (MSC), Downsview, Ontario, Canada (4) University of Wollongong, New South Wales, Australia
(5) Institut d'Astrophysique et de Géophysique, Liège, Belgium
(6) Chalmers University of Technology, Radio & Space Science, Göteborg, Sweden (7) Alfred Wegener Institute for Polar and Marine Research (AWI), Potsdam, Germany
(8) NASA Langley Research Center, Hampton, VA, USA (9) National Institute for Water and Air Research (NIWA), New-Zealand
(10)Forschungszentrum Karlsruhe, IFU, Germany
(11) Institute of Environmental Physics, University of Bremen, FB1,Germany (12) Space Research Organisation of the Netherlands (SRON), Utrecht, The Netherlands
(13) University of S Petersburg, Russia (14) University of Toronto, Canada
* now at the Free University of Brussels
ABSTRACT
Total column amounts of CO, CH4 and N2O retrieved from
SCIAMACHY nadir observations in its near-infrared channels have been compared to data from a ground-based network of Fourier-transform infrared (FTIR) spectrometers as well as to data obtained with an FTIR instrument during a ship cruise in January-February 2003, along the African West Coast. The SCIAMACHY data considered here have been produced by two different scientific retrieval algorithms, wfm-doas (version 4.0) and IMLM (version 5.1), and cover different time periods, making the number of reliable coincidences that satisfy the temporal and spatial collocation criteria rather limited and different for both. Also the quality of the SCIAMACHY Level 1 data, and thus of the Level 2 data for the different time periods is very different. Still the comparisons demonstrate the capability of SCIAMACHY, using one of both algorithms, to deliver geophysically valuable products for the target species under consideration, on a global scale.
1. INTRODUCTION
The SCIAMACHY instrument onboard ENVISAT has the potential to make nadir observations in the near-infrared (NIR; 0.8–2.38 µm) of the most important greenhouse gases that are water vapour (H2O), carbon dioxide (CO2),
methane (CH4), and nitrous oxide (N2O), and of the ozone
precursor gas carbon monoxide (CO). This is an important advantage of SCIAMACHY on GOME. SCIAMACHY will be among the first satellite instruments - next to MOPITT/Terra that is limited to CO measurements and IMG/ADEOS that failed after a few months of operation in 1997 - to measure these species on a global scale, down to the earth surface. It is very important therefore to thoroughly investigate the potential capabilities of SCIAMACHY in its NIR channels. As official operational products for these target species are not mature yet for validation, the Atmospheric Chemistry Validation team (ACVT) has focused on the validation of scientific data products generated by various scientific institutes in Europe. The purpose of the current validation exercise is to identify to what extent the SCIAMACHY NIR products can be exploited for global geophysical studies. It therefore addresses the consistency of the data to represent the variability of the CO, CH4 and N2O fields with season,
latitude, surface altitude, etc. This is done by comparing the available SCIAMACHY data with correlative, i.e., close in space and time, independent data obtained from different space- and air-borne as well as ground-based observations, and possibly from model results.
This paper focuses on comparisons of wfm-doas v4.0 (Weighting Function Modified DOAS, Institute for Environmental Physics, University of Bremen, [1]) CO, CH4
_______________________________________________________
Proceedings of the Second Workshop on the Atmospheric Chemistry Validation of ENVISAT (ACVE-2) ESA-ESRIN, Frascati, Italy, 3-7 May 2004 (ESA SP-562, August 2004) ESC02MDM
and N2O total column data products and the IMLM v5.1
(Iterative Maximum Likelihood Method, SRON, [2]) CO and CH4 total column data products with correlative remote
sensing ground-based total column observations made by Fourier-transform or grating infrared spectrometry.
For more information about the SCIAMACHY retrieval algorithms and data products, the reader is referred to the references cited mentioned. The correlative ground-based data are briefly presented in Section 2. Section 3 discusses the conditions under which the comparisons between the different data sets have been performed. Section 4 discusses the comparison results, and makes references to the description of the SCIAMACHY data products in references [1] and [2], and to their comparisons with independent satellite (MOPITT) and model data, as discussed in the paper by Gloudemans et al. in this same volume [3]. Conclusions are summarized in Section 5. 2. GROUND-BASED CORRELATIVE DATA Most of the ground-based (g-b) correlative data are collected from a large number of FTIR spectrometers that are operated at various stations of the Network for the Detection of Stratospheric Change (NDSC, http://www.ndsc.ws). They have been submitted to the Envisat Cal/val database at NILU and have been compiled at BIRA-IASB [4]. Fig. 1 and Table I identify the locations of the contributing stations.
In addition, the discussion includes some comparisons with FTIR data from a ship cruise along the West coast of Africa that took place between January 25 and February 9, 2003 (Fig. 2) in a collaboration between the Alfred-Wegener Institute and the University of Bremen.
Infrared grating spectrometer data for CO and CH4 total
column amounts that are available from three locations in Russia, namely Zvenigorod (37°E, 56°N), St Petersburg (30°E, 60°N) and Obninsk (36°E, 55°N) can be included in future comparisons [D. Ionov, Univ. St Petersburg, private communication].
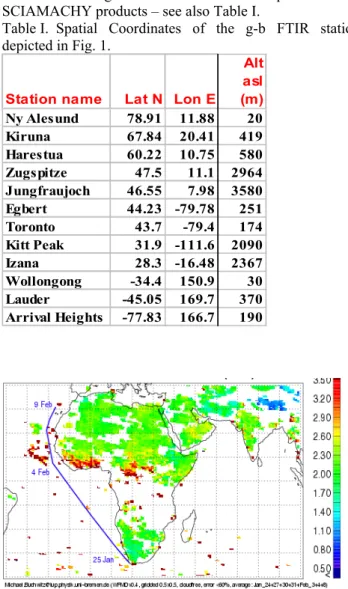
Fig. 1 Distribution of stations contributing to the delivery of correlative g-b FTIR data for comparisons with SCIAMACHY products – see also Table I.
Table I. Spatial Coordinates of the g-b FTIR stations depicted in Fig. 1.
Station name Lat N Lon E
Alt asl (m) Ny Alesund 78.91 11.88 20 Kiruna 67.84 20.41 419 Harestua 60.22 10.75 580 Zugspitze 47.5 11.1 2964 Jungfraujoch 46.55 7.98 3580 Egbert 44.23 -79.78 251 Toronto 43.7 -79.4 174 Kitt Peak 31.9 -111.6 2090 Izana 28.3 -16.48 2367 Wollongong -34.4 150.9 30 Lauder -45.05 169.7 370 Arrival Heights -77.83 166.7 190
Fig. 2. Trajectory of the ship cruise providing 5 days of FTIR observations overlapping with SCIAMACHY data. The colour code indicates the total amount of CO observed by SCIAMACHY (wfm-doas v4.0 for cloud-free pixels) St Petersburg
Zvenigorod
Obninsk The g-b FTIR data are mostly obtained from daytime solar absorption measurements under clear-sky conditions. Only in polar night conditions at high northern and southern latitude stations, one must obtain the data from lunar absorption measurements (at near full noon only). Such lunar absorption data are not included however in the present dataset.
The database of correlative g-b FTIR data that has been compiled at BIRA by May 2004 for the purpose of the
intercomparisons with SCIAMACHY NIR products is presented in Figures 3 to 5.
Fig. 3 Status on April 30, 2004, of the database of correlative CO total column data from the g-b FTIR network. CO total column amounts have been reduced to zero surface altitude (see text).
Fig. 4 Same as Fig. 3 but for CH4, reduced to zero
surface altitude.
Two points must be noted.
(1) The first one concerns the amount of available g-b data: one must remember that g-b FTIR data do not represent a daily coverage, even if most stations are operated on a quasi-continuous basis, because the observations require clear-sky conditions. This limits of course the number of possible coincidences with SCIAMACHY overpasses. It must also be underlined that the correlative database essentially spans the period mid-July 2002 to end of April 2003. The criteria used for selecting the periods for the processing of the SCIAMACHY scientific products have
not necessarily been to look for best overlap with the correlative databases. In particular, the IMLM data set available for the exercise discussed here covers about the same period as the correlative FTIR g-b database, but the wfm-doas v4.0 data set covers essentially January to October 2003. Therefore again, the number of good coincidences is rather limited, as will become evident in the next sections.
Fig. 5 Same as Fig. 3 but for N2O, reduced to zero surface
altitude.
(2) The second one concerns a normalisation with altitude that has been applied to all data included: because the target molecules have most of their total concentration in the lower troposphere, the total column amount is strongly dependent on the observatory’s altitude (alt_obs). To eliminate any apparent differences or variations in the data set that are due to this station’s altitude dependence, we have normalised all data to sea level altitude, using the following simplified formula: C_0 = C_Z*exp(Z/7.4). Herein Z is the station’s altitude (in km), C_Z is the observed total column amount, and C_0 is the corresponding reduced (to sea level) total column amount. The same normalisation has been applied to the overpass SCIAMACHY data, Z then being the mean altitude of the observed ground pixel.
The g-b FTIR data (Fig. 4) clearly illustrate the hemispheric gradient of CH4 that amounts to 20% going from the South
Pole (Arrival Heights) to northern mid-latitudes (Egbert). One also observes a seasonal variation that is more distinct in the northern hemisphere than in the southern one; the CH4
minimum in the northern hemisphere occurs around day 1100 (MJD2000), i.e., around mid-winter.
Regarding CO (Fig. 3) seasonal variations are quite pronounced (amplitude of order 50%), with a maximum by the end of local spring. One also notices that the
Wollongong site is subject to variable enhancements of CO, that are due to nearby biomass burning events.
N2O has a very small variability, and almost no seasonal
nor latitudinal dependence. The variability over the entire data set is less than 15%.
Table II provides estimates of the mean precisions and accuracies of the g-b total column data used in this work – before normalisation. It is clear that the applied normalisation in its simplified form induces some additional uncertainty on the reduced column amounts that may be as large as 16%.
Table II. Estimated precisions and accuracies of g-b FTIR data for CO, CH4 and N2O total column amounts.
Accuracy (%) Precision (%)
CO 7 2-4
CH4 10 1-3
N2O 2.5 2-3
3. COMPARISON CONDITIONS.
The present data products for SCIAMACHY are reliable only for cloud-free pixels [1, 2]. Cloud detection schemes are different for both algorithms [1, 2, 3] resulting in different cloud masks that in some cases do not mask all cloudy pixels. This implies that some comparisons with g-b FTIR data may still suffer from the presence of clouds in the SCIAMACHY observation.
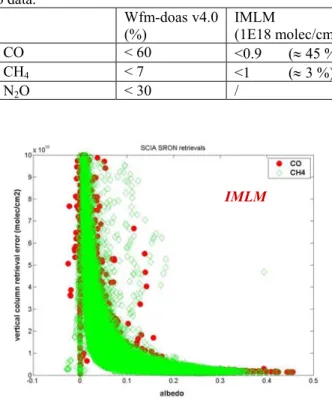
In addition to that, the precision of the cloud-free SCIAMACHY data is strongly influenced by the albedo of the observed ground-pixel, because it determines to a large extent the signal-to-noise ratio of the corresponding observed spectra. This explains why data over ocean (water) are less reliable than data over land. The impact of the albedo on the retrieval precision can be seen clearly in Figures 6 and 7, that plot the absolute or percentage vertical column retrieval error versus theoretical albedo (for the IMLM dataset) or versus sun-normalised radiance (for the wfm-doas data). The latter is proportional to the observed radiance versus the solar irradiance - thus also some measure of the albedo. The retrieval error rises very rapidly below a certain threshold value of the albedo. Based on these figures, error thresholds have been imposed on the SCIAMACHY data that are included in the comparisons, as listed in Table III.
It shouldn‘t be surprising that the accepted error levels are different for both algorithms, because both estimate the errors differently. WFM-DOAS includes spectral fit errors in the final error estimate, whereas the error reported by
IMLM only accounts for instrument errors, and therefore appears to be smaller.
Table III Error selection criteria (i.e., accepted error levels) for SCIAMACHY data included in the comparisons with g-b data.
Wfm-doas v4.0
(%) IMLM (1E18 molec/cm2)
CO < 60 <0.9 (≈ 45 %) CH4 < 7 <1 (≈ 3 %)
N2O < 30 /
IMLM
Fig. 6 Correlation plot of absolute retrieval errors versus albedo, for the SCIAMACHY products CO and CH4 obtained using the IMLM algorithm.
wfm-doas v4
Fig. 7 Correlation plot of percentage retrieval errors versus sun-normalized radiance, for the SCIAMACHY products CO, CH4 and N2O obtained using the wfm-doas v4 algorithm.
As has been said already in Section 2, the SCIAMACHY wfm-doas and IMLM data sets considered for the present comparisons cover different time periods, namely 2003 for the former one, and July 2002 to end of April 2003 for the latter one, for which the quality of the SCIAMACHY data is very different. The data from 2003 are expected to have a better quality because of a thinner ice layer on the detectors and a better correction for the dark signal [3].
The criteria adopted for temporal and spatial ‘collocation’ stem from choosing the best compromise between achieving better or worse statistics and keeping more or less natural variability in the data. For the ship cruise, spatial collocation has been defined as data being within ± 1.5° latitude of each other, and as close in longitude as possible. For the g-b FTIR network data, spatial collocation has been defined as data being within ± 2.5° latitude and ± 10° longitude of each other. Data that have been taken closer to each other (within ± 2.5° latitude and ± 5° longitude of each other, and with a (mean) ground level of the column within ± 250m) have been looked at in particular. In all cases, temporal collocation has been defined as data taken on the same day.
Especially the spatial collocation criteria adopted here are loose; however making them more stringent would have made the number of coincidences insignificant.
So, in summary, the comparisons are limited to (1) cloud-free SCIAMACHY data, according to the individual cloud detection schemes from both algorithms, and (2) below their individual retrieval error thresholds, and (3) g-b data taken on the same day as the SCIAMACHY overpass data, (4) within the spatial collocation circle from the centre of the SCIAMACHY pixel, as outlined here above.
4. COMPARISON RESULTS.
4.1 Comparisons between ship-cruise and wfm-doas v4 data of CO, CH4 and N2O
Figures 8 (a) to (c) show the latitudinal data series of ship cruise FTIR data versus collocated SCIAMACHY data for CO, CH4 and N2O, respectively. The collocation and error –
based rejection criteria are as explained in the previous section. One observes in general more variability in the SCIAMACHY data over sea. Focusing on the SCIAMACHY data over land, it is obvious that SCIAMACHY reproduces the latitudinal variability. Especially for CO, where a large enhancement has been observed in the northern tropics that could be identified (using MODIS fire maps and trajectory calculations) as being due to biomass burning, SCIAMACHY agrees reasonably with the FTIR data. At present, it is difficult to
identify what percentage of the residual scatter in the SCIAMACHY data (that may be as large as 300% for CO in some points) can be attributed to the expected natural variability within the collocation circle, and what percentage is representative of the residual uncertainty on the SCIAMACHY data.
(a)
(b)
(c)
Fig.8 Comparison between SCIAMACHY (wfm-doas v4) data (red and blue diamonds, over land and sea, resp.) and FTIR data from the Jan-Feb 2003 ship cruise (black squares), as a function of latitude, for total columns of (a) CO, (b) CH4, and (c) N2O.
4.2 Comparisons between g-b FTIR network and SCIAMACHY data of CO, CH4 and N2O total column amounts.
In the next sections time series of differences between SCIAMACHY and g-b FTIR network data, i.e., [ (SCIA-FTIR ) /(SCIA-FTIR ] in percentage values, are shown for the
different SCIAMACHY algorithms and different target products. The g-b FTIR data included are daily mean values; the uncertainty associated with them is the one standard deviation value of the set of individual results for that day. The SCIAMACHY data are the mean values over all collocated SCIAMACHY pixels for that day; the uncertainties associated with them are weighted standard deviations of the individual data, with the weight of each data being the inverse square of the associated error. The error bar associated with the percentage difference values in the figures results from taking into account the above uncertainties.
4.2.1 CO
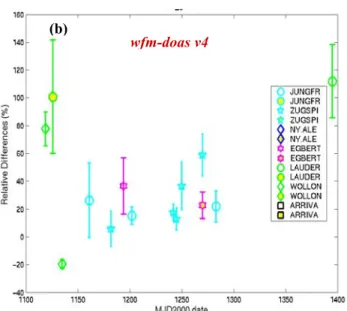
Figures 9 (a) and (b) show relative differences between SCIAMACHY total column amounts of CO and g-b FTIR network observations, with SCIAMACHY data retrieved using the IMLM algorithm, in (a), and using the wfm-doas v4 algorithm, in (b).
Apart from a few outliers, the differences seem to be aligned within the +5 to +60% values for the latter, and within -20 to -40% values for the former.
Two of the outliers, in (b), showing relative differences of about 100% occur at Lauder: it should be verified whether the SCIAMACHY data happen to be taken over sea, and therefore are less reliable. Some more dispersion in the relative differences is also observed at Wollongong: this is probably due to the larger natural CO variability observed at this station and in its neighbourhood, as explained with Figure 3.
(b)
wfm-doas v4
Fig. 9 Time series of relative differences (in %) between SCIAMACHY total column amounts of CO and g-b FTIR network observations (SCIA-FTIR)/FTIR, with SCIAMACHY data retrieved using IMLM, in (a), and using wfm-doas v4, in (b). The various symbols identify comparisons at different stations, according to the legend. Yellow-filled symbols indicate closest spatial coincidences, as explained in the text (within ± 2.5° latitude and ± 5° longitude of each other, and with (mean) ground levels of the observed columns within ± 250m).
Because the comparison data set spans different seasons as well as different northern and southern latitudes, one may conclude that latitudinal and seasonal dependences are well reproduced by SCIAMACHY. The absolute ‘offset’ values are not significant for the WFM-DOAS data because the data have been scaled according to a chosen reference [1].
IMLM (a)
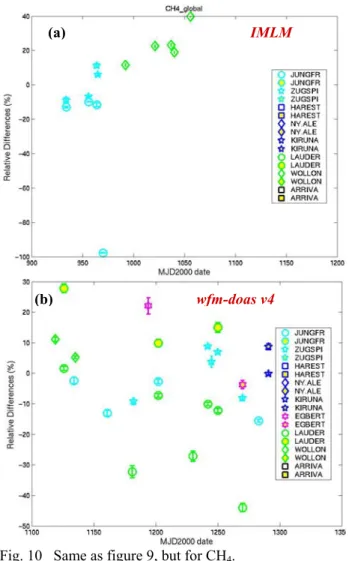
4.2.2 CH4
Similar to section 4.2, Figures 10 (a) and (b) show relative differences between SCIAMACHY total column amounts of CH4 and g-b FTIR network observations, with
SCIAMACHY data retrieved using the IMLM algorithm, in (a), and using wfm-doas v4, in (b).
Fig. 10 Same as figure 9, but for CH4.
Apart from a few outliers, the differences seem to be confined within the -35 to +25% values for the latter (the bulk of the data being between -20 and +20%) and within the -15 to +25 % values for the former.
As for CO, one may conclude that latitudinal and seasonal dependences of CH4 are well reproduced by SCIAMACHY.
4.2.3 N2O
For N2O, only wfm-doas v4 data have been available for
the present study. Figure 11 shows the relative differences between the SCIAMACHY wfm-doas v4 total column amounts of N2O and g-b FTIR network observations. The
observed differences are somewhat (a factor of 2) larger than the expected natural variability of N2O (see Fig. 5),
indicating that some residual retrieval errors persist.
wfm-doas v4 IMLM
(a)
Fig. 11 Same as figure 9, but for N2O and wfm-doas v4
data only.
wfm-doas v4 (b)
5. CONCLUSIONS
The present comparisons between SCIAMACHY scientific data products for CO, CH4 and N2O total column amounts
have demonstrated the capability of the SCIAMACHY instrument to detect these important atmospheric species. They show that scientific teams have made a huge progress to develop retrieval algorithms that succeed in deriving the concentrations of these species from the instrument’s NIR channels, despite the calibration problems inherent with these NIR spectra [1,2,3]. The actual status of the products discussed here (wfm-doas v4.0 and IMLM) is such that related geophysical studies on a global scale can be initiated, at least from a qualitative perspective. Remaining quantitative uncertainties (less than 50% at worst) will probably be reduced in future algorithm improvements, having acquired a better comprehension of the instrument/spectral problems.
It must be stressed once more that the actual conclusions are based on a limited number of data coincidences, that the collocation criteria were not very stringent, meaning that part of the observed discrepancies can probably be attributed to natural variabilities, and that an approximative correction for the surface altitude has been applied that may add additional uncertainties of the order of 10%. Some comparisons may still suffer from the presence of clouds because of imperfect cloud algorithms associated to the satellite data retrievals. Additional features that have not been taken into account in the comparisons are possible sensitivity differences due to different total column averaging kernels, spectroscopic uncertainties, etc.
Based on the conclusions drawn here and in other papers in this same volume, one can state that SCIAMACHY provides an added value to the actually deployed fleet of
satellite instruments, especially for tropospheric chemistry research on a global scale.
ACKNOWLEDGMENTS
This work has been performed in the frame of the Envisat AOID126 ‘Validation of ENVISAT-1 level-2 products related to lower atmosphere O3 and NOy‘, and the EC
project EVERGREEN. It has been possible thanks to financial support from ESA, the European Commission, the Belgian Federal Science Policy Offices and PRODEX. The work could not have been carried out without the scientific and technical support from J.-C. Lambert, T. Jacobs, J. Granville and P. Gérard at the Belgian Institute for Space Aeronomy.
REFERENCES
1. Buchwitz, M. et al., A near-infared optimized DOAS method for the fast global retrieval of atmospheric CH4, CO, CO2, H2O and N2O total column amounts from SCIAMACHY Envisat-1 nadir radiances, J. Geophys. Res., 105 (D12), 15231-15245, 2000.
Buchwitz, M. et al., Global Carbon monoxide as retrieved from SCIAMACHY by WFM-DOAS, Atmos. Chem. Phys. Discuss. , submitted, 2004.
2. Schrijver H., Retrieval of carbon monoxide, methane and nitrous oxide from SCIAMACHY measurements, European Symposium on Atmospheric Measurements from Space, ESA WPP-161 1, ESTEC, Noordwijk, The Netherlands, 285—294, 1999
3. Gloudemans, A., et al., CH4 and CO total columns from SCIAMACHY: comparisons with TM3 and MOPITT, this volume, 2004.
4. This work has been carried out as part of the commitment in the Envisat AO ID 126 ‘Validation of ENVISAT-1 level-2 products related to lower atmosphere O3 and NOy