arXiv:astro-ph/0408055v2 5 Aug 2004
1
SOLAR MODEL WITH CNO REVISED ABUNDANCES
J. Montalb´an1, A. Miglio1, A. Noels1, N. Grevesse1, and M.P. Di Mauro2 1Institut d’Astrophysique et G´eophysique de l’Universit´e de Li`ege, Belgium
2INAF, Osservatorio Astronomico di Catania, Italy
ABSTRACT
Recent three-dimensional, NLTE analyses of the solar spectrum have shown a significant reduction in the C, N, O and Ne abundances leading to a Z/X ratio of the or-der of 0.0177. We have computed solar models with this new mixture in the OPAL opacity tables. The present He abundance we find seems rather consistent with the helio-seismic value. However, the convective envelope is too shallow, and diffusion, even if it reduces the discrepancy, is not able to give the current value. We present some nu-merical experiments consisting in changing the diffusion velocities and/or the value of opacity at the base of the convective envelope.
Key words: Sun: abundances, modelling, interior.
1. MODELLING THE SUN
The whole set of models presented here has been pro-duced using the stellar structure and evolution code CLES (Code Li´egeois d’Evolution Stellaire): OPAL01 EOS; OPAL96 opacity tables plus Alexander & Fer-guson (1994) at T < 6000 K; nuclear reaction rates from Caughlan & Fowler (1988); MLT convection treat-ment; microscopic diffusion of all the elements using the subroutine by Thoul et al. (1994); atmospheric boundary conditions given by Kurucz (1998) at T = Teff. We
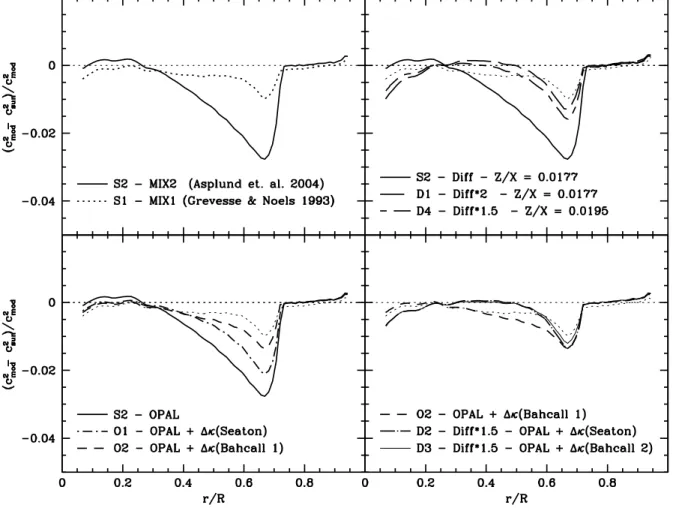
have used the revised O (Asplund et al. 2004a) C, N and Ne abundances (Asplund et al. 2004b) (MIX2). EOS and opacity tables have been constructed with this mix-ture. The calibrated model (model S2, see table 1) is very different from the one (model S1) obtained with the Grevesse & Noels (1993) mixture (MIX1) with regards to the distribution of the sound speed as can be seen in Fig. 1a.
We have tried different numerical experiments in order to reduce this discrepancy:
• The OPAL opacity near the base of the convective zone has been increased in three different ways.
In models labeled Seaton (model O1), the differ-ences between the revised OP and OPAL opacities (Seaton & Badnell, 2004) near 2.106 K are taken into account (Fig. 2, solid line). Models labeled Bahcall 1 and Bahcall 2 are constructed according to the suggestion from Bahcall et al. (2004)1 (Fig. 2, long dashed-dashed and dashed lines). Figure 1b shows that the best agreement is obtained with Bah-call 1 (model O2) which means an increase of 14% in the opacity at the base of the convective envelope. This model is still far from the S1 model (dotted line in Fig. 1b).
• The diffusion velocities have been increased by fac-tors 1.5 and 2. Figure 1c shows that a better sound speed distribution can be reached either by multi-plying by a factor 2 the diffusion velocities (model D1) or by multiplying them by 1.5 and increasing the Z/X ratio by 10% (model D4) which is the pre-cision range for this ratio for the Sun.
• Figures 1b and 1c suggest that the best agreement is reached by increasing both the opacity at the base of the convective envelope and the diffusion velocities. Figure 1d shows the effect of an increase of ∼ 7% in the opacity (solid line and dashed line in Fig.2) and an increase in the diffusion velocities by 50% (models D2 and D3). Both results are much better than those obtained by only increasing the opacity by 14%.
We have checked that the new14N(p, γ)15
O astrophysi-cal S-factor (Formicola, A. & LUNA, 2004) has no effect on the solar calibration.
2. CONCLUSION
The numerical experiments presented here suggest that, in order to reduce the discrepancy between the squared
1At the time of this meeting, the authors kindly warned us about the fact that in an updated version of that paper the value 7% has been corrected and substituted by 21%.
2
Figure 1. Effects of changes in chemical composition, opacity and diffusion velocities on the error in the squared sound speed.
3
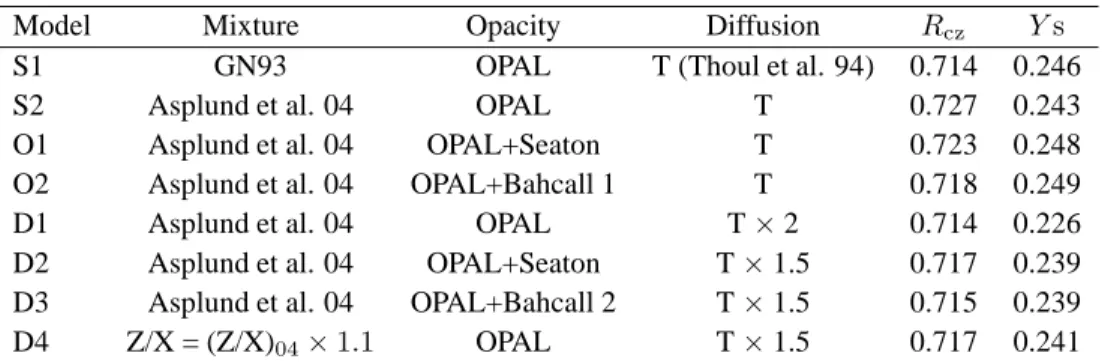
Table 1. Schematic description of the calibrated models according to their chemical composition, opacity, diffusion. The last two columns give the bottom of the convective zone and the He abundance at the surface.
Model Mixture Opacity Diffusion Rcz Ys
S1 GN93 OPAL T (Thoul et al. 94) 0.714 0.246
S2 Asplund et al. 04 OPAL T 0.727 0.243
O1 Asplund et al. 04 OPAL+Seaton T 0.723 0.248
O2 Asplund et al. 04 OPAL+Bahcall 1 T 0.718 0.249
D1 Asplund et al. 04 OPAL T × 2 0.714 0.226
D2 Asplund et al. 04 OPAL+Seaton T × 1.5 0.717 0.239
D3 Asplund et al. 04 OPAL+Bahcall 2 T × 1.5 0.715 0.239
D4 Z/X = (Z/X)04× 1.1 OPAL T × 1.5 0.717 0.241
Figure 2. Increases of the opacity (in %) used in our computations.
sound speed in the Sun (Basu et al., 2000) and that of a theoretical model with the revised C, N, O and Ne abun-dances, a moderate increase of the opacity (7%) at the base of the convective envelope should be accompanied by an increase in the diffusion velocities (50%) (models D2 and D3). Moreover, in these models, the depth of the convective zone is in agreement with the heliosismic value (0.713, Christensen-Dalsgaard et al. 1991) while the surface He abundance is only very slightly smaller (0.248, Richard et al. 1998). These results are equiva-lent to those obtained by Basu & Antia (2004) who mul-tiplied the diffusion coefficient by a factor 1.65, and in-creased the O abundance with respect to that one given by Asplund et al. (2004a) (that is, [O/H]=8.80 instead of 8.66).
ACKNOWLEDGMENTS
J.M., A.M. and A.N. acknowledge the support of the ESA–PRODEX contract 15448/01/NL/SFe(IC)-C90135.
REFERENCES
Alexander, D.E. & Ferguson, J.W., 1994, ApJ 437, 879 Asplund, M. , Grevesse, N., Sauval A.J., Allende Prieto, C.
Kiselman, D., 2004a, A&A 417, 751 Asplund, M. et al. 2004b (in preparation)
Bahcall, J. N., Serenelli, A.M., Pinsonneault, M.H., 2004, astro-ph/0403604v1
Basu, S., Antia, H.M., 2004, ApJ 606, L85
Basu, S., Pinsonneault M.,H., Bahcall, J.N., 2000, ApJ 529, 1084
Caughlan, G.R. & Fowler, W.A., 1988, A.D.N.D.T. 40, 283 Christensen-Dalsgaard, J., Gough, D.O., Thompson, M.J.,
1991, ApJ 378, 413
Grevesse, N., & Noels, A., 1993, in La formation des ´el´ements chimiques, eds. B. Hauck, S. Paltani, D. Raboud, AVCP, 205 Formicola, A. & LUNA, 2004, Physical Letters B, 591, 61 Kurucz, R.L. 1998, http://cfaku5.harvard.edu
Richard, O., Dziembowski, W.A., Sienkiewicz, R., Goode, P.R., 1998, A&A 338, 756
Seaton, M.,J., & Badnell, N.R., 2004, MNRAS (submitted) Thoul, A .A., Bahcall, J.N., Loeb, A., 1994, ApJ 421, 824