HAL Id: dumas-01108613
https://dumas.ccsd.cnrs.fr/dumas-01108613
Submitted on 23 Jan 2015
HAL is a multi-disciplinary open access
archive for the deposit and dissemination of sci-entific research documents, whether they are pub-lished or not. The documents may come from teaching and research institutions in France or
L’archive ouverte pluridisciplinaire HAL, est destinée au dépôt et à la diffusion de documents scientifiques de niveau recherche, publiés ou non, émanant des établissements d’enseignement et de recherche français ou étrangers, des laboratoires
Economic complexity and location of foreign firms in
China
Thomas Pernet
To cite this version:
Thomas Pernet. Economic complexity and location of foreign firms in China. Economics and Finance. 2014. �dumas-01108613�
E
CONOMIC COMPLEXITY AND LOCATION OF
FOREIGN FIRMS IN
C
HINA
Presented and Defended by: Thomas Pernet
⇤Université Paris 1 – UFR 02 Sciences Économiques Master 2 Recherche Économie de la Mondialisation
Supervised by: Sandra Poncet
June 06, 2014
Abstract
This paper uses a unique dataset covering 1998 to 2007 to evaluate the impact of economic complexity on the location of foreign direct investment in China. Results show that the amount of knowledge embedded in an industry is a key determinant to attract FDI. The findings also confirm the presence of agglomeration economies and this effect is more likely for non chinese foreign firms. The results are robust to different alternatives in the location decision, different sub-sample, to the inclu-sion of control variables such as those for industry linkages and others traditional determinants of FDI attraction.
Keywords: Foreign Direct investment, China, Economic complexity, Conditional logit, Agglomeration
JEL: F1, F23, O14
L’université de Paris 1 Panthéon-Sorbonne n’entend donner aucune approbation ni désapprobation aux opinions émises dans ce mémoire: elles doivent être considérées comme propre
à leur auteur.
The University of Paris 1 Panthéon-Sorbonne neither approves nor disapproves of the opinions expressed in this dissertation: they should be considered as the author’s own.
C
ONTENTS1 Introduction 4
2 Data and measurement 8
2.1 Data . . . 8
2.2 Variables . . . 11
2.2.1 Economic complexity . . . 11
2.2.2 Other variables . . . 15
3 Empirical strategy and results 18 3.1 Empirical strategy: conditional logit . . . 18
3.2 Results . . . 19
3.2.1 Baseline specification . . . 19
3.2.2 Sector intensity . . . 22
3.3 Robustness check . . . 23
4 Conclusion 25
1.
I
NTRODUCTIONSince the former speech of Deng Xiaoping in 1978, China has extraordinarily attracted billion dollar of foreign investment. Through those decades, the stock of Foreign Direct Investment from world major economies exceeds $760 billion. China became in 2009 the second largest recipient of offshore investment. (World report Investment, UNCTAD). Chinese government gives top priority to attract Foreign Direct Investment notably by enhancing the attractiveness of the territory through various policies. Multinational investments in China seek for profit maximization while this expected return depends much on the quality of the host location.
In recent years, literature on FDI focused on the role played by the human capital and institutional quality to explain attraction of FDI1. Major studies such as Cheng and Kwan (1999, 2000) used different proxies to capture the estimates of labor quality on FDI. Little evidences, however, show a dominant pattern concerning the human capital. One notable exception is Paloni et al (2001). They evaluated the hypothesis that quality of human capital can exerts a positive pressure on FDI. They found, indeed, that human capital played a significant role to entice FDI and this effect is gradual over time. Another study (Gao, 2002) used Chinese disaggregated provincial level data to assess the presence of skill labor as a substantial factor pulling FDI. Conversely to Cheng et al, this paper discovered that workers with better education are more trainable, and thus locations with better-educated workers are more likely to be preferred by FDI. But such studies do not assess precisely the knowledge of a choosing location.
Specifically, to conduct this study, estimation does not depend on formal variables to measure the impact of the host location’s quality. Instead, this paper is built on an
sive index, so-called economic complexity (Haussmann and Hidalgo, (2009, 2011)), which better captures the knowledge embedded in a society. Economic complexity emphasizes not only the knowledge held individually but also how a society is able to coordinate knowledge in order to make complex product. Economic complexity does not rely on the stock of knowledge or what is taught at school rather on what a society makes with this knowledge. The ability of a country to perform certain tasks or products mainly depends on the amount of capabilities it holds and especially on the possibilities it can make with these capabilities. Therefore, the productive structure of a country reveals crucial information about the economic progress. Previous researches indicate that foreign firms hold more technological advancement that makes them sensitive to the local availability of knowledge (Xu et al (2009), Dunning (1993), Luo (1999), Wang et al (2002)). Naturally, this paper addresses the question to what extent the economic complexity entices foreign direct investment.
China is a particularly interesting country in which to study FDI inflows. Since the late 1970, China has gone through two fundamentals changes. On the one hand, China turns to be a more opened country, on the other hand, experienced a transition from a ”command economy” to a market economy. Wei (2000) argues that economic transition in china implies a triple process of decentralization, globalization and marketization. The latters transformed the geographical concentration of China for two reasons. First, during the past decades, China has attracted billion of US dollar of foreign investment. Globaliza-tion, outlined by scholars (Fan et al (2003), Wen (2004)), re-enforced the agglomeration by increasing the uneven distribution of foreign investment. Some provinces received more than 10% of total FDI inflows whereas other central provinces obtained an amount close to 0. Second, marketization of the economy lead to a high concentration of manufacturing
activities and increased inter-firm linkages (He et al (2007)). By providing an assessment of the importance of complexity, this study can provide some guidance on the kind of policy instruments that can entice FDI in more disadvantaged provinces.
Recent studies on determinants of FDI in China were limited by the data collected by the China Bureau National of Statistic. Surveys conducted by the Chinese authorities were restraint to two-three years span2, which makes difficult temporal comparison. Head and Ries (1996) is one notable exception because they proposed estimation based on 8 years period covering 54 cities. Nevertheless, China has dramatically changed over time and so legislation. Legal statue for foreign invested enterprises is not restricted to joint venture, as in Head and Ries. For instance, some researchers have examined the effects of ownership structure on the sensitivity to labor qualification (Luo (1995), Tao (2002)). Meanwhile, previous analysis in the field of FDI determinants have mainly focused in a cross-country study using bilateral aggregated FDI flow data, which make impossible to control for identity of foreign investors (Tuan (2006), Sun et al (2002), Coughlin et al (1999), Paloni et al (2001)). To overcome these issues this dissertation gathers data from over eight years collected at disaggregated level.
Finally, most studies take into account the stock of knowledge through education level, R&D and others determinants. Researchers, however, have not treated the product structure in much detail. This issue has grown importance in light of recent findings on the role of complexity3. Therefore, these study aims to contribute to this growing area of research by exploring the impact of presence of diversified knowledge on foreign direct investment.
The dataset used to test the impact of the diversified knowledge on FDI location covers
2Amiti and Javorcik (2008) : span 1998-2001
a period of 1998 to 2007 made by 9.363 foreign investment enterprises. The model allows up to 174 cities and reveals that investments tend to be located around the coastal regions where some cities display high level of capabilities availability. The conditional logit estimation provides support that complexity is a subsequent factor to promote foreign investment. The results suggest that increasing the level of complexity in a sector by one percent is associated with a ten percent increase in entry of foreign firm. The analysis also confirms the presence of agglomeration economies with a stronger effect for non chinese foreign firms.
There is a large literature body describing the factors attracting FDI. Firm level analy-sis of FDI decision point out the relevance of typical market variables, including cost of capital, market size, labor cost or policies (Devereux and Griffith, 1998, Henderson and Kuncoro, 1996, Head et al, 1999). Precisely, Mayer et al (2010) showed a network effect on new FDI. Firms tend to set up new affiliates closed to others affiliates belonging to the same industrial group. Location choice in China is also well documented. Coughlin et al 1990, Broadman and Sun 1999, Cheng and Kwan 2000, Coughlin and Segev 2000 emphasized traditional FDI location determinants (Market size, wage, labor quality). The other strand of the literature stresses the importance of vertical investment. Amiti and Javorcik (2008) were among the first to take into account supply access as the most important factor to attract FDI in China.
The rest of the paper is organized in the following way. On the next section, data used and measurement variables are set out. Section 3 then presents the empirical approach, result and robustness checks. Last, Section 4 concludes
2.
D
ATA AND MEASUREMENT 2.1. DataThe national bureau of statistic (NBS) conducted surveys from 1998 to 2007 on domestic and foreign firms with sells above 5 millions RMB. These surveys included only manufac-turing sectors, therefore agriculture and others services companies were not listed. Basic information was asked such as output, export, employment, 4 digits Chinese Industry Classification and financial information. By focusing on Foreign-Invested Enterprise, all domestic firms and portfolio investment, defined as an acquisition of domestic capital less than 10% are excluded from the dataset. Furthermore, collected data that did not satisfy the requirement are also deleted, including negative output or export and firm with capital equals to 0.
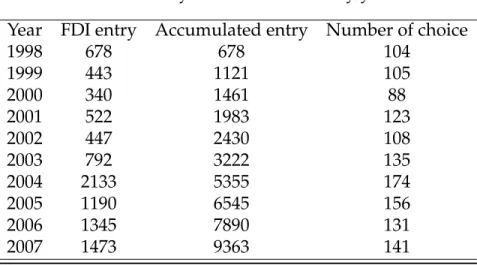
After deleting all those firms, the dataset contains roughly 9,363 firms belonging to more than 400 industries. Table 1 lists the annual entry of foreign investment enterprises newly established by the year of registration. This table only exhibits the total new entry and not by city. Because this paper focuses on the complexity computed at the city level, column 4 displays the number of cities in which the complexity has been measured. The dependent variable is the location choice at the city level made by foreign invested enterprises. The number of choices is up to 174.
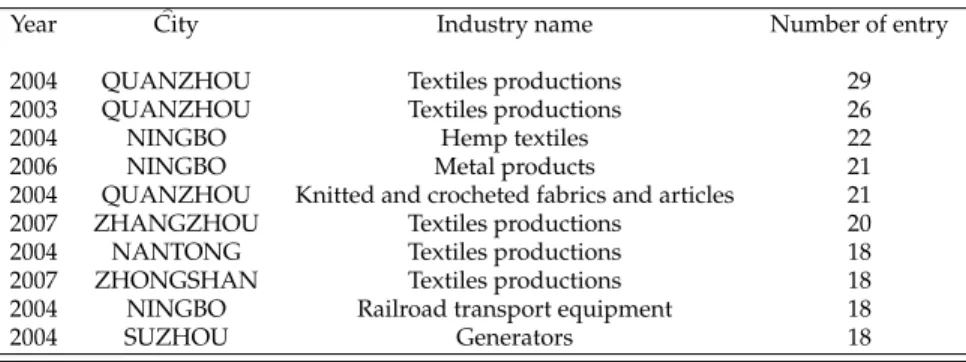
In appendix, a more precise table displays the highest entry of firm classified by type. However, one pattern of investment emerges from this chart. Foreign investment is mainly in textile production with a highest entry of 29, following by hemp textile and metal products.
Table 1: Entry of FDI into China by year
Year FDI entry Accumulated entry Number of choice
1998 678 678 104 1999 443 1121 105 2000 340 1461 88 2001 522 1983 123 2002 447 2430 108 2003 792 3222 135 2004 2133 5355 174 2005 1190 6545 156 2006 1345 7890 131 2007 1473 9363 141
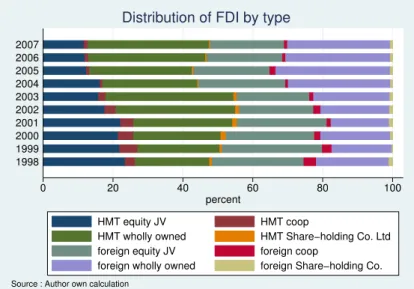
The database allows disaggregating FDI by type (figure 1). Hong Kong, Macao and Taiwan (HTM) are majors source of investment. As mention by Xu et al (2009), Investors from these Chinese islands can take advantage of their cultural affinity and the knowledge of the Chinese market. Over time, wholly owned type of ownership is preferred to the equity joint venture. This trend is similar for the others foreign invested country.
Figure 2 provides a breakdown of manufacturing FIE’s by geography. The table distributes investment into three major locations, coastal, midland and western part of China. Quickly, this table shows an inward of FDI concentrated toward the coastal regions.
0 20 40 60 80 100 percent 1998 1999 2000 2001 2002 2003 2004 2005 2006 2007
Source : Author own calculation
Distribution of FDI by type
HMT equity JV HMT coop
HMT wholly owned HMT Share−holding Co. Ltd foreign equity JV foreign coop
foreign wholly owned foreign Share−holding Co.
Figure 1: Firm distribution
For instance, in 2007, Guangdong province receives 33% of all the investment. Midland province and western province share very unequally distribution of FDI. Midland region perceived approximately 15% of FDI inward flow in 2006 against less than 10% for western part for the same year. Provinces like Ningxia, Yunnan, Shaanxi, Guangxi and Gansu were the less attractive in the selected sample.
0 20 40 60 80 100 percent 1998 1999 2000 2001 2002 2003 2004 2005 2006 2007
Source : Author own calculation
Distribution of FDI by geographical zone
coastal midland western
2.2. Variables
Indubitably, foreign investments improve the quality of the host country. China attracted limitless FDI since decades. In parallel, the product structure of China is perceived as being similar to rich countries (Rodrik, 2004 ). Estimate the impact of complexity as being a factor pulling FDI in China can help to explain this incommensurable production enhancement.
2.2.1. Economic complexity Product complexity
Early literature focused on formal measures (R&D, schooling, infrastructure) to eval-uate the knowledge of a society. However, this measure lacks of precision because it tells little about how a society manages its knowledge. Analogous, economic complexity starts by looking at what the country produces then deduces its stock of knowledge. This approach developed by Haussmann and Hidalgo (2009, 2011) emphasized the indirect availability of local capabilities. Indeed, countries are able to produce complex goods because their market is efficient enough to get together tacit knowledge of some individ-ual and the needs of others individindivid-uals. Theory of capabilities connects the country’s diversity and product’s ubiquity to infer intrinsic features of both country and prod-uct. Consequently, countries that have an RCA in the same products share the same capabilities.
Ubiquitous informs on how many countries export with a RCA4 product k and is
computed as follow:
4Revealed comparative advantages developed by Balassa (1964) is the ratio of export share in the
country’s export basket for a given product to the same share at worldwide level:
RCAjk =
xjk/Xj
Ubiquityk =Kk,0 =
∑
j
Mjk (1)
Diversification, however, aims to induce the specificity of a country. More precisely, it tells how much a country exports products with reveal comparative advantages.
Diversityj =Kj,0 =
∑
k
Mjk (2)
where j refers to the country, k to the product and Mjkis equal to one if country j exports product k with a RCA
Nevertheless, it is necessary to correct both measure to extract the authentic value of the complexity. Truly, country endows by a rare resource is regarded as being not ubiquitous but it does not make it necessarily diversified. Conversely, looking at the product line of a country only is misleading. A country exporting many products does not tell anything about the structure of the production. The method of reflection consists to remove the error of ubiquity using diversity and vice versa. Combining both information apprises on the complexity of a country. This method implies to combine the average of ubiquity using diversity. Then this value is used to extract the average of diversity and so on. In fact, the first iteration of diversification indicates how common are the products export by a country. By analogy, the first iteration of ubiquity designates how diversified are the countries exporting a given product. Finally, a country produces complex goods if the latters are less ubiquitous (possesses specific knowledge) and diversified (produced by few countries).
The product complexity is hence computed as follow, where n corresponds to the number of iteration:
Kk,n= 1
Kk,0
∑
j MjkKj,n−1 (3)Kj,n−1 =
1
Kj,0
∑
k MjkKk,n−2 (4)This process is renewing until any information can be reveal about the availability of capabilities in a country. This method relies on international trade dataset5at the product level (6-digit). The dataset, composed by 5017 products and 230 countries, shows the product convergence at the 15th iteration. The measure is computed for the year 1997 because data were available and to avoid influence of time-varying error, the estimation will take only this year as a benchmark.
Complexity city sector
City-sector complexity, Kci indexing i as industry, is derivate following Hausmann and Hidalgo (2009):
Kic = 1
Kc,0 k
∑
2iMc,kKk,15 (5)City sector complexity is the sum of product’s complexity Kk,15exported with a RCA Mc,k by industry divided by the count of the industry’s RCA Kc,0. City RCA comes from
the Chinese customs data over the 1997-2007 period, which release export information by 6-digit product. Finally, the measure of economic complexity requires to be standardized (Hausmann and Hidalgo, 2011) as follow:
SectorComplexitytic = K ti c −∑cKcti/n σKti c (6)
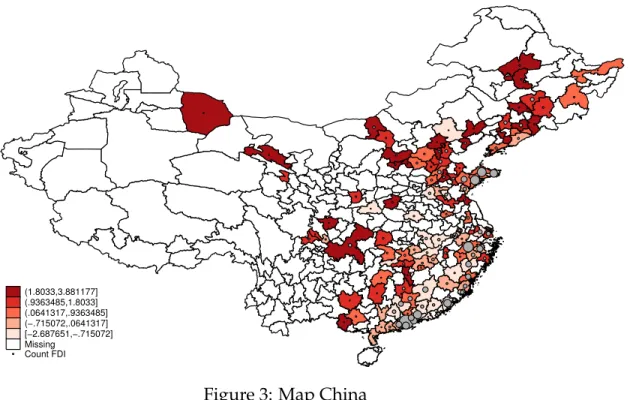
Figure 1 plots a map where complexity at the city level6 and the FDI count are dis-played. A brief look at the map shows that the FDI count is located on the coastal regions (grey circles). The bigger circles indicate the cities with higher FDI inwards.
(1.8033,3.881177] (.9363485,1.8033] (.0641317,.9363485] (−.715072,.0641317] [−2.687651,−.715072] Missing Count FDI
FDI distribution year 2007
Chinese provinces complexity
Figure 3: Map China
The map exhibits the economic complexity for 174 location choices as well. The darker
6computed as follow:
colors indicate higher levels of complexity while lighter colors show low levels. Regions like Shandong, Chongqing or Shanghai have both high level of complexity and attract foreign investment. Another pattern coming from the south tells region like Guangdong or Fujian, where special economic zone are widespread, entice foreign investments but with middle complexity index. A closer look at the data shows many foreign firms located in these areas are engaged in low-skilled required manufacturing (textile, workshop, etc.).
2.2.2. Other variables
Agglomeration effect proves to be an important factor in determining the location deci-sion. As demonstrated, foreign firms are sensitive to underlying agglomeration forces. Marshallian’s externalities, in this set up, have been widely documented in the literature7 . For instance, concentration of activities appear extremely strong in China as highlighted Wei and He (2008). More precisely, globalized industries are clustered in the coastal regions. These clusters emerge in result to the availability of specialized labor, sharing of inputs and knowledge spillovers (Pugas et al (2004, Fujita and Thisse (2000)). In particular, increasing urban density enhances human capital and help firms to better match their needs (Rosenthal and Strange 2008).
New economy geography theories8(NEG) suppose firms can gain from urbanization
with horizontal effect and vertical effect. On the one hand, firms tend to set up new plants in region where the size of the market is large. On the other hand, be near from many suppliers makes the market better quality, which in turn attracts more firms.
7See Fujita and Thisse (2000), Pugas et al (2004), Porter (1998), Rosenthal and Strange (2005)
Agglomeration variables
Sectorial network is computed following Mayer et al (2010). This variable consists to count the number of firms in the same industry newly entered in a city from previous years. SectoralNetworkic,t =
∑
u<t∑
s Disc,u (7)where Dif c,uis a dummy equal to 1 for all affiliates s of industry i located in city c and created in year u or before. The other agglomeration variables are based on the backward and forward linkages that exist between firms. Amiti and Jarvocik (2008) computed horizontal and vertical investments as follow :
SAic,t = 1 ∑Kk=1Dck J
∑
j=1 ai jφc,tj where φc,tj = Y J c,t YCH IN A,tj (8) MAic,t = 1 ∑Kk=1Dck " J∑
j=1 bi jφc,tj +biλc,t # where λc,t = GDPc,t GDPCH IN A,t (9)The coefficient ai jcomes from the China national input/output (I/O) table for 2007. Eq.(9)
and (10) also consider the effect of distance by dividing supply and market access to billateral distance Dck, where c 6=k.
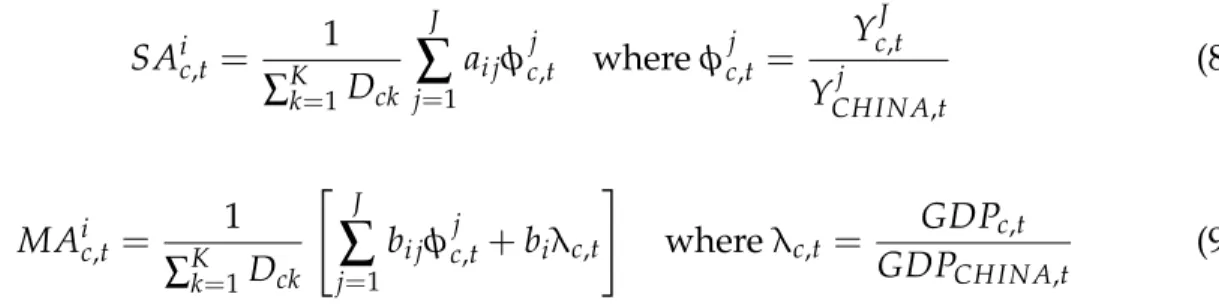
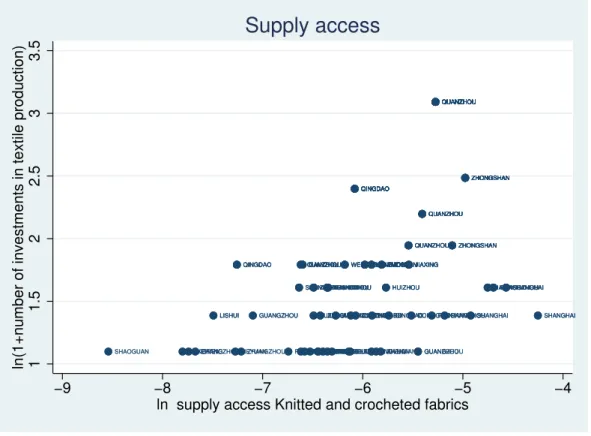
Horizontal investment (market access) indicates that output of a firm can be an input for many others downstream industries or can be consumed as final good by consumers. In appendix, horizontal investment is plotted for the year 2007. An apparent positive relationship demonstrates that firms choose location close to large demand. Vertical investment (supply access), however, reflects the proximity with the upstream industries. Figure 4 provides an example for the textile manufacturing. Vertical investment is plotted
from the cumulated number of textile investment in different cities against the supply access of upstream industry –knitted and crocheted fabrics. The positive relationship is clear. SHANGHAI SHANGHAI SHANGHAI SHANGHAI SHANGHAI SHANGHAI SHANGHAI SHANGHAI SHANGHAI SHANGHAI NANTONGNANTONGNANTONG
NANTONG ZHENJIANGZHENJIANG
HANGZHOU HANGZHOU HANGZHOU HANGZHOU HANGZHOU HANGZHOU HANGZHOU HANGZHOU HANGZHOU HANGZHOU NINGBO NINGBO NINGBO NINGBO NINGBO WENZHOU WENZHOU WENZHOU WENZHOU WENZHOU JIAXING JIAXING JIAXING JIAXING JIAXING JIAXING JIAXING JIAXING JIAXING JIAXING JIAXING JIAXING JIAXING HUZHOU HUZHOU LISHUI LISHUI
LISHUI FUZHOUFUZHOUFUZHOU PUTIAN PUTIAN QUANZHOU QUANZHOU QUANZHOU QUANZHOU QUANZHOU QUANZHOU QUANZHOU QUANZHOU QUANZHOU QUANZHOU QUANZHOU QUANZHOU QUANZHOU QUANZHOU QUANZHOU QUANZHOU QUANZHOU QUANZHOU QUANZHOU QUANZHOU QUANZHOU QUANZHOU QUANZHOU QUANZHOU QUANZHOU QUANZHOU QUANZHOU QUANZHOU QUANZHOU QUANZHOU QUANZHOU QUANZHOU QUANZHOU QUANZHOU QUANZHOU QUANZHOU QUANZHOU QUANZHOU QUANZHOU QUANZHOU QUANZHOU QUANZHOU QUANZHOU QUANZHOU QUANZHOU QUANZHOU QUANZHOU QUANZHOU QUANZHOU QUANZHOUQUANZHOU
QUANZHOU ZHANGZHOU ZHANGZHOU ZHANGZHOU ZHANGZHOU ZHANGZHOU ZHANGZHOU ZHANGZHOUZHANGZHOU
GANZHOU GANZHOU GANZHOU GANZHOU GANZHOU QINGDAO QINGDAO QINGDAO QINGDAO QINGDAO QINGDAO QINGDAO QINGDAO QINGDAO QINGDAO QINGDAO QINGDAO QINGDAO QINGDAO QINGDAO QINGDAO QINGDAO QINGDAO QINGDAO QINGDAO QINGDAO ZAOZHUANG ZAOZHUANG WEIFANG WEIFANG GUANGZHOU GUANGZHOU GUANGZHOU GUANGZHOU GUANGZHOU GUANGZHOU GUANGZHOU GUANGZHOU GUANGZHOU SHAOGUAN SHAOGUAN SHENZHEN SHENZHEN SHENZHEN SHENZHEN FUOSHAN FUOSHAN FUOSHAN FUOSHAN FUOSHAN FUOSHAN FUOSHAN FUOSHAN FUOSHAN FUOSHAN JIANGMEN JIANGMEN JIANGMEN JIANGMEN JIANGMEN JIANGMEN JIANGMEN HUIZHOU HUIZHOU HUIZHOU HUIZHOU HUIZHOU HUIZHOU HUIZHOU HUIZHOU HUIZHOU HEYUAN
HEYUAN QINGYUANQINGYUAN DONGGUAN DONGGUAN DONGGUAN ZHONGSHAN ZHONGSHAN ZHONGSHAN ZHONGSHAN ZHONGSHAN ZHONGSHAN ZHONGSHAN ZHONGSHAN ZHONGSHAN ZHONGSHAN ZHONGSHAN ZHONGSHAN ZHONGSHAN ZHONGSHAN ZHONGSHAN ZHONGSHAN ZHONGSHAN ZHONGSHAN ZHONGSHAN ZHONGSHAN ZHONGSHAN ZHONGSHAN ZHONGSHAN 1 1.5 2 2.5 3 3.5
ln(1+number of investments in textile production)
−9 −8 −7 −6 −5 −4
ln supply access Knitted and crocheted fabrics
Supply access
Figure 4: Supply access
Other commonly used control variables
In this specification, foreign market access is included to allow foreign firms to serve international market. This variable follows Mayer et al (2010), based on a gravity ap-proach9.
9Foreign market access is computed as follow :
MAForeignc =∑jθi jEjPσ−1j where θi jmeasure the freeness of trade and EjPσ−1j is the importer fixed
3.
E
MPIRICAL STRATEGY AND RESULTS 3.1. Empirical strategy: conditional logitLiterature on location choice usually refers to conditional logit estimates. Suppose firms maximize their profit subject to cost minimization and uncertainty regarding the location choice. Firms will screen all possible location and build a plant where it is expected to have the higher profit. Attractiveness of a location is determined by observable characteristics and unobservable characteristics. The latter is eliminated by provincial fixed effect and captures characteristics that are common to all investors, independent of time of entry or the industry.
The model also includes a set of variables Xct, representing observable characteristics
of location c that vary across investors. The profit equation for a typical investor s in city c is:
πsct =θ+βXct+εsct
The probability of firm s to choose location c is :
Ps(c) = Prob{πsct ≥πskt}for all k6= c
=Prob{εskt εsct+β(Xkt−Xct)}for all k6= c
If the error term follows Type I extreme distribution, then the probability of choosing location c can be simplified to the following logit expression (MacFadden (1984)):
Ps(c) = exp βXct
∑k2KexpβXkt (10)
Hence, the econometric equation yielded by city c to affiliate s is :
P(y =1 | x) =β0+β1complexity.sectorc,ti +γZc,t+ηp+µt+εc,t (11)
where y denotes the firm location choice and c for the cities. Complexity for industry i proxies for the number and exclusivity of capabilities, as discussed in section 2.2.1. The rest of variables, Zc,t, control for typical agglomeration effect and city specificities. The
models also controls for provincial fixed effect ηp.
3.2. Results
3.2.1. Baseline specification
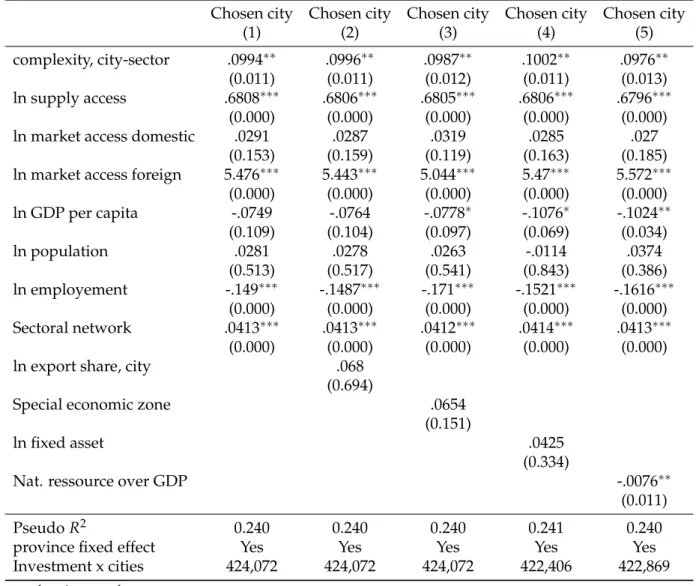
The major objective of this study is to investigate the role played by complexity in at-tracting FDI. There are up to 174 possible host cities chosen by 9,363 firms over the 1998 -2007 period. The first table regroups 5 specifications. The first column represents the baseline specification whereas the remaining estimates confirm the findings. Results provide support for the key arguments as city-sector complexity index is a substantial factor explaining the inflow of offshore investment in China. In particular, an increase by 1 percent of sector complexity index increases foreign investment to about 10.4 percent10 . That is, sectors benefiting from exclusive and diverse knowledge tend to attract more foreign firms. One major explanation could be the presence of spillovers and market interactions within sector. If a sector is able to connect the knowledge acquired by each
firm this improves the overall productivity of the sector.
Table 2: Conditional logit for FDI location choice : city level
Chosen city Chosen city Chosen city Chosen city Chosen city
(1) (2) (3) (4) (5)
complexity, city-sector .0994⇤⇤ .0996⇤⇤ .0987⇤⇤ .1002⇤⇤ .0976⇤⇤
(0.011) (0.011) (0.012) (0.011) (0.013)
ln supply access .6808⇤⇤⇤ .6806⇤⇤⇤ .6805⇤⇤⇤ .6806⇤⇤⇤ .6796⇤⇤⇤
(0.000) (0.000) (0.000) (0.000) (0.000)
ln market access domestic .0291 .0287 .0319 .0285 .027
(0.153) (0.159) (0.119) (0.163) (0.185)
ln market access foreign 5.476⇤⇤⇤ 5.443⇤⇤⇤ 5.044⇤⇤⇤ 5.47⇤⇤⇤ 5.572⇤⇤⇤
(0.000) (0.000) (0.000) (0.000) (0.000) ln GDP per capita -.0749 -.0764 -.0778⇤ -.1076⇤ -.1024⇤⇤ (0.109) (0.104) (0.097) (0.069) (0.034) ln population .0281 .0278 .0263 -.0114 .0374 (0.513) (0.517) (0.541) (0.843) (0.386) ln employement -.149⇤⇤⇤ -.1487⇤⇤⇤ -.171⇤⇤⇤ -.1521⇤⇤⇤ -.1616⇤⇤⇤ (0.000) (0.000) (0.000) (0.000) (0.000) Sectoral network .0413⇤⇤⇤ .0413⇤⇤⇤ .0412⇤⇤⇤ .0414⇤⇤⇤ .0413⇤⇤⇤ (0.000) (0.000) (0.000) (0.000) (0.000)
ln export share, city .068
(0.694)
Special economic zone .0654
(0.151)
ln fixed asset .0425
(0.334)
Nat. ressource over GDP -.0076⇤⇤
(0.011)
Pseudo R2 0.240 0.240 0.240 0.241 0.240
province fixed effect Yes Yes Yes Yes Yes
Investment x cities 424,072 424,072 424,072 422,406 422,869
p-values in parentheses
⇤p < .1,⇤⇤p < .05,⇤⇤⇤p < .01
Turning to the agglomeration variables, the results are similar than previous analyses. Table two confirms the role of the upstream supplier and market size. Agglomeration coefficients are found positive and can be interpreted as elasticities11. The ease of access
11Head and Ries(1995) : if the location choices are sufficiently high then estimations can be view as
to suppliers allows a city to attract more foreign firms. For instance, a larger number of local suppliers of intermediate inputs in the host city improve the city’s attractiveness. Precisely, an increase by 10 percent supply access is associated with 7 percent new foreign firms entry. Proximity to market is also significant at 1 percent for foreign market but turn to be insignificant for domestic market. The remaining city level variables (population, employment) enter in the expected way, as does the proxy for labor cost (GDP per capital), which is significantly negative. Result for sectorial network is also in line with the literature by appearing extremely significant and positive. Newly invested firms serve markets where other foreign firms are established since previous years.
The last columns include control variables to verify if results are still robust. Including the city’s export share slightly increase the impact of sectorial complexity. Chinese government has been set up trade policies since 1979 in order to promote industrial activities, innovations and exportations. Chinese authorities entitle targeted cities to implement tax incentives and foster administrative procedures. These policies confine FDI in special economic zone (SEZ). The SEZ dummy is constructed following Wang and Wei 201012 and the odd ratio of investing in theses cities increase the probability by 1.06 (exp(0.65)) compare to other cities. Columns 4 tests the robustness of the results by including fixed asset variable. The last column accounts for low-intrinsic values of complexity by controlling for primary sector over GDP. Including this variable does not impact the main result while coefficient appears negative and insignificant.
12Wang and Wei (2010), What accounts for the rising sophistication of China’s export? 67 cities are
listed by incentive type: SEZ, Economic and technological development area, Hi-technology industry development area and export processing zone
3.2.2. Sector intensity
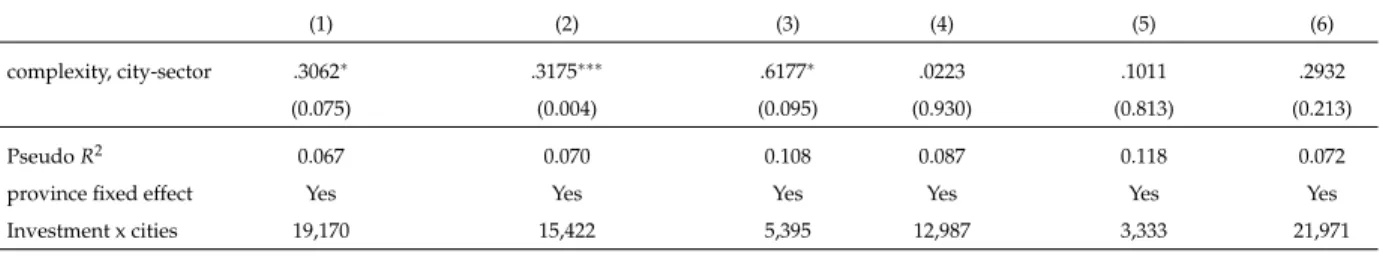
Recent findings highlighted the importance to take into account the heterogeneity be-tween sectors (Wen (2004), He et al (2008)). Indeed industries differ according to techno-logical content. Specifically, the most advanced industries are probably more sensitive to the degree of skill embedded in a location. In contrast, less responsive industries in term of skill intensity may find more essential to hire low cost labor.
Table three reports coefficients of complexity at the city sector level for 2 digits industry. Industries are slip into two categories, top industries belong to sectors requiring exclusive and diverse capabilities whereas bottom industries need less specific capabilities. One striking observation is that there are large variations across industries with the largest effect in glass product. Theses industries are very sensitive to the level of knowledge because it is necessary to combine diverse and non-ubiquitous knowledge to perform tasks. Effects of firms response to complexity for bottom sector are little and mostly irrelevant.
Table 3: Sector intensity
Top Bottom
Alloy iron smelting Railroad transport equipment Glass product Woolen textiles Printing ink and mastics Soft drink
(1) (2) (3) (4) (5) (6)
complexity, city-sector .3062⇤ .3175⇤⇤⇤ .6177⇤ .0223 .1011 .2932
(0.075) (0.004) (0.095) (0.930) (0.813) (0.213)
Pseudo R2 0.067 0.070 0.108 0.087 0.118 0.072
province fixed effect Yes Yes Yes Yes Yes Yes
Investment x cities 19,170 15,422 5,395 12,987 3,333 21,971
p-values in parentheses ⇤p < .1,⇤⇤p < .05,⇤⇤⇤p < .01
3.3. Robustness check
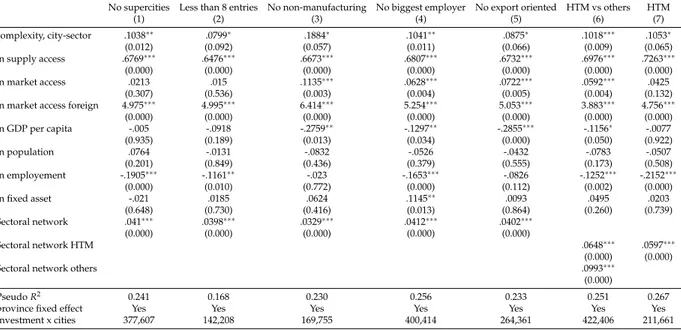
Further robustness tests are conducted in table 4. Column 1 and 2 check for the city specificities whereas columns 3 to 7 account for firm characteristics.
One possible test when focusing on location choice is to validate the independence of irrelevant alternative (IIA) assumption13 . This examination helps to evaluate if firms still choose the same location when excluding choices (i.e cities). If the test is concluding, then eliminating some of unchosen alternative does not affect the selection of the location as the best option. Inspection is done in column 1 and 2. Figure 3 clearly shows that foreign investments in China are unevenly spread. More precisely, supercities (Beijing, Tianjin, Shanghai and Chongqing) benefit to political flexibility and tend to be more open. By excluding these 4 cities from the sample, any change occurs for the variable of interest. Second estimation excludes cities with less than 8 entries while this change does not alter the main results. The independence of irrelevant alternative is validated and the results appear to be unbiased.
The second wave of test focuses on firm characteristics. Third estimatation keeps out non-manufacturing activities, it turns out that results are similar to what table 2 displays. Columns 4 and 5 investigate if outliers bias the results. To tackle this issue, a first estimate concentrates on the size of the firm by excluding biggest employers –more than fifty percent in the sample. Then, firms producing more than seventy-five percent for export purpose are eliminated. China is known for its export oriented strategy and foreign firms may be at the tail of the production, therefore exporting complex goods are only statistically artificial. Neither of these changes alter the results.
The last two columns aim to check the results of Xu and Lu (2009). They pointed out the importance of taking into account the origin of FDI. Column 6 divides sectorial
Table 4: Robustness checks
No supercities Less than 8 entries No non-manufacturing No biggest employer No export oriented HTM vs others HTM (1) (2) (3) (4) (5) (6) (7) complexity, city-sector .1038⇤⇤ .0799⇤ .1884⇤ .1041⇤⇤ .0875⇤ .1018⇤⇤⇤ .1053⇤ (0.012) (0.092) (0.057) (0.011) (0.066) (0.009) (0.065) ln supply access .6769⇤⇤⇤ .6476⇤⇤⇤ .6673⇤⇤⇤ .6807⇤⇤⇤ .6732⇤⇤⇤ .6976⇤⇤⇤ .7263⇤⇤⇤ (0.000) (0.000) (0.000) (0.000) (0.000) (0.000) (0.000) ln market access .0213 .015 .1135⇤⇤⇤ .0628⇤⇤⇤ .0722⇤⇤⇤ .0592⇤⇤⇤ .0425 (0.307) (0.536) (0.003) (0.004) (0.005) (0.004) (0.132) ln market access foreign 4.975⇤⇤⇤ 4.995⇤⇤⇤ 6.414⇤⇤⇤ 5.254⇤⇤⇤ 5.053⇤⇤⇤ 3.883⇤⇤⇤ 4.756⇤⇤⇤
(0.000) (0.000) (0.000) (0.000) (0.000) (0.000) (0.000) ln GDP per capita -.005 -.0918 -.2759⇤⇤ -.1297⇤⇤ -.2855⇤⇤⇤ -.1156⇤ -.0077 (0.935) (0.189) (0.013) (0.034) (0.000) (0.050) (0.922) ln population .0764 -.0131 -.0832 -.0526 -.0432 -.0783 -.0507 (0.201) (0.849) (0.436) (0.379) (0.555) (0.173) (0.508) ln employement -.1905⇤⇤⇤ -.1161⇤⇤ -.023 -.1653⇤⇤⇤ -.0826 -.1252⇤⇤⇤ -.2152⇤⇤⇤ (0.000) (0.010) (0.772) (0.000) (0.112) (0.002) (0.000) ln fixed asset -.021 .0185 .0624 .1145⇤⇤ .0093 .0495 .0203 (0.648) (0.730) (0.416) (0.013) (0.864) (0.260) (0.739) Sectoral network .041⇤⇤⇤ .0398⇤⇤⇤ .0329⇤⇤⇤ .0412⇤⇤⇤ .0402⇤⇤⇤ (0.000) (0.000) (0.000) (0.000) (0.000) Sectoral network HTM .0648⇤⇤⇤ .0597⇤⇤⇤ (0.000) (0.000) Sectoral network others .0993⇤⇤⇤
(0.000)
Pseudo R2 0.241 0.168 0.230 0.256 0.233 0.251 0.267
province fixed effect Yes Yes Yes Yes Yes Yes Yes Investment x cities 377,607 142,208 169,755 400,414 264,361 422,406 211,661
p-values in parentheses ⇤p < .1,⇤⇤p < .05,⇤⇤⇤p < .01
network into two categories, HTM and the remaining foreign investors14. The odd ratio for non Chinese foreign firms is 1.104 (exp(0.099) against 1.035 (exp(0.099-0.064) for HTM. Foreign firms are more sensitive to sectorial networks than their Chinese counterpart (HTM). It confirms recent observations, Hong-Kong, Taiwan and Macao investors are ethnically similar than mainland Chinese and share the same language. They have a better knowledge of the Chinese market and can account more on domestic firms than others foreign companies. The results are almost unchanged regarding the city-sector complexity. Column 7 considers only a subsample of investor –HTM. The results seem robust to these exclusion and are not driven by Chinese investors from Hong-Kong, Taiwan and Macao.
4.
C
ONCLUSIONA unique dataset, containing roughly 9,363 firms up to 174 location choices, is constructed to examine the determinants of foreign firm’s entry in Chinese city over the years 1998 to 2007. The main originality of this work is to develop an index of complexity that rely on what a country is producing to induce the amount of knowledge embedded in a location. The results suggest that the access of exclusive and diverse capabilities is the key determinant of FDI inflows. The findings show that increasing city-sector complexity by 1 percent is associated with 10 percent increase in foreign investment. One possible reason is foreign firms are sensitive to the market interaction and potential spillovers within a sector.
The conditional logit estimate provides also strong support for the existence of agglom-eration economies. Foreign firms that are not from Hong-Kong, Macao and Taiwan (HTM) are more likely to invest in city where many companies of the same industry have already invested. Chinese foreign counterparts (HTM) can account on the domestic firms to cooperate because they share the same language, culture and have a better acquaintance of the market. Evidence seems robust to an array of test and support the main results. Further works could be to decompose trade flow into ordinary trade and processing trade to evaluate if complexity is still substantial to entice foreign direct investment.
R
EFERENCES[1] Amiti, M & Smarzynska Javorcik, B. (2008) Trade costs and location of foreign firms in china. Journal of development economics 85, 129–149.
[2] Belderbos, R & Carree, M. (2002) The location of japanese investments in china: agglomeration effects, keiretsu, and firm heterogeneity. Journal of the Japanese and International Economies 16, 194–211. [3] Cheng, L. K & Kwan, Y. K. (1998) The Location of Foreign Direct Investment in Chinese Regions eds. Ito, T
[4] Cheng, L. K & Kwan, Y. K. (2000) What are the determinants of the location of foreign direct investment? the chinese experience. Journal of international economics 51, 379–400.
[5] Coughlin, C. C & Segev, E. (2000) Foreign direct investment in china: a spatial econometric study. The world economy 23, 1–23.
[6] Devereux, M. P & Griffith, R. (1998) Taxes and the location of production: Evidence from a panel of US multinationals. Journal of Public Economics 68, 335–367.
[7] Du, J, Lu, Y, & Tao, Z. (2008) Economic institutions and FDI location choice: Evidence from US multinationals in china. Journal of comparative economics 36, 412–429.
[8] Fan, C. C & Scott, A. J. (2003) Industrial agglomeration and development: a survey of spatial economic issues in east asia and a statistical analysis of chinese regions. Economic Geography 79, 295–319. [9] Fujita, M. (2002) Economics of agglomeration: Cities, industrial location, and regional growth. (Cambridge
university press).
[10] Gao, T. (2005) Labor quality and the location of foreign direct investment: Evidence from china. China Economic Review 16, 274–292.
[11] Guimaraes, P, Figueiredo, O, & Woodward, D. (2000) Agglomeration and the location of foreign direct investment in portugal. Journal of Ur 47, 115–135.
[12] Hausmann, R & Hidalgo, C. A. (2011) The network structure of economic output. Journal of Economic Growth 16, 309–342.
[13] He, C, Wei, Y. D, & Xie, X. (1999) Globalization, institutional change, and industrial location: Economic transition and industrial concentration in china. Regional Science and Urban Economics 42, 923–945. [14] Head, C. K, Ries, J. C, & Swenson, D. L. (1999) Attracting foreign manufacturing: Investment
promotion and agglomeration. Regional Science and Urban Economics 29, 197–218.
[15] Head, K & Mayer, T. (2004) Market potential and the location of japanese investment in the european union. The Review of Economics and Statistics 86, 959–972.
[16] Head, K & Ries, J. (1996) Inter-city competition for foreign investment: static and dynamic effects of china’s incentive areas. Journal of Urban Economics 40, 38–60.
[17] Head, K, Ries, J, & Swenson, D. (1995) Agglomeration benefits and location choice: Evidence from japanese manufacturing investments in the united states. Journal of International Economics 38, 223–247. [18] Henderson, J. V & Kuncoro, A. (1996) Industrial centralization in indonesia. The world bank economic
review 10, 513–540.
[19] Hidalgo, C. A. A, Klinger, B, Barabasi, A.-L, & Hausmann, R. (2007) The product space conditions the development of nations. Science 317, 482–487.
[20] Hidalgo, C. A & Hausmann, R. (2009) The building blocks of economic complexity. Proceedings of the National Academy of Sciences 106, 10570–10575.
[21] Huang, H & Wei, D. (2011) Spatial-temporal patterns and determinants of foreign direct investment in china. Erdkunde 65, 7–23.
[22] Jarreau, J & Poncet, S. (2012) Export sophistication and economic growth: Evidence from china. Journal of development Economics 97, 281–292.
[23] Kinoshita, Y & Campos, N. F. (2003) Why does FDI go where it goes? New evidence from the transition economies. (International Monetary Fund).
[24] Krugman, P & Venables, A. J. (1995) Globalization and the inequality of nations. The Quartely Journal of Economics 110, 857–880.
[25] Liu, X, Lovely, M. E, & Ondrich, J. (2010) The location decisions of foreign investors in china: Untangling the effect of wages using a control function approach. The Review of Economics and Statistics
92, 160–166.
[26] Markusen, J. R & Venables, A. J. (2000) The theory of endowment, intra-industry and multi-national trade. Journal of International Economics 52, 209–234.
[27] Markusen, J. R & Venables, A. J. (1998) Multinational firms and the new trade theory. Journal of International Economics 46, 183–203.
[28] Mayer, T, Mejean, I, & Nefussi, B. (2010) The location of domestic and foreign production affiliates by french multinational firms. Journal of urban economics 68, 115–128.
[29] Noorbakhsh, F, Paloni, A, & Youssef, A. (2001) Human capital and FDI inflows to developing countries: New empirical evidence. World Development 29, 1593–1610.
[30] Porter, M. E. (1998) Clusters and the new economics of competition. (Harvard Business Review Boston) Vol. 76.
[31] Rodrik, D. (2006) What’s so special about china’s exports? China & World Economy 14, 1–19.
[32] Rosenthal, S. S & Strange, W. C. (2004) The attenuation of human capital spillovers: A Manhattan skyline approach ed. Henderson, J.V. Thisse, J. (Handbook of Regional and Urban Economics).
[33] Shan, W & Song, J. (1997) Foreign direct investment and the sourcing of technological advantage: evidence from the biotechnology industry. Journal of International Business Studies pp. 267–284. [34] Smarzynska, B. K & Wei, S.-J. (2000) Corruption and composition of foreign direct investment: Firm-level
evidence. (National bureau of economic research).
[35] Sun, Q, Tong, W, & Yu, Q. (2002) Determinants of foreign direct investment across china. Journal of International Money and Finance 21, 79–113.
[36] Tuan, C & Ng, L. F.-Y. (2007) The place of FDI in china’s regional economic development: Emergence of the globalized delta economies. Journal of Asian Economics 18, 348–364.
[37] de Waldemar, F. S & Poncet, S. (2013) Product relatedness and firm exports in china. The world bank economic review 51, 104Ð118.
[38] Wang, Z & Wei, S.-J. (2010) What accounts for the rising sophistication of China’s exports? (University of Chicago Press), pp. 63–104.
[39] Wei, S.-J. (1997-05) How Taxing is Corruption on International Investors? (National Bureau of Economic Research) No. 6030.
[40] Wen, M. (2004) Relocation and agglomeration of chinese industry. Journal of Development Economics 73, 329–347.
[41] Xu, B & Lu, J. (2009) Foreign direct investment, processing trade, and the sophistication of china’s exports. China Economic Review 20, 425–439.
5.
T
ABLES AND FIGURES TIANJIN SHIJIAZHUANG QINHUANGDAO CANGZHOU LANGFANG BAOTOU HULUNBEIERMENG SHENYANG DALIAN FUSHUN DANDONG JINZHOU YINGKOU CHANGCHUN SHANGHAI SUZHOU NANTONG LIANYUNGANG YANGZHOU TAIZHOU HANGZHOU NINGBO WENZHOU JIAXING HUZHOU SHAOXING JINHUA LISHUI TAIZHOU WUHU MAANSHAN ANQING SUZHOU FUZHOU XIAMEN PUTIAN SANMING QUANZHOU ZHANGZHOU NINGDE NANCHANG JINGDEZHEN JIUJIANG GANZHOU YICHUN SHANGRAO JI’AN FUZHOU JINAN QINGDAO ZIBO ZAOZHUANG YANTAI WEIFANG JINING TAI’AN WEIHAI RIZHAO DEZHOU LIAOCHENG HEZE WUHAN HUANGGANG CHANGSHA YUEYANG CHENZHOU SHAOGUAN SHENZHEN ZHUHAI SHANTOU FUOSHAN JIANGMEN ZHANJIANG ZHAOQING HUIZHOU MEIZHOU HEYUAN YANGJIANG QINGYUAN DONGGUAN ZHONGSHAN CHONGQING CHENGDU 1 2 3 4 5 ln(investment count) −9 −8 −7 −6 −5 −4 ln Market access 2007 Fitted values lntot_firmMarket access
Figure 5: Market
Table 5: Industries with the highest net entry of Foreign Investment Entreprises
Year City Industry name Number of entry
2004 QUANZHOU Textiles productions 29
2003 QUANZHOU Textiles productions 26
2004 NINGBO Hemp textiles 22
2006 NINGBO Metal products 21
2004 QUANZHOU Knitted and crocheted fabrics and articles 21
2007 ZHANGZHOU Textiles productions 20
2004 NANTONG Textiles productions 18
2007 ZHONGSHAN Textiles productions 18
2004 NINGBO Railroad transport equipment 18
Table 6: Industries with the highest industry complexity level
Year City Industry name Complexity sector
2004 DEZHOU Metalworking machinery 1.93
2002 FUOSHAN Chemical pesticides 1.85
2005 CHONGQING Products of wood, bamboo, cane, palm, straw 1.80
2005 PANJIN Glass and glass products 1.79
1999 CHANGZHOU Agriculture, forestry, animal husbandry and fishing machinery 1.74
2004 SUZHOU Chemical pesticides 1.73
2005 HANGZHOU Chemical products for daily use 1.73
2005 ZAOZHUANG Cement, lime and plaster 1.71
1999 JILIN Paints, varnishes and similar coatings, printing ink and mastics 1.70
2004 JINAN Pump, valve, compressor and alike machinery manufacturing 1.70
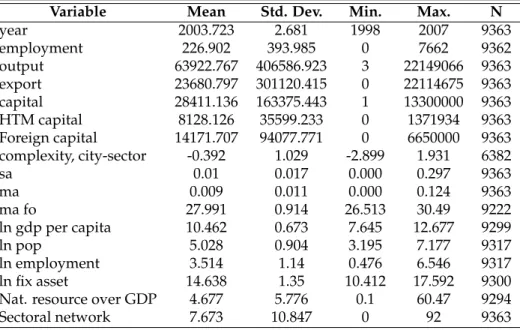
Table 7: Summary statistics
Variable Mean Std. Dev. Min. Max. N
year 2003.723 2.681 1998 2007 9363 employment 226.902 393.985 0 7662 9362 output 63922.767 406586.923 3 22149066 9363 export 23680.797 301120.415 0 22114675 9363 capital 28411.136 163375.443 1 13300000 9363 HTM capital 8128.126 35599.233 0 1371934 9363 Foreign capital 14171.707 94077.771 0 6650000 9363 complexity, city-sector -0.392 1.029 -2.899 1.931 6382 sa 0.01 0.017 0.000 0.297 9363 ma 0.009 0.011 0.000 0.124 9363 ma fo 27.991 0.914 26.513 30.49 9222 ln gdp per capita 10.462 0.673 7.645 12.677 9299 ln pop 5.028 0.904 3.195 7.177 9317 ln employment 3.514 1.14 0.476 6.546 9317 ln fix asset 14.638 1.35 10.412 17.592 9300
Nat. resource over GDP 4.677 5.776 0.1 60.47 9294