HAL Id: dumas-00811476
https://dumas.ccsd.cnrs.fr/dumas-00811476
Submitted on 10 Apr 2013
HAL is a multi-disciplinary open access archive for the deposit and dissemination of sci-entific research documents, whether they are pub-lished or not. The documents may come from teaching and research institutions in France or abroad, or from public or private research centers.
L’archive ouverte pluridisciplinaire HAL, est destinée au dépôt et à la diffusion de documents scientifiques de niveau recherche, publiés ou non, émanant des établissements d’enseignement et de recherche français ou étrangers, des laboratoires publics ou privés.
Water partial privatization: access and quality
consequences for urban areas in Senegal
Nassima Rabhi
To cite this version:
Nassima Rabhi. Water partial privatization: access and quality consequences for urban areas in Senegal. Economics and Finance. 2012. �dumas-00811476�
Water Partial Privatization: Access and Quality
Consequences for Urban Areas in Senegal
∗
Nassima Rabhi
†Under the Supervision of Charlotte Guénard
June 2012
Abstract
Access to clean water and sanitation are essential for human life, dignity and develope-ment. Since the 1990s, there are growing calls to privatize water services in order to improve both the coverage of the network and the quality of water, especially in Sub-Saharan Africa. In 1996, Senegal has implemented a Public-Private Partnership (PPP) in the water sector, viewed as an example of success in the region. In this paper, using difference-in-differences matching methods on pseudo-panel data, I measure the degree to which the increasing access to piped water in Senegal is due to the private participation. I also gauge whether the PPP has induced an improvement in the quality of water, by the first children’s water-related disease, diarrhea. The results show that the participation of the private sector is associated to enhancement in water private connections, as well as less childrens’ diarrheas. The first impact is greater for the poor, wheareas the second is only for the rich. Yet, the results should be taken with caution, as the privatization was partial, coincided with more aid flows and a public’s investments and prices management.
Key words: Public-Private-Partnership, Privatization, Water Provision, Inequality, Water-Related Diseases, Pseudo-Panel, Evaluation impact
JEL: D60, I14, I38, O12
∗"The University of Paris 1 Pantheon-Sorbonne neither approves nor disapproves the
opin-ions expressed in this dissertation: they should be considered as the author’s own."
Aknowledgements
My first thank goes naturally to Charlotte Guénard who accepted to supervised me. She dedicated to me her time, energy, with her constant patience and natural humanity. It was really a pleasure and an honour for me to work in such environment of confidence. Her support, precious remarks and feedbacks help me to progress, even out of this work.
I am endebted also to Julia Vaillant (DIAL) and François Gardes (Paris 1), that provided me a precious guidance on how to construct my data. Finally, I thank my friends, who gave continous supports that help me to end this M2 Thesis.
1
Introduction
The Millenium Development Goal, which calls for "halving the proportion of the popu-lation without sustainable access to safe drinking water between 1990 and 2015", was met in 2010. Since 1990, more than 2 billion people have gained access to improved drinking water sources (WHO-UNICEF, 2012). Nevertheless, there are 780 million people with no access to clean water. Sub-Saharan Africa is clearly lagging behind, as only 61 percent of its population has access to a safe water source.
The lack of access to safe drinking water is associated to high and extensive human costs. One of those overheads is physical health, especially for children. One in five child deaths, about 1,5 million each year, is due to diarrhoea (WHO-UNICEF, 2009). Indeed, around 88 percent of diarrhoeral deaths, in the world, are attributable to unsafe water, in-adequate sanitation and poor hygiene. Many empirical studies have showed that access to clean water is associated to better children’s health (Lee, Rosenzweig and Pitt, 1997; Jalan and Ravaillon, 2003; Galiani, Gertler and Schargrodsky, 2005; Gamper-Rabindran, Khan and Timmins, 2010; Kosec, 2011). Other important human costs are due to the time burden water collection.2 Millions of women and children are walking several hours to collect water
for the day. Thus, children’ schooling suffers from the difficulty to obtain clean water. In addition, water is a major concern for households, a source of tension within and between families, and its access could improve the well-being of all members (Devoto, Duflo, Dupas, Parienté and Pons, 2011). The economic costs associated to the poor availability of water, in terms of health spending, productivity losses, labor and investment diversion are also high, especially in Sub-Saharan Africa. Research for the 2006 Human Development Report estimates these economic costs in the region at around 5 percent of GDP, corresponding to approximately US $ 24,8 billion a year, more than the total aid flows and debt relief in 2003 (UNDP, 2006).
Many governements in the developing world, usually pushed by the international donors, embarked in the 1990s on ambitious reforms of their urban water supply and sanitation ser-vices. These reforms have often included the delegation of utilities’ supervision to private operators, under various contractual arrangements. Hopes were that Public-Private Part-nerships in the water sector would provide an efficient management of resources, more and better allocated investments, a reduction of the fiscal burden and thereby would contribute to increase both the coverage of the network and the quality of service delivery. Private participation in the water sector is a very controvertial issue. Due to ideological considera-tions but also to real economics, social and environmental quesconsidera-tions, there is for the moment no real consensus on the impact of water partial privatisation on the access of the poor, and the quality of water. Indeed, private water companies may provide sub-optimal service quality levels, as they do not take into account the extensive health externalities, such as pollution (Shirley, 2000). The privatization of the water services could also hurt the poor, due to price increases, investment only in lucrative areas, and service payment enforcement (Estache, Gomez-Lobo and Leipziger, 2001; Birdsall and Nellis, 2002). On the other hand,
2Kremer, Leino, Miguel and Zwane (2011) provide evidences that in Western Kenya, a rural household
a growing empirical literature has emphasized the improvement in water piped connection, particularly for the poor, induced by the privatization in Argentina (Galiani et al, 2005), Brazil, Argentina and Bolivia (Clarke, Kosec and Wallsten, 2009), Mexico (La Porta and Lopez-De-Silanes 1999), Cote d’Ivoire (Ménard and Clarke, 2000), Gabon (Tremolet and Neale, 2002), and Senegal (Clarke and Wallsten, 2003).1
The Senegalaise des Eaux (SDE) was created in 1995 with the participation of the So-ciété d’Aménagement Urbain et Rural (SAUR), a private firm as the main shareholder. The SDE is responsible for the production and the distribution of water in urban and peri-urban areas, the maintenance of the water network, commercial publicity and tariffs collection (Trémolet, 2006). The Société Nationale d’Exploitation des Eaux du Sénégal (SONEES), a public company that was previously in charge of the network, has now for mission to manage investments on potable infrastructures and delegate renting and granting permits (Bayliss, 2001). There are clear evidences on the improvement of the network coverage in senegalese urban areas, after the privatatization. Over the period 1996-2005, the production and the distribution of water has continously increased by respectively 16 percent and 26 percent. The number of new connections has risen by 53 percent, despite the enlargement of the urban areas population. Morevover, piped water connections grew by 33 percent, over the same period (Trémolet, 2011). Nowadays, 90 percent of people in Dakar and 85 percent in other urban centers have officially access to an improved drinking water source.2 More than 1,64 million people have gained access to the water network, particularly through 150,000 so-called "social connections" offered to the poor at a low price. Therefore, Senegal’s PPP in the water sector is often viewed as a success story, in terms of access, reliability, operational efficiency, financial sustainability and affordability (Trémolet, 2006 and 2011; Fall, Marin, Locussol and Verspyck, 2009). In the same time, water pricing has augmented on average by 3,1 percent annually, when using the price per cubic meter (Boccanfuso, Estache and Savard, 2009). One can suspect that the increase in the water network coverage has been, in the case of Senegal, at the cost of excluding the poor. Using a multi-household integrated CGE model, Boccanfuso et al. (2009) show that the partial privatization of water utilities in Sene-gal, has not benefited to the two lowest quintiles of the urban population. Indeed, over the period 1995-2001 the biggest gainers were the upper middle class and the private sector itself.
The objective of this paper is twofold. Relying on the case of Senegal, I want first to better understand the contribution of Public-Private Partnerships to help improve the pro-vision of water services to poor urban population. Using four repeated cross-sectional DHS surveys for 1993, 1997, 2005 and 2006, I construct a pseudo-panel data that allows to gauge the difference-in-differences matching estimated impact of the partial privatization on the new piped water connections. Indeed, one of the major methodological issue of this paper is due to the fact that the Public-Private Partnership in Senegal concerns most, if not all, urban centers. It is therefore impossible to rely on simple difference-in-differences as there are
1The list of papers is very long, but most of them focus on Latin America and Sub-Saharan Africa. There
are also authors who provide evidence that water services total privatization is anti-poor, both in Sub-Saharan Africa and Latin America, as discussed further.
2According to the SDE, in Dakar and in other urban areas, 79 and 63 percent of the population have
no conterfactual cases for those cities. In other words, the PPP was not randomly applied. The matching methods are considered as a robust way to considerably reduce biases from selection, due to differences in characteristics between units that received the treatment, from those in the control condition. These techniques have already been implemented to measure the impact of the privatization of water utilities in Argentina (Galiani et al, 2005), as well as reforms in the water sector in Nepal (Bose, 2009). The second objective consists in assessing the impact of the Public Private Partnership in Senegal on the water quality. Indeed, it is possible that an increase in the coverage is at the cost of a deterioration of the water safety. Following Galiani et al. (2005) and Kosec (2011), I approximate the quality of water by children’s health. Children under five’s number of diarrhoea diseases is used as a proxy for the water quality.
The results reveal that the private sector participation in the water sector has con-tributed to improve the covererage of the network, especially for the poor urban senegalese. I provide evidences that children’s diarrheas declined after the patial privatization, above all in rich urban areas. Yet, the results should be taken with caution for three main reasons. First, the water privatization in Senegal has coincided with an increase in aid flows in the sector (Trémolet, 2011). In addition, urban areas of Senegal were characterized by high rates of piped water connection before the Public-Private Partnership (Bayliss, 2002). Thus, the impact for the poor is naturally higher than for middle and upper classes that were already connected. Finally, the State continues to fixe prices, and manage investments in the sector, that are both important to explain the success of this particular privatization.
This work contributes to two strands of the literature on water partial privatization. To my knowledge, it is the first empirical microeconomic study that gauges the impact of the Public-Private Partnership in Senegal, both on the network coverage and the quality of water, measured through a water-related disease. The second contribution goes with the empirical methodology I adopted. Therefore, it is the first matching technique applied to pseudo panel data to measure private participation outcomes.
The paper proceeds as follows. In Section 2, I briefly present the pros and cons argu-ments associated to water privatization and its partial process in Senegal. The Section 3 is dedicated to the introduction of the data, and the construction of the pseudo panel. The empirical strategy and results are viewed in Section 4. Section 5 provides robustness checks. Section 6 summarizes the major findings and discusses the results, with regard to the political agenda of Senegal.
2
The Privatization Process
2.1
From State Monopoly to Privatization
The water supply is characterized by three main features, that have historically justi-fied the public management of the water sector (Galiani et al., 2005). First, water systems, that include both the supply of clean water and the elimination of sewage, are a natural monopoly. Indeed, these services involve large fixed costs and economies of scales (Noll, Shirley and Cowan, 2000; Amstrong, Cowan and Vickers, 1994).1 Second, the water sector
is characterized by the presence of huge externalities. Water related diseases are extremely contagious, and the removal of sanitation could induce pollution. Finally, human life depends on water. Thus, the demand for water is fully price inelastic at the survival level.
Yet, since the 1990s, there are growing calls to allow a regulated private sector to deliver water services (World Bank, 2002; Bayliss, 2010). According to Tynan (2000), during the 1990s, governements in the developing world has introduced private sector participation in more tant 100 water and sewerage projects. The literature usually present privatization, as a way to improve efficiency and finance in several infrastructure sectors around the world (Kes-sides, 2004; Megginson, 2005).2 According to the privatization theory, private firms has the
advantage of providing strong incentives for cost reductions and productivity enhancements to maximize their returns. In fact, empirical evidences from several sectors highly suggest that service quality, productivity and profitability rise significantly following privatization (Megginson, Nash and Van Randenborgh, 1994; Frydman, Gray, Hessel and Rapaczynsku, 1999 and La Porta and Lopez-de-Silanes, 1999).
However, there are no clear consensus on whether these gains are observable in the water sector (Clarke et al., 2009; Galiani et al., 2005). Part of the reason is due to the poor scope of competition in the water sector, that usually induced private monopoly.3 For Hall
(2002), privatization are overwhelming dominated by the same french multinational com-panies (Saur, Suez and Vivendi), that control the world’s private water supply. Meggisson (2005) emphasizes that privatization in infrastructure sectors provide better results when it is associated with reforms that encourage competition. Unregulated private providers may undersupply the socially optimal quality of water, exclude low-income households from the network by raising prices, strictly enforcing payment, and concentrating their investments in high-income areas (Galiani et al, 2005). On the other side, private participation in water supply delivery may have a smaller impact on the coverage, than for other services, due to the usual public interference in pricing decisions after the privatization (Clarke et al., 2009).
1In addition, there is little competition to well functionning water system, from alternative sources (Foster,
1999 and Estache et al., 2001).
2see also Megginson and Netter, 2001 and Shirley and Walsh, 2001.
3According to Estache and Atsushi(2009), even in the public procurement context, the degree of competion
Empirical studies reflect this lack of consensus on the impact of water total or partial privatization. Let’s take, as example, some papers on the case of Latin America. Galiani et al. (2005) show that municipalities that have privatized their water supply in Argentina are characterized by important improvements in the number of piped connections, as well as in the quality of water. These enhancements are higher for the poor. Nevertheless, most of municipalities they analysed have recently broke contract with private firms. Clarke et al. (2009) find also that the share of connected households to the water network and sewage has increased following the privatization in Argentina, Bolivia and Brazil. However, the authors show that the share of connected households improved also in non-privatized water regions, meaning that private participation in not, per se, responsible from those gains. Hailu, Guer-reiro Osorio and Tsukada (2009) explain why Bolivia has renationalized its water sector, due to prices increases and quite poor results.
Western and Central Africa have one of the longest experiences with Public-Private Partnerships in the water sector (Fall, Marin, Locussol and Verspyck, 2009). During the last two decades, 15 countries, out of 23 in the region, has delegated part of their water service delivery to a private firm. One of the major explanation of such fast emergence of private management is the pressions exerced by the Bretton Woods organizations and the main aid donors agencies (Bayliss, 2010; Berthélémy, Kauffmann, Valfort and Wegner, 2004). Accord-ing to Ariyo and Jerome (1999), at the end of the 1980s the majority of african countries have received help from the World Bank for privatization plans, and 67 percent of adjust-ment loans were conditional to public firms reforms. Therefore, there is a high correlation between privatization and international aid flows. In 1989, Guinea has received 102,6 million of dollars to invest in its water sector, after the conclusion of the partial privatization. In Western and Central Africa, the affermage contract is depicted as well adapted (Fall et al., 2009). It combines private operation of the service with public financing for developing the infrastructure. Affermage involves a sharing commercial risk between the public and private partners. It has have been used for water supply services in Côte d’Ivoire, Senegal, Niger, Guinea, Central African Republic, and Cameroon as well as for combined power and water services in the Gambia. In Cote d’Ivoire, an affermage contract has been in place since 1960, and brought remarkable outcomes. In Senegal, it has allowed to achieve the highest access rates of all countries in Sub-Saharan Africa. In the region, main of the PPPs involved two large french water distribution companies, SAUR International (in Côte d’Ivoire, Guinea, Senegal, Mali and Central African Republic) and Veolia (in Burkina Faso, Niger, Chad and Gabon).1
1For Fall et al.(2009), five PPPs in Central and Western Africa failed to significantly expand access to piped
water or improve the efficiency of operations. These countries are the Gambia, Central African Republic, Chad, Guinea-Bissau and Sao Tome. Problems with power production and transmission, usually coupled to the water supply privatization (The Gambia and Chad), as well as the small size of the customer base (the Gambia, Central African Republic, Guinea-Bissau and Sao Tome) have affected the financial viability of these contracts.
2.2
The Partial Privatization Process in Senegal
After the Senegal’s independance in 1960, the Compagnie des Eaux,1 a private water
util-ity company, has been put in charge to the water services delivery. The sector was then nationalized in 1972, and important investments have been made by the State. Neverthe-less, the poor performances in terms of maintenance went with a quite fast deterioration of the infrastructures. At this time, the Société Nationale d’Exploitation des Eaux du Sénégal (SONEES) looked after the maintenance and improvement of water supply in cities and the Governement determined tariff changes. The beginning of the 1990s was characterized by a countinous deterioration of the SONEES’ financial situation, that prevented the public com-pany to expend its water supply outside the urban centers, and thereby meet the Millenium Development Goals (Boccanfuso et al., 2005). The sustainability of water supply in Dakar generate risen concerns. Moreover, international donors has conditioned the provision of long term financing to the delegation of the water service delivery to a private operator (Trémolet, 2011). Their arguments were that the private participation would improve the operational efficiency, conduce to a more rigourous management of the investements and allow the sector to be at its financial equilibrium in 2003.
Since April 1996, Senegal has entrusted the management of the distribution and sanita-tion of its urban water network to the Senegalaise des Eaux (SDE). The SDE is responsible for water production and distribution in 56 urban centers.2 The affermage contract3 also
delegates the maintenance of the water network, the commercial publicity and the tariff col-lection to the private firm. On the other hand, the SONEES has seen is role reduced, and must essentially manage the investments on potable infrastructures, control the quality of the service delivery and delegate rent. The first contract of 10 years, from 1996 to 2006, was extended for 5 years until 2011. In 2010, the former President of Senegal, Abdoulaye Wade, has announced the total privatization of the water sector and the non-renewval of the contract with the SDE in 2011. Nevertheless, due to the presidential scrunity of 2012 and the non-satisfaction of the supply’s tender, it has been decided to extend the contract for one more year. The position of the new elected president, Macky Sall is not clear. However, he does not have denounced such total privatization plan.
According to the World Health Organization’s Water Supply Statistics (2010), constant improvements are observerd in Senegal both in terms of sanitation and in the coverage of the water network. The proportion of the total population served with piped water goes from 24 percent in 1995 to 38 in 2008. It goes further in urban areas where the propor-tion of connected ranges from 53 percent to 74 in 2008. Several empirical studies have been interested in the case of Senegal (Kerf, 2000; Boccanfuso, Estache and Savard, 2005; Trémolet, 2006 and 2011). If all depicted a success, the incidence on the poor is controversial.
1The Compagnie des Eaux is the former french multinational firm, Veolia Environnement
2The 56 urban centers for which the Sénégalaise des Eaux is in charge of the water delivery concern about
more than 5 million people (SDE website).
3Trémolet (2006, 2011) provide evidences that the affermage contract concluded by Senegal was based on
3
Data
3.1
Data Sources
The Data come from the Demographic and Health Surveys (DHS) for Senegal in 1993, 1997, 2005 and 2006. These four cross-sectional surveys have been randomly collected and are quite similar. Indeed the same questions are asked to household’s members. DHS surveys provide informations on households characteristics, access to water and children’s diseases.
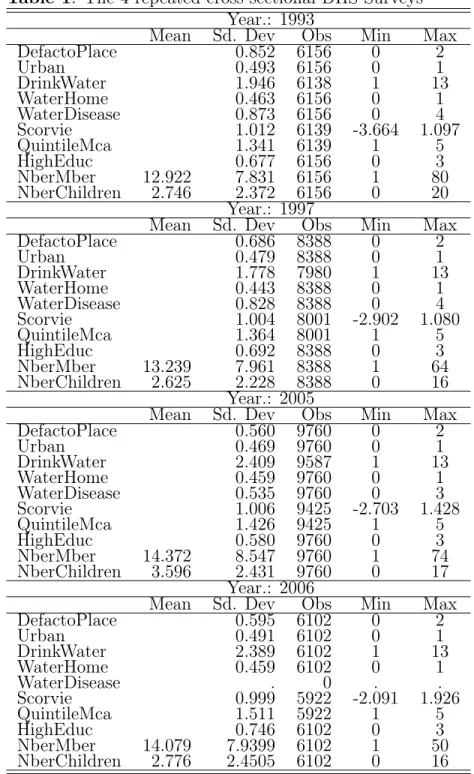
Table 1 presents some descriptive statistiques on the key variables of interest, for each year. The variable DefactoPlace is about the actual place of residence of househoulds. It ranges from 0 to 2, with 0 accounting for "Capital and big cities", 1 for " Small cities" and 2 for "Countryside and town". Naturally, as the privatization concerns only urban areas, the focus to gauge its impact would be on the capital, big and small cities. Urban is a dummy variable that takes the value of 1 if the household is living in an urban area, and 0 other-wise. DrinkWater is certainly the main variable of interest in our datasets. It provides very precise information on the source of the drinking water households have. I am interesting in the evolution of the improved water sources, that are "Piped Water", "Fontaine Terminal", "Private Well" and "Public Well", as depicted in the Figure 1. I have created a dummy variable, WaterHome, that takes the value of 1 if the family has a direct connection to the water network (i.e Piped Water), and 0 otherwise.
As there is no mention on households’ income, I have constructed a Wealth Index, relying on a Multiple Correspondance Analysis (MCA). Filmer and Pritchett (2001) and Rutstein and Johnson (2004) have compared the DHS Wealth Index with traditional indexes of expenditures. They conclude that the Wealth Index better represents long-term economic status and is much easier to implement. However, in our case, some usual dimensions used to compute the DHS Wealth Index were missing, not the same for each DHS.1 As a result, the
Wealth Index has been constructed thanks to dummy variables about whether the household has or not a television, a car, a bicycle, a motorcycle, a frige and a radio. Thank to this famous method, one has an idea of the wealthiest households and will be abble to focus on the poor. In the Table 1, this index refers to the variable "Scorvie". I also calculate quintiles of this wealth index, named QuintileMca; the highest the quintile, the richest.
In addition, DHS surveys provide many households characteristics, such as the level of education (HighEduc), the age of the household’s head (AgeHead), the number of members (NberMber) and children (NberChildren), that could help explain why some households have a piped water connection. These datasets also provides informations about the number of children diseases in the last twoo weeks, by household, as the typical water-related disease,
1Indeed, Wealth Indexes are most commonly compute with other dimensions, such as whether the
house-hold has electricity, phone, video but also its main type of floor, roof meterial, toilet, source of drinking and non drinking water and the time to collect water. To implement our empirical strategy, all water-related variables have been kept apart. The other dimensions were not available for at least one year. In order to have wealth indexes computed on the same basis, I have decided to keep only the dimensions that were available for all surveys.
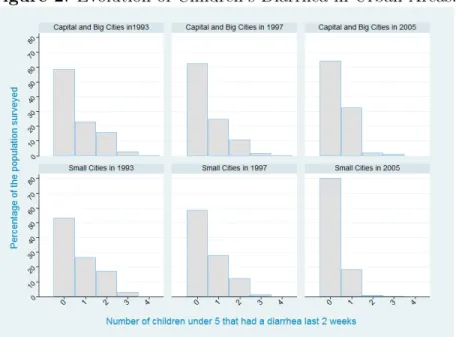
diharea, nammed WaterDisease. The evolution of this last variable, by type of place of residence, is shown in the Figure 2.
Table 1: The 4 repeated cross sectional DHS Surveys Year.: 1993
Mean Sd. Dev Obs Min Max DefactoPlace 0.852 6156 0 2 Urban 0.493 6156 0 1 DrinkWater 1.946 6138 1 13 WaterHome 0.463 6156 0 1 WaterDisease 0.873 6156 0 4 Scorvie 1.012 6139 -3.664 1.097 QuintileMca 1.341 6139 1 5 HighEduc 0.677 6156 0 3 NberMber 12.922 7.831 6156 1 80 NberChildren 2.746 2.372 6156 0 20 Year.: 1997
Mean Sd. Dev Obs Min Max DefactoPlace 0.686 8388 0 2 Urban 0.479 8388 0 1 DrinkWater 1.778 7980 1 13 WaterHome 0.443 8388 0 1 WaterDisease 0.828 8388 0 4 Scorvie 1.004 8001 -2.902 1.080 QuintileMca 1.364 8001 1 5 HighEduc 0.692 8388 0 3 NberMber 13.239 7.961 8388 1 64 NberChildren 2.625 2.228 8388 0 16 Year.: 2005
Mean Sd. Dev Obs Min Max DefactoPlace 0.560 9760 0 2 Urban 0.469 9760 0 1 DrinkWater 2.409 9587 1 13 WaterHome 0.459 9760 0 1 WaterDisease 0.535 9760 0 3 Scorvie 1.006 9425 -2.703 1.428 QuintileMca 1.426 9425 1 5 HighEduc 0.580 9760 0 3 NberMber 14.372 8.547 9760 1 74 NberChildren 3.596 2.431 9760 0 17 Year.: 2006
Mean Sd. Dev Obs Min Max DefactoPlace 0.595 6102 0 2 Urban 0.491 6102 0 1 DrinkWater 2.389 6102 1 13 WaterHome 0.459 6102 0 1 WaterDisease . 0 . . Scorvie 0.999 5922 -2.091 1.926 QuintileMca 1.511 5922 1 5 HighEduc 0.746 6102 0 3 NberMber 14.079 7.9399 6102 1 50 NberChildren 2.776 2.4505 6102 0 16
Note: This table reports the summary of statistics of the main variables of interest for the DHS one year period 1993, 1997, 2005 and 2006. As the majority of variables are dummies or orered, their averages are not reported, as not meaningful. We do not have informations on children under five’s diahrrea in the DHS 2006 survey. Plainty of missing points in the variables Scorvie and Quintilemca are due at least one not re-ported assets holding.
Figure 1: Source of Drinking Water by Year, in Urban Areas.
Note: The graphs report the evolution in the main sources of improved drinking water among households surved in the four cross-sectional DHS Data, according to their places of residence. Remember, we are interesting only in urban areas, represented by the places of residence "Capital and Big Cities" and "Small Cities". Thus I drop the curves for rural areas. Our main source of drinking water of interest is "Piped Water". In the Y-axis, are represented the corresponding proportion of households that have access to those four main sources of safe water, in our 4 cross-sectionnal DHS surveys.
Figure 2: Evolution of Children’s Diarrhea in Urban Areas.
Note: The graphs picture the evolution of the number of diarrhea children under five had in the two weeks before the households have been surveyed. As announced, there are no data available for the year 2006. Here again, we are interested only in urban areas. The number of children related diseases ranges from 0 to 4, per two weeks.
3.2
The Construction of the Pseudo-Panel
The main objective of this paper is to measure the impact of the Public-Private Parten-ership instaured in 1996, thanks to a Difference-in-Differences analysis. Therefore we need a panel data, in order to gauge the impact of the privatization on both the new water connec-tion and the quality of the blue gold, measured by children’s diarrhoea diseases. Nevertheless, there is no panel data available for Senegal. A major limit of repeated random cross-sectional data, is that the same individuals are not followed over time. On the other hand, repeated cross-sections suffer much less from typical panel data problems of attrition and nonresponse.1
Deaton (1986) proposes the use of cohorts to estimate a fixed effects model from repeated cross-sections. In his approach, individuals sharing some common characteristics invariant in time, such as the year of birth, are grouped into cohorts, after which the averages within these cohorts are treated as observations in a pseudo panel. Many researchers have demon-strated the robustness of pseudo-panel estimation results, with regard to true panel data (Bourguignon and and Goh, 2004; Gardes et al., 2005).
Two major empirical criteria have been found by the literature, in order to obtain precise estimates when relying on pseudo-panel data. First, cells should be homogenous. This cri-teria implies to have a sufficient number of similar characteristics among individuals within cells, and thus a quite large number of variables to construct cells. At the other hand, a second important criteria asks for a sufficient number of individuals among each cell. In fact, there are empirical evidences that one should have at least 100 households or individuals in each cell, to reduce measurement errors (Verbeek and Nijman, 1992).
I have decided to build a Pseudo Panel thanks to the repeated cross-sectional DHS sur-veys of Senegal. I construct cohorts of the household’s head’s year of birth, separated by ten years old. To elaborate the cells of the pseudo-panel, I add other characteristics, such as the actual place of residence, the level of literacy, and the ethny. For sure, the place of residence may change over time. However, as the privatization takes place only in urban centers, and we have no information about migration of households, I have decided to include the place of residence to obtain more homogenous cells. In the same vein, one could think truely that the level of literacy may change over time, even for the household’s head. Yet, my major concern was to obtain quite homogenous cells.
As a results, 381 cells have been obtained. Those groups of households are therefore similar with regard to their place of residence, their ethny, the cohort and the level of liter-acy of their household’s head. Each cell contains on average 199 households. The standard deviation is quite high, 90, meaning that we have cells that contains largly more than the average, and others with only 7 or 8 households. In fact, it is quite difficult with so precise variables and a very diversified country in terms of ethnicity as Senegal to find homogenous groups in terms of the numbers of households in each cell.
A second step of the construction of the Pseudo Panel consists in making the average of all characteristics, by cells and year. In order to facilitate the computation of the results, I
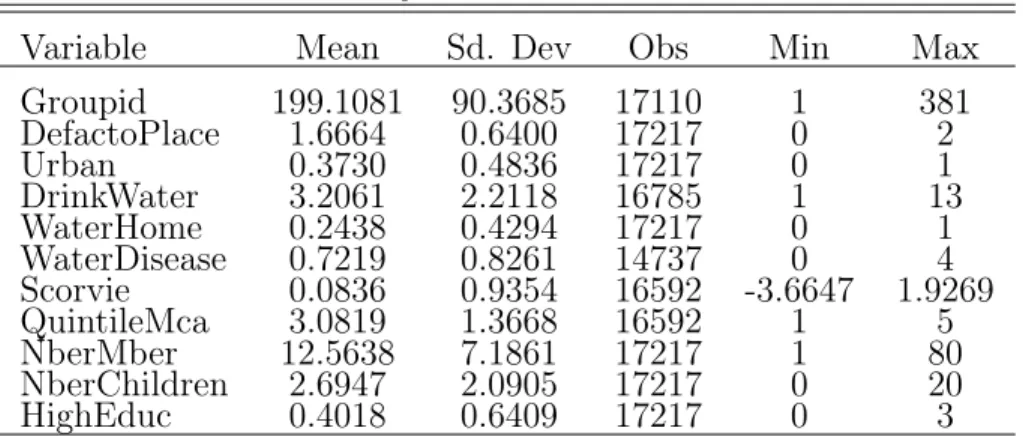
also make the average among each cell, with regard to the variables WaterHome, DefactoPlace and WaterDisease.1 Table 2 provides a summary statistics on the Pseudo Panel Data’s main variables of interest.
Table 2: Summary statistics of The Pseudo-Panel Variable Mean Sd. Dev Obs Min Max Groupid 199.1081 90.3685 17110 1 381 DefactoPlace 1.6664 0.6400 17217 0 2 Urban 0.3730 0.4836 17217 0 1 DrinkWater 3.2061 2.2118 16785 1 13 WaterHome 0.2438 0.4294 17217 0 1 WaterDisease 0.7219 0.8261 14737 0 4 Scorvie 0.0836 0.9354 16592 -3.6647 1.9269 QuintileMca 3.0819 1.3668 16592 1 5 NberMber 12.5638 7.1861 17217 1 80 NberChildren 2.6947 2.0905 17217 0 20 HighEduc 0.4018 0.6409 17217 0 3
Note: The Groupid variable is the new unit of observation. The average num-ber of households in each group is about 199. We have on average 17217 ob-servations due to the computation of averages among each cell, with regard to variables WaterHome, WaterDisease, DefactoPlace, Year and Groupid.
1These variables will be necessary to identify the Treatment, as well as the Dependent variables, in our
logit regressions. In fact, computing the average of those charecteristics would not allow to rigorously measure the impact of the privatization, as they are dummies or ordered variables.
4
Empirical Strategy and Results
4.1
Measuring Partial Privatization Impact in Senegal
The main objective is to identify the average effect of the Public-Private Partenership on the coverage of the water network and the children’s diarrhea in urban areas of Senegal. In other words, I want to gauge the average impact of the treatment on the treated. To mea-sure the impact of a reform, it is now common, when randomized experiments are ethically or financiary impossible, to rely on a difference-in-differences analysis. Such methodology implies to identify a treatment group, that is touched by the reform, and to compare it to a counterfactual group. This control group could be different from the treatment group in his characteristics, before the reform. Nevertheless, these two groups, the one that is touched by the reform and the one that is excluded from the reform, should had evolved in the same way in their characteristics, even after the reform.
In Senegal, the Public-Private Partnership has been instaured in 1996, in 56 urban centers simultaneously. Indeed, the PPP was not randomly assigned between rural and ur-ban areas, that have evolved differently before and after the private management of water resources. Therefore, it is impossible to identify a control group, relying on simple difference-in-differences. Despite this difficulty, I try to estimate the average impact of the private participation on access and water quality. For this purpose, I assume that among urban centers even if all households have been targeted for the PPP (ie. before the reform), only some of them have effectively seen their water supply managed by the private firm (ie. after the reform). This a strong but necessary assumption to mesure the impact of a water supply reform, that simultaneously touched all urban centers.
Rosenbaum and Rubin (1983) proposed propensity score matching as a method to reduce the bias in the estimation of treatment effects with observational datasets. These techniques have become progressively popular in medical trials and in the evaluation of economic policy interventions. They allow to identify a control group, among a potentially treated population. Since in observational studies assignment of subjects to the treatment and control groups is not random, the estimation of the effect of treatment may be biased by the existence of confounding factors. Propensity score matching is a way to correct the estimation of treatment effects controlling for the existence of these confounding factors. Indeed, the bias is reduced when the comparison of outcomes is performed using treated and control subjects as similar as possible. Since matching subjects on an n-dimensional vector of characteristics is not feasible for large n, this method proposes to summarize pre-treatment characteristics of each subject into a single-index variable, the propensity score. The propensity score is the conditional probability of receiving treatment, given pre-treatment characteristics:
p(X) ≡ P r(T = 1|X) = E(T |X) (1) with T = {0, 1} is the indicator of exposure to treatment and X is the multidimensional vector of pre-treatment characteristics.
Rosenbaum and Rubin (1983) show that if the exposure to treatment is random within cells defined by X, it is also random within cells defined by the values of the one-dimensional variable p(X). As a result, given a population of units denoted by i, if the propensity score p(Xi) is known, then the Average effect of Treatment on the Treated (ATT) can be estimated
as follows:
AT T ≡ E(Yi,1− Yi,0|Ti = 1) (2)
= E(E(Yi,1− Yi,0|Ti = 1, p(Xi)) (3)
= E(E(Yi,1|Ti = 1, p(Xi)) − E(Yi,0|Ti = 0, p(Xi)|Ti = 1) (4)
where the external expectation is over the distribution of (p(Xi)|Ti = 1) and Yi,1 and Yi,0
are the potential outcomes in the two counterfactual situations of respectively treatment and no treatment.
Two hypotheses are needed to derive the Average Treatment on the Treated (2) given the propensity score (1).
Lemma 1. Balancing of pre-treatment variables given the propensity score. If p(X) is the propensity score, then T ⊥ X|p(X)
Lemma 2 Unconfoundedness given the propensity score. Suppose that assignment to treatment is unconfounded:
Y1, Y0 ⊥ T |X
Then, assignment to treatment is unconfounded given the propensity score Y1, Y0 ⊥ T |p(X)
If the Balancing Hypothesis is satisfied (Lemma 1), units with the same propensity score must have the same distribution of observable and unobservable characteristics, inde-pendently of their treatment status. Therefore, for a given propensity score, exposure to treatment is random and thus treated and control units should be on average observationally identical.
The estimated propensity scores depend on the definition of the Treatment. In our case, the treatment is " have seen the water services delivery partially privatized in 1996". Therefore, we define the treatment group as households that in 1996, because there were located in the capital city, or in big and small cities, have been effectively touched by the privatization of their water services. Using the variables, DefactoPlace and Year, the treat-ment is thus in our specification, living in capital, big and small cities, after 1993, as we have no data for 1996. Then, the propensity scores allow, according to similar characteristics, to identify the treatment and the control groups among the urban population of Senegal. The identification of the propensity scores consists in a logit regression, in which the Treatment is the dependent variable. The choice of the covariates (ie, the explanatory variables) to insert in the propensity score model should be based on theory, as well as on statistical tests (Heckman, Ichimura, Smith and Todd, 1998; Heckman and Smith, 1999; Black and Smith, 2004). According to Smith and Todd (2005) only variables that impact simultaneously the treatment status and the outcome variable should be included in the regression. In this paper two outcomes of the partial privatization are analyzed; the change in the water connection
and the number of children’s diarrhea by family.
Following those empirical findings, the propensity score model I implement has for co-variates the actual place and region of residence, household’s head’s age and marital status, his level of education and literacy, the quintile of Wealth Index, and the number of members and children in the family. Indeed, it is clear in the case of Senegal that the place of residence have played an important role, as discussed in Section 2 and 3. Moreover, it is possible that in regions where the infrastructures of the water network were the most developed before the privatization, such as Dakar (Bayliss, 2002), the private participation impact on access has been greater. The levels of income, approximated by the Wealth Index, could go with new connections of households.1. The marital status often tells us that the households has
two sources of income. One can also think that a more educated household’s head, who can also read the contract, would also have more chance to know the risks associated to bad water quality. In addition, educated people often have better and well paid jobs and would certainly prefer to spend less time in fetching water, and more for productive activities or leisure. The number of members and children both correspond to higher physical health costs associated to unsafe water. In addition, conflicts and tensions within households would certainly be more important when the household’s size is large.2 The second variable on
which the water privatization impact is measured, children’s diahrrea, is highly correlated to the water accessibility. Therefore, the same propensity score model is used. I check naturally the balancing property, that was satisfied. As a robustness check, a non linear specification of the propensity score model is provided.
A second step consists in assessing the Average Treatment on the Treated (ATT), relying also on probit or logit specification, thanks to the propensity scores previously predicted. Various methods are available for such purpose. The standard matching strategy induces to pair each treated subject i with one or more comparable non-treated subjects. We then associate to the outcome Yiobs, a matched outcome ˆYi(0) given by the weighted outcomes of
its neighbors in the comparison group. I rely on this Propensity Score Matching methods, at first, to measure the impact of the partial privatization on enlargement of the water piped connections. The dependent variable shows the positive change in the connection to the water network.It is a dummy variable that takes the value of 1 if the household did not have a piped water connection in 1993, but benefited from a connection in 1997, 2005 or 2006. Otherwise, the variable "WaterChange" takes the value of 0 for cases where the households had already access to the water network, before the private management, or still do not have access to water after. Then, to measure the Pubic-Private Partnership’s outcomes on the water quality, I use the same methodology with the same propensity scores; the dependent variable is the number of children under 5 years old’s diahrreas.
1As ever mentionned, following the Public-Private Partnership prices have increased in Senegal(Boconfuso
et al (2009).
2Moreover, Olivier (2010) shows that in the case of Dakar, the family’s size dicreases the tariffs’
4.2
Results
4.2.1 The Public-Private Partnership Impact on Water Access
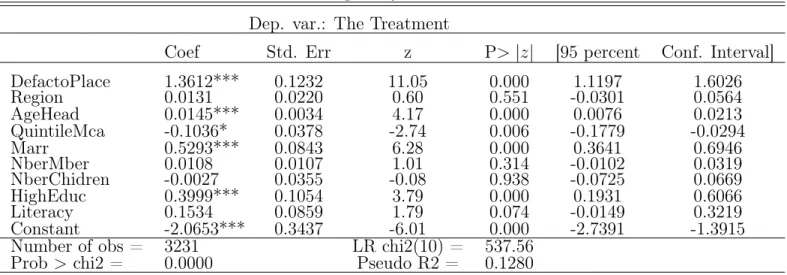
Table 3 reports the propensity score model. The dependent variable of the logit regression is the treatment. Results are robuts and propensity score has been estimated on a common support for treated and controls. Therefore, one can consider only observations for which propensity score belongs to the supports’ intersection of the propensity score , beteween treated and controls. The regression shows that the level of literacy of the household’s head, as well as the number of households members and children are not important determinants for explainig the membership to the treatment or the control group. The region of residence also does not influence the distribution between the treated and the controls. This last result suggests that being located for instance in Dakar, instead of Saint Louis, does not matter. However, as expected, the place of residence, as well as the level of approximated income and education of the household’s head play a role. Figures 3a and 3b illustrate those propensity scores for both the Treatment group and the Control one, based on common support.
Table 3: The Propensity Score Model Dep. var.: The Treatment
Coef Std. Err z P> |z| [95 percent Conf. Interval] DefactoPlace 1.3612*** 0.1232 11.05 0.000 1.1197 1.6026 Region 0.0131 0.0220 0.60 0.551 -0.0301 0.0564 AgeHead 0.0145*** 0.0034 4.17 0.000 0.0076 0.0213 QuintileMca -0.1036* 0.0378 -2.74 0.006 -0.1779 -0.0294 Marr 0.5293*** 0.0843 6.28 0.000 0.3641 0.6946 NberMber 0.0108 0.0107 1.01 0.314 -0.0102 0.0319 NberChidren -0.0027 0.0355 -0.08 0.938 -0.0725 0.0669 HighEduc 0.3999*** 0.1054 3.79 0.000 0.1931 0.6066 Literacy 0.1534 0.0859 1.79 0.074 -0.0149 0.3219 Constant -2.0653*** 0.3437 -6.01 0.000 -2.7391 -1.3915 Number of obs = 3231 LR chi2(10) = 537.56
Prob > chi2 = 0.0000 Pseudo R2 = 0.1280
Note: Propensity score result from a logit linear regression on common support. The dependent variable is the Treate-ment, defined has living in the capital, big cities or the small ones, in 1997 and after. All of households, that were living in those places, are potential target to see their water supply privatized. The propensity scores permits, thanks to the independent variables above, to identify those who are treated, and those who are not. Standard Errors are robusts and *, **, *** indicates significance at 10, 5 and 1 percent levels.
Figure 3a: Predicted Propensity Scores, the Treatment and the Control Groups
Notes: This graph represents the control and treatment groups, derived from propensity score logit regression (Table 3). Notice that all of our further regression will be based on common support. The control group off the common support is very small, due to common support specification.
Figure 3b: Predicted Propensity Scores, the Control and Treatment Groups by Kernel Density
Notes: This graph represents the same control and treatment groups as described above Here, the kernel density graph permits to show the importance of the common support.
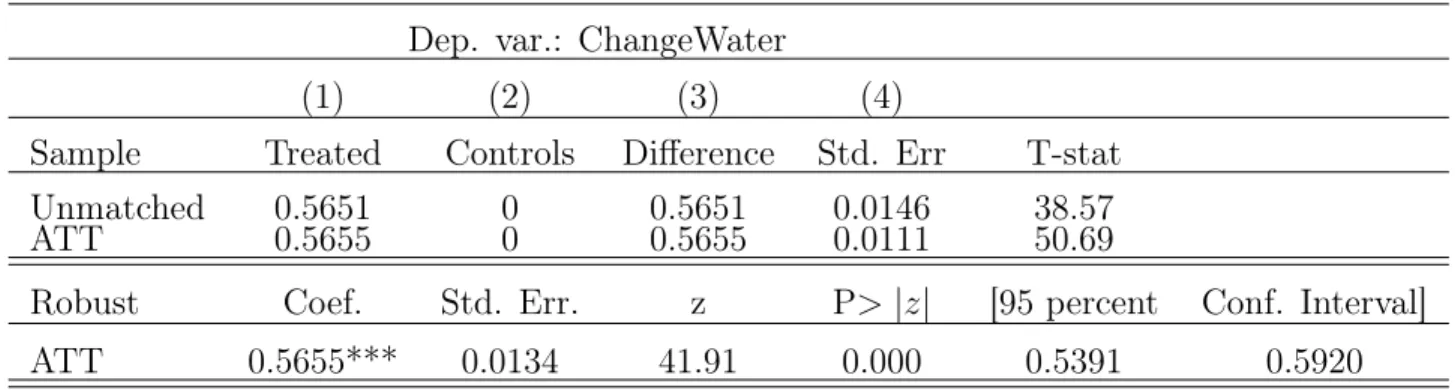
Table 4 provides evidence support of the benefit from partial privatization in terms on new connections. The first row shows the results for the unmatched sample, without taking account of the propesity scores. Column (1) gives the the Public-Private Partnership impact observed on the treatment group, and Column(2) the estimated impact on the controls. Col-umn (3) presents the difference-in-differences matching impact of the partial privatization on new piped water connections. The second row presents our main results of interest, based on propensity scores, but are not robust. The coefficient for the controls is null by definition of the treatment. The last row reports the robust Average Treatment on the Treated. One can observe that on average, the Public-Private Partnership impact on the treated is positive. Therefore, the partial water privatization have played a significant role in the improvement of piped connection. In addition to its significance, the coefficient associated to the impact of the privatization is large. Indeed, 56,5 percent of households in average gained access to water, due to the private participation in the water sector.
Table 4: The Public-Private Partnership Impact on Piped Connections Dep. var.: ChangeWater
(1) (2) (3) (4)
Sample Treated Controls Difference Std. Err T-stat Unmatched 0.5651 0 0.5651 0.0146 38.57 ATT 0.5655 0 0.5655 0.0111 50.69
Robust Coef. Std. Err. z P> |z| [95 percent Conf. Interval] ATT 0.5655*** 0.0134 41.91 0.000 0.5391 0.5920
Notes: This table presents the matching estimates of the Average Treatement on the Treated (ATT), based on common support. All regressions are logit. The dependent variable is ChangeWater, a dummy that takes the value of 1, if the households did not have a connection to the water network in 1993 but have one after 1997, and 0 otherwise. The results are robusts only in last row and *** indicates significance at 1 percent level. The numbers of households treated and controls on common support are respectively 1975 and 1145.
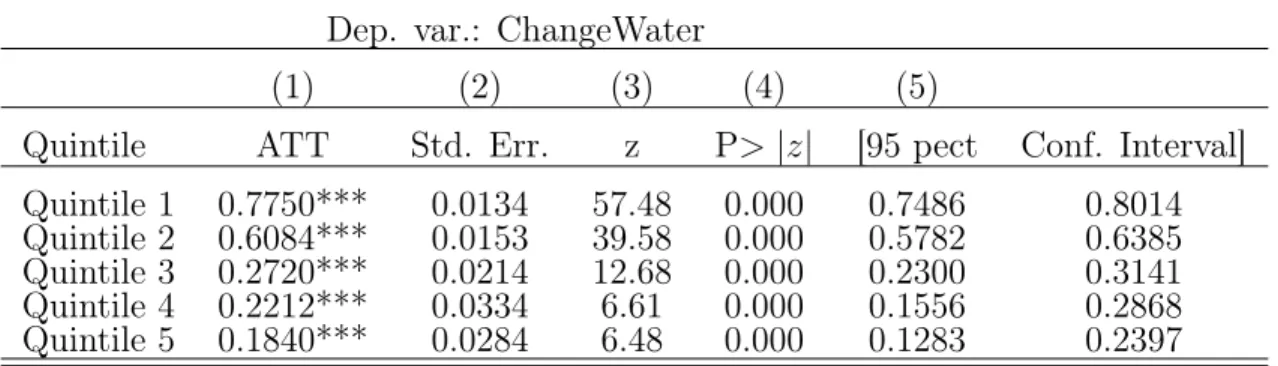
The impact on the poor is one of the major controvesial issue surrounding the private participation in the water sector. Table 5 provides evidence on the impact of the partial water privatization on new connection, by quintiles of the wealth index. Propensity scores have been computed for ecah quintile of the wealth index, and thus, differ from one group to another. Each row corresponds to a quintile. Column(1) provides the average impact of private participation on the gain to piped water access. Results show that the impact of the privatization decreases with the level of the wealth index. Quintile 1, that corresponds to the approximated poorest households, is characterized by the highest average impact of the private participation on new private connections. Indeed, 77 percentage point of the piped connection are due to the partial privatization in the poorest quintile. On the other side, only 18 percentage point of the new connection in the richest quintile are due to the private sector participation. Nevertheless, one should take those results with caution. Indeed, as al-ready mentioned it is possible, that in 1996, when the governement has allowed the SAUR to manage the water services delivery, the richest quintile was already connected to the network. However, the results show evidence that the Public-Private Partenership is not anti-poor, in
the case of Senegal’s urban areas.
Table 5: The PPP Impact on Piped Connections, by Quintiles of Wealth Index Dep. var.: ChangeWater
(1) (2) (3) (4) (5)
Quintile ATT Std. Err. z P> |z| [95 pect Conf. Interval] Quintile 1 0.7750*** 0.0134 57.48 0.000 0.7486 0.8014 Quintile 2 0.6084*** 0.0153 39.58 0.000 0.5782 0.6385 Quintile 3 0.2720*** 0.0214 12.68 0.000 0.2300 0.3141 Quintile 4 0.2212*** 0.0334 6.61 0.000 0.1556 0.2868 Quintile 5 0.1840*** 0.0284 6.48 0.000 0.1283 0.2397
Notes: All regressions are logit. The dependent variable is ChangeWater, a dummy variable that takes the value of 1, if the households did not have a connection to the water network in 1993 but have one after 1997, and 0 otherwise. Propensity scores have been obtained for each quintile, in the same way. The balancing property was not respected for the fourth quintile, but was for others. The Standard Errors are robusts and *** indicates significance at 1 percent level.
4.2.2 The Public-Private Partnership Impact on Childrens’ Health
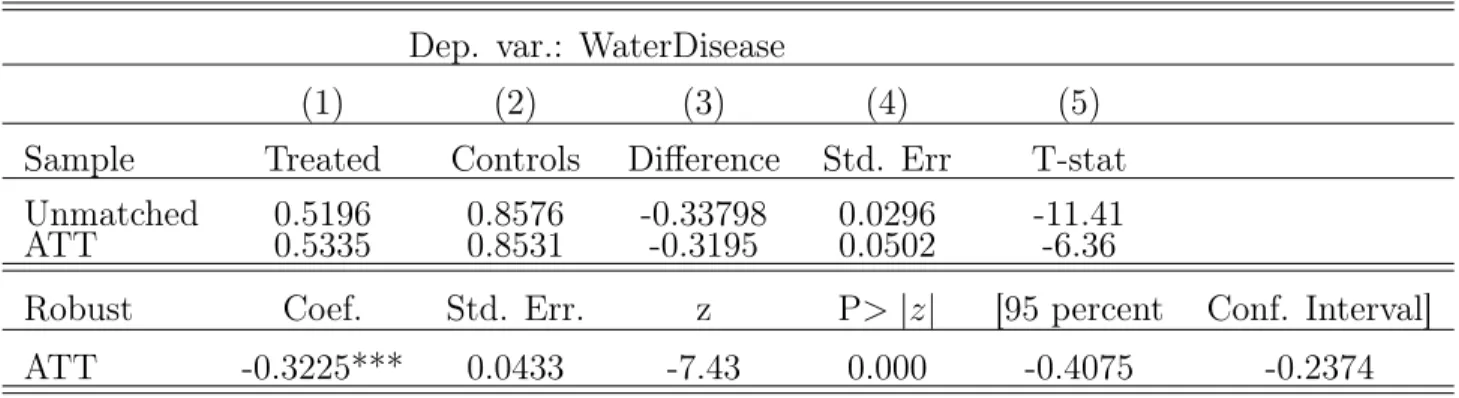
A second objective of this paper is to see whether the quality of the distributed water has increase with the private participation in the water sector. As already mentionned, I approximate the quality of water by the number of children under five’s diarrheas two weeks before the household’s survey. Table 6 summarizes the major findings. The last row presents the robust average effect of the partial privatization on the number of children under five years old’s diarrheas, by household treated. The results provide evidence that the quality of water has increased following the Public-Private Partnership, in Senegal. Indeed, on the treated, the number of diarrhea by households significantly falls by 32,25 pourcentage points.
Table 6: The Public-Private Partnership Impact on Children’s Diarrheas Dep. var.: WaterDisease
(1) (2) (3) (4) (5)
Sample Treated Controls Difference Std. Err T-stat Unmatched 0.5196 0.8576 -0.33798 0.0296 -11.41 ATT 0.5335 0.8531 -0.3195 0.0502 -6.36
Robust Coef. Std. Err. z P> |z| [95 percent Conf. Interval] ATT -0.3225*** 0.0433 -7.43 0.000 -0.4075 -0.2374
Notes: This table presents the impact of the private sector participation to the water service delivery, in terms of the quality of water. The dependent variable WaterDisease. The last row provides the robust Average Treat-ment on the Treated and and *** indicates significance at 1 percent level. The numbers of households treated and controls on common support are respectively 1981 and 1145.
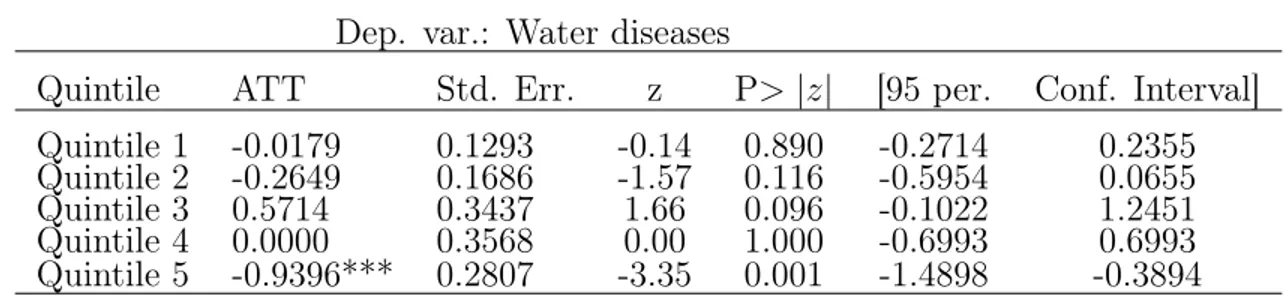
Table 7 provides counter-intuitive results. In fact, the poor households, even if there are those who gained the most in terms of access to piped water connections, have not seen the number of their children water-related diseases decreased. On the other hand, the richest households, despite the fact they were those who gained the less from the partial privatiza-tion process, are those that benefited the most from improvement in the quality of water, expressed by the number of children under five’s diarrheas. There are several possible expla-nations of this discrepancy, between the results presented in Table 5 and those in Table 7. First, it is possible that the quantity of water, and not only its accessibility, plays a role in the number of children diarrheas. Second, the diarrhoeal diseases are not only explained by poor access to water, but also by poor hygiene and sanitation.
Table 7: The PPP Impact on Children’s Diarrheas, by Quintiles of Wealth Index Dep. var.: Water diseases
Quintile ATT Std. Err. z P> |z| [95 per. Conf. Interval] Quintile 1 -0.0179 0.1293 -0.14 0.890 -0.2714 0.2355 Quintile 2 -0.2649 0.1686 -1.57 0.116 -0.5954 0.0655 Quintile 3 0.5714 0.3437 1.66 0.096 -0.1022 1.2451 Quintile 4 0.0000 0.3568 0.00 1.000 -0.6993 0.6993 Quintile 5 -0.9396*** 0.2807 -3.35 0.001 -1.4898 -0.3894
Notes: All regressions are logit, based on common support. Propensity scores have been obtained by the same specification, for each quintile of wealth index. The dependent variable is the number of diarrhea for children under five years old, by households. Results are robuts.
5
Robustness
5.1
Non linear Propensity Score Model
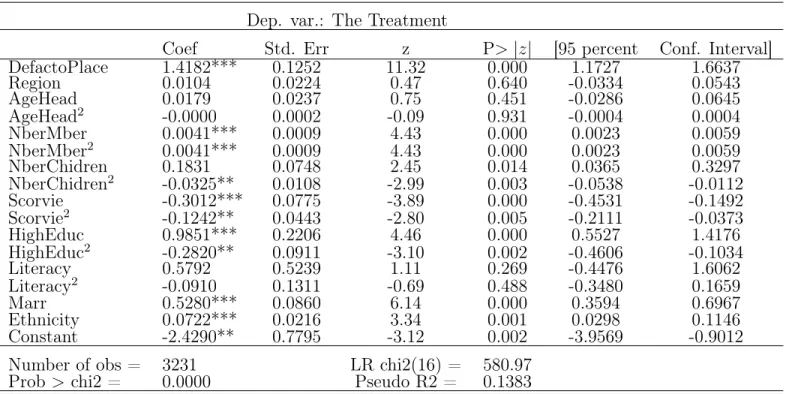
The validity of the results above presented depends on the propensity score model. There-fore, a non linear specification of the propensity scores could provide a robustness checks. Table 8 presents this non linea propensity score model. The dependent variable is the Treat-ment. In this specification, the level of literacy of the head, as well as the number of house-holds members and children are determinants for explaining the membership to the treatment or the control group, the contrary of what I have found in Table 4. The region of residence still do not influence the distribution between the treated and the controls. As previously also, the place of residence, as well as the level of approximated revenues and education of the head play a significant role. To obtain more robuts findinds afterwards, I specifed the propensity scores on the common support, here again.
Table 8: Non Linear Specification for Predicted Propensity Scores. Dep. var.: The Treatment
Coef Std. Err z P> |z| [95 percent Conf. Interval] DefactoPlace 1.4182*** 0.1252 11.32 0.000 1.1727 1.6637 Region 0.0104 0.0224 0.47 0.640 -0.0334 0.0543 AgeHead 0.0179 0.0237 0.75 0.451 -0.0286 0.0645 AgeHead2 -0.0000 0.0002 -0.09 0.931 -0.0004 0.0004 NberMber 0.0041*** 0.0009 4.43 0.000 0.0023 0.0059 NberMber2 0.0041*** 0.0009 4.43 0.000 0.0023 0.0059 NberChidren 0.1831 0.0748 2.45 0.014 0.0365 0.3297 NberChidren2 -0.0325** 0.0108 -2.99 0.003 -0.0538 -0.0112 Scorvie -0.3012*** 0.0775 -3.89 0.000 -0.4531 -0.1492 Scorvie2 -0.1242** 0.0443 -2.80 0.005 -0.2111 -0.0373 HighEduc 0.9851*** 0.2206 4.46 0.000 0.5527 1.4176 HighEduc2 -0.2820** 0.0911 -3.10 0.002 -0.4606 -0.1034 Literacy 0.5792 0.5239 1.11 0.269 -0.4476 1.6062 Literacy2 -0.0910 0.1311 -0.69 0.488 -0.3480 0.1659 Marr 0.5280*** 0.0860 6.14 0.000 0.3594 0.6967 Ethnicity 0.0722*** 0.0216 3.34 0.001 0.0298 0.1146 Constant -2.4290** 0.7795 -3.12 0.002 -3.9569 -0.9012 Number of obs = 3231 LR chi2(16) = 580.97
Prob > chi2 = 0.0000 Pseudo R2 = 0.1383
Notes: This table represents a non-linear method to obtain propensity scores, by a logit regression. The dependent vari-able is the Treatment. AgeHead2 is the squared of the age of the household’s head. In the same line NberMember2, HighEduc2, Literacy2, Scorvie2 are the squared of the number of the member in the household, the level of education, the level of literacy of the head, and the wealth index score, respectively. Standard Errors are robusts and *, **, *** indicate significance at 10, 5 and 1 percent levels.
As Table 4, Table 9 provides evidence support that the partial privatization in Sene-gal, has gone with more access to piped water. Based on the non-linear specification of the propensity scores model, the robust coefficient associated to the ATT in terms of new connections to the network is exactly the same as in the linear propensity score model.
Table 9: The PPP Impact on Piped Connections, with Non-linear Propensity Scores Dep. var.: ChangeWater
Sample Treated Controls Difference Std. Err T-stat Unmatched 0.5651 0 0.5651 0.0146 38.57 ATT 0.5651 0 0.5651 0.0108 52.06
Robust Coef. Std. Err. z P> |z| [95 percent Conf. Interval] ATT 0.5651*** 0.0090 62.56 0.000 0.5474 0.5829
Notes: This table presents logit regressions. Results rely on the non-linear method to predict propensity scores described in Table 8. The dependent variable is ChangeWater. The results are robusts in the last row and *** indicates significance at 1 percent level. The numbers of households treated and controls on common support are respectively 2086 and 1145.
Table 10 exhibts the robustness of our previous results on the Public-Private Part-nership’s incidence on the quality of water. Therefore, the difference-in-dirrences matching impact of the partial privatization in terms on the children waterborn diseases is negative. Here also, the estimated coefficient of the ATT is significant at 1 percent and around to -0,3.
Table 10: The PPP Impact on Children’s Diarrheas with Non-linear Propensity Scores Dep. var.: Water Disease
Sample Treated Controls Difference Std. Err T-stat Unmatched 0.5196 0.8576 -0.3379 0.0296 -11.41 ATT 0.5196 0.8758 -0.3561 0.0775 -4.60
Robust Coef. Std. Err. z P> |z| [95 percent Conf. Interval] ATT - 0.3561*** 0.0743 -4.79 0.000 -0.5019 -0.2104
Notes: This table represents the second stage of our matching method, based on the non-linear method to pre-dict propensity scores (Table 8). All regressions are logit, but only the last one is robust. The dependent variable is the number of children’s diahrreas 2 weeks before the survey. The number of treated and control based on common support are respectively 2086 and 1145.
5.2
Other Matching Methods
Matching techniques imply to choose an algorithm, that pairs controls and treated. Until now, the results come from only one algorithm method, the Propensity Score Matching. As additional robustness checks, it could be interesting to see the results according to other matching algorithms.
Nearest Neighbor Matching is considered as the most straightforword matching estimator (Caliendo and Kopeining, 2005). It matches treated and control units by taking each treated and searching for the control unit with the closest propensity score( i.e. the Nearest Neigh-bor). In other words, the NN method assigns a weight of one to the nearest non-participant and zero to the others. If there are more than one individual in the neighborhood, then it assigns equal weight to each and a weight of zero to all people outside the neighborhood.
NN matching faces the risk of bad matches, if the closest neighbour is far away. This can be avoided by imposing a tolerance level on the maximum propensity score distance. This is what does the Radius Matching algorithm.
Kernel matching and Local Linear Matching are non-parametric matching estimators that use weighted averages of all individuals in the control group to construct the counterfactual outcome. Thus, one major advantage of these approaches is the lower variance achieved because more information is used.
Table 11 and 12 provide evidence that regardless the algorithm method one chooses, the outcomes induced by the private sector participation are similar to the previous ones, respec-tively on the new connection to the network and the increase in water quality.
Table 11: The PPP Impact on Piped Connections, under Other Methods of Matching Dep. var.: Change Water
Method Coef. Std. Err. z P> |z| [95 percent Conf. Interval] Radius Matching 0.5651*** 0.0099 57.06 0.000 0.5457 0.5846 Local Linear Matching 0.5651*** 0.0107 52.38 0.000 0.5440 0.5863 Nearest Neighbor Matching 0.5651*** 0.0117 47.93 0.000 0.5420 0.5883 Kernel Matching 0.5651*** 0.0114 49.38 0.000 0.5427 0.5876
Notes: All regressions are logit. The dependent variable is WaterChange, a dummy variable that takes the value of 1 if the household did not have a piped water connection in 1993, but gained it after 1997. Results are robusts and *** indicates significance at 1 percent level.
Table 12: The PPP Impact on Children’s Diarrheas, under Other Methods of Matching Dep. var.: WaterDisease
Method Coef. Std. Err. z P> |z| [95 percent Conf. Interval] Radius Matching -0.3379*** 0.0364 -9.28 0.000 -0.4093 -0.2665 Local Linear Matching -0.3379*** 0.0310 -10.89 0.000 -0.3988 -0.2771 Nearest Neighbor Matching -0.3379*** 0.0278 -12.13 0.000 -0.3926 -0.2833 Kernel Matching -0.3379*** 0.0310 -10.89 0.000 -0.3988 -0.2771
Notes: All regressions are logit. The dependent variable is children under five years old’s number of diarrheas in last 2 weeks. Results are robusts and *** indicates significance at 1 percent level.
5.3
Other Improved Water Sources
The main objective of this paper was to see wether the partial privatization of water has induced in the case of Senegal an improved access to the blue gold. Until now, we have only considered this improvement as the number of new households connected to the private network. Nevertheless, as discussed in Figure 2, there are several other sources of drinking water that are considered as safe one. Table 13, 14 and 15 provide evidence that households have gained access to other safe drinking water sources, due to the Public-Private Partnership. In Table 13, I examine whether the urban senegalese have seen their access to water through Fontaine Terminals increased, after the partial privatization. Results show that, on average, the private participation to the water service delivery has induced an enhancement in urban access to fontaine terminal by about 18 percentage points. Table 14 presents the impact of the Public-Private Partnership on access to water by Private Wells, and Table 15, thanks to Public Wells. In both cases, the impact of the privatization was positive for urban. Nevertheless, partial privatization has induced twice more new access to water through public than by private wells.
Table 13: The PPP Impact on Access, by Fontaine Terminals Dep. var.: Change Fontaine Terminal
Sample Treated Controls ATT Std. Err t-stat Unmatched 0.1816 0 0.1816 0.0113 15.94 ATT 0.1816 0 0.1816 0.0084 21.52
Robust Coef. Std. Err. z P> |z| [95 percent Conf. Interval] ATT 0.1816*** 0.0077 23.30 0.000 0.1664 0.1969
Notes: All regressions are logit. The dependent variable is "ChangeFontaineTerminal", a dummy variable that takes the value of 1 if the household did not have access to water through a fontaine terminal, and gained it after 1997. The results are computed thanks to the propensity scores obtained by the regression describes in Table 4. The number of treated and controls on common support basis are respectively 2086 and 1145. Results are robusts in the last row and *** stands for a significance at 1 percent level.
Table 14.: The PPP Impact on Access, by Private Wells Dep. var.: Change Private Wells
Sample Treated Controls ATT Std. Err t-stat Unmatched 0.0743 0 0.0743 0.0077 9.58 ATT 0.0743 0 0.0743 0.0057 12.94
Robust Coef. Std. Err. z P> |z| [95 percent Conf. Interval] ATT 0.0743*** 0.0058 12.68 0.000 0.0628 0.0857
Notes:All regressions are logit. The dependent variable is "ChangePrivateWell", a dummy variable that takes the value of 1 if the household did not have access to water thanks to a private well and gained it after 1997. The results are computed thanks to the propensity scores obtained by the regression describes in Table 4. The number of treated and controls, on common support basis are respectively 2086 and 1145. Results are robusts in the last row and *** stands for a significance at 1 percent level.
Table 15: The PPP Impact on Access, by Public Wells Dep. var.: Change Public Wells
Sample Treated Controls ATT Std. Err t-stat Unmatched 0.1337 0 0.1337 0.0100 13.29 ATT 0.1337 0 0.1337 0.0074 17.94
Robust Coef. Std. Err. z P> |z| [95 percent Conf. Interval] ATT 0.1337*** 0.0070 19.07 0.000 0.1200 0.1474
Notes: All regressions are logit. The dependent variable is "ChangePublicWell", a dummy variable that takes the value of 1 if the household did not have access to water through a public well and gained it after 1997. The results are computed thanks to the propensity scores obtained by the regression describes in Table 4. The number of treated and controls, on common support basis are respectively 2086 and 1145. Results are robusts in the last row and *** stands for a significance at 1 percent level.
6
Concluding Remarks
In march, a storm of protest has shooked Senegal. For the famous senegalese rapper Thiat, the reason was not only due to the candidacy of Abdoulaye Wade. According to the singer, the cost of living and access to water and electricity are among the reasons why the Senegalese took the streets. Indeed, the privatization, even partial, of a human life depending sector as water is usually denounced as an anti-poor decision. In this paper, I have emphasized that in Senegal the private delegation of the water supply has induced, overall, an increase in access to water. Whatever the improved source of drinking water, the private firm’s man-agement has allowed a better access. This improvement is bigger in terms of new private connection. Moreover, the poor senegalese are those who have benefited the most from new piped connections. Nevertheless, if the Public-Private Partnership is not anti-poor, it is may be not per se, pro-poor. The partial privatization programs always coincide with a time at which infrastructures are developed, and upper and middle classes already have access to the water network. This idea could explain why, despite the annual continuous increase of the price, the water partial privatization has induced a greater impact for the poor. Moreover, the State have controled tariffs for the poor. The programs for social connections, largely financed by NGOs, the World Bank and the public sector, could also be one reason of the greater impact on the poor. Then, I also attempt to gauge the PPP’s impact on the quality of water, approximated by the number of children’s diarrheas. If overall the number of chil-dren’s water-related diseases has fallen after the PPP, this impact is not homogenous between quintiles of Wealth Index. Indeed, only rich households seem to have benefited from a better water quality. One can however suspect the fact that the quantity of water used, in addition to the sanitation and hygiene, are also important determinants of children’s diarrheas.
This year, the affermage contract concluded between the SAUR, the SONEES, and the Government of Senegal, comes to its end. If the new President of Senegal, Macky Sall, did not mentioned a total privatization of the water sector, he promised the one of electricity. Following his previous President and mentor, Abdoulaye Wade, he will probably announce in few month the total delegation of the sector to a new private firm. There are plainty of risks associated to such kind of decision. Indeed, until now the price, investments, as well as the control quality was in the hands of the public sector. Poor and rural areas may suffer from their low rentability if the total privatization is signed.
Overall, many improvements can be done on this paper. First, I am conscious that the way I measure the wealthiest of households is quite poor, due to missing points in my datasets. Second, it is possible that implemented matching methods on pseudo-panel data is not very robust, even if it has already been done. Among possible enhancements, there is the use of the national statistics surveys, that would allow to obtain more rigourous cells in the pseudo-panel and thereby reduce the biases present in the estimation of the average impact of the privatization. Moreover, having declared incomes is certainly better than a Wealth Index, when studying a 10-year period.
References
Ariyo, Ademola and Afeikhena Jerome. 1999. “Privatization in Africa: An Appraisal.”, World Development. 27(1): 201-213.
Armstrong, Marc, Simon Cowan and John Vickers. 1994. “Regulatory Reform: Economic Analysis and British Experience.”, Cambridge: MIT Press.
Black, Dan A., and Jeffrey A. Smith. 2004. “How Robust is the Evidence on the Effects of College Quality ? Evidence from Matching.”, Journal of Econometrics. 121(1): 99-124.
Bayliss, Kate. 2002. “Water Privatization in Sub-Saharan Africa: Progress, Problems, and Policy Implications.” Unpublished Manuscript.
Bayliss, Kate. 2003. “Utility Privatization in Sub Saharan Africa, a case study of water ”, Journal of Modern African Studies. 41(4): 507-531.
Berthélémy Jean-Claude, Céline Kauffmann, Marie-A. Valfort and Lucia Wegner. 2004. “Privatisation in Sub-Saharan Africa: where do we stand”, OECD Development Centre Sudies.
Birdsall, Nancy and John Nellis. 2002. “Winners and Losers: Assessing the Distributional Impact of Privatization ”, Centre for Global Development, Working Paper No. 6, Washing-ton, D.C., mai.
Birdsall, Nancy. and John. Nellis. 2003. “The Distributional Impact of Privatisation”, Centre for Global Development, Washington D.C., janvier.
Boccanfuso, Dorothée, Antonio Estache and Luc Savard. 2005. “A Poverty and Inequality Impact Assessment of Liberalization of Water Utility in Senegal: A Macro-Micro Analysis.”, Cahiers de recherche 05-13, Departement d’Economique de la Faculte d’administration à l’Universite de Sherbrooke.
Boccanfuso, Dorothée, Antonio Estache and Luc Savard. 2009. “Distributional impact of developed countries CC policies on Senegal : A macro-micro CGE application.”, Cahiers de recherche 09-11, Departement d’Economique de la Faculte d’administration à l’Universite de Sherbrooke.
Bourguignon, François. and Chor-ching Goh. 2004. “Estimating individual vulnerability to poverty with pseudo-panel data”, World Bank Policy Research Working Paper 3375, August 2004
Bose, Ron. 2006. “The impact of Water Supply and Sanitation interventions on child health: evidence from DHS surveys”, Unpublished Manuscript.
Clarke, George R.G., and S. Wallsten. 2003. “Universal Service: Empirical Evidence on the Provision of Infrastructure to Rural and Poor Urban Consumers. In Infrastructure for Poor People: Public Policy for Private Provision”, edited by Penelope J. Brook and Timothy C. Irwin, 21?76. Washington, D.C.: World Bank.
Clarke, George R.G., Katrina Kosec and Scott Wallsten.2009. “Has Private Participation in Water and Sewerage Improved Coverage ? Empirical Evidence from Latin America.”, Journal of International Development. 21(3): 327-361.
Devoto, Florencia, Esther Duflo, Pascaline Dupas, William Parienté and Vincent Pons. 2011. “Happiness on Tap: Piped Water Adoption in Urban Morocco.”, CEPR Discussion Papers 8326, C.E.P.R. Discussion Papers.
Deaton, Angus. 1986. “Panel Data from a Time Series of Cross Sections. ”, Journal of Econometrics. 30: 109-126.
Esrey, S., J. Potash, L. Roberts and C. Shiff. 1991. “Effects of Improved Water Supply and Sanitation on Ascariasis, Diarrhea, Dracunculiasis, Hookworm Infection, Schistosomiasis and Trachoma.”, Bulletin of the World Health Organization. 69(5): 609-21.
Estache, Antonio, and Iimi Atsushi. 2009. “(UN)Bundling Infrastructure Procurement Evidence from Water Supply and Sewage Projects.”, Policy Research Working Paper
Estache, Antonio, Andreas Gomez-Lobo and Dany Leipziger. 2001. “Utilities Privatization and the Poor: Lessons and Evidence from Latin America.”, World Development. 29(7): 1179-98.
Fall, Matar, Philippe Marin, Alain Locussol and Richard Verspyck. 2009. “Reforming Urban Water Utilities in Western and Central Africa: Experiences with Pupblic-Private Partenerhip.”, Water Sector Broad Discussion Paper.World Bank.
Fewtrell, Lorna, and John M. Colford. 2004. “Water, Sanitation and Hygiene: Interventions and Diarrhea. A Systematic Review and Meta-analysis.”, HNP Discussion Paper, World Bank, July 2004.
Filmer, Deon, and Lant Pritchett. 2001. “Estimating Wealth Effects without Expenditure Data-Or Tears: Tears: An Application to Educational Enrollments in States of India.”, Demography. 38(1): 115-32.
Foster, V. 1999. “Literature Review for Regional Studies Project on Privatization and Infraestructure Services of the Urban Poor.”, World Bank.
Frydman, R., C. Gray, M. Hessel and A. Rapaczynsku. 1999. “When Does Privatization Work? The Impact of Private Ownership on Corporate Performance in the Transition Economies.”, Quarterly Journal of Economics. 114(4): 1153-91.