CONDITION ASSESSMENT OF BRIDGE STRUCTURES
USING STATISTICAL ANALYSIS OF WAVELETS
Thèse
Vahid Shahsavari
Doctorat en génie civil
Philosophiae Doctor (Ph. D.)
Québec, Canada
CONDITION ASSESSMENT OF BRIDGE STRUCTURES
USING STATISTICAL ANALYSIS OF WAVELETS
Thèse
Vahid Shahsavari
Sous la direction de :
Josée Bastien, directrice de recherche
Luc Chouinard, codirecteur de recherche
iii
RÉSUMÉ
La surveillance à distance des structures a émergé comme une préoccupation importante pour les ingénieurs afin de maintenir la sécurité et la fiabilité des infrastructures civiles pendant leur durée de vie. Les techniques de surveillance structurale (SHM) sont de plus en plus populaires pour fournir un diagnostic de "l'état" des structures en raison de leur vieillissement, de la dégradation des matériaux ou de défauts survenus pendant leur construction. Les limites de l'inspection visuelle et des techniques non destructives, qui sont couramment utilisées pour détecter des défauts extrêmes sur les parties accessibles des structures, ont conduit à la découverte de nouvelles technologies qui évaluent d’un seul tenant l'état global d'une structure surveillée. Les techniques de surveillance globale ont été largement utilisées pour la reconnaissance d'endommagement dans les grandes infrastructures civiles, telles que les ponts, sur la base d'une analyse modale de la réponse dynamique structurale. Cependant, en raison des caractéristiques complexes des structures oeuvrant sous des conditions environnementales variables et des incertitudes statistiques dans les paramètres modaux, les techniques de diagnostic actuelles n'ont pas été concluantes pour conduire à une méthodologie robuste et directe pour détecter les incréments de dommage avant qu'ils n'atteignent un stade critique. C’est ainsi que des techniques statistiques de reconnaissance de formes sont incorporées aux méthodes de détection d'endommagement basées sur les vibrations pour fournir une meilleure estimation de la probabilité de détection des dommages dans des applications in situ, ce qui est habituellement difficile compte tenu du rapport bruit à signal élevé. Néanmoins, cette partie du SHM est encore à son stade initial de développement et, par conséquent, d'autres tentatives sont nécessaires pour parvenir à une méthodologie fiable de détection de l'endommagement.
Une stratégie de détection de dommages basée sur des aspects statistiques a été proposée pour détecter et localiser de faibles niveaux incrémentiels d'endommagement dans une poutre expérimentale pour laquelle tant le niveau d'endommagement que les conditions de retenue sont réglables (par exemple ancastrée-ancastrée et rotulée-rotulée). Premièrement, des expériences ont été effectuées dans des conditions de laboratoire contrôlées pour
iv
détecter de faibles niveaux d'endommagement induits (par exemple une fissure correspondant à 4% de la hauteur d’une section rectangulaire équivalente) simulant des scénarios d'endommagement de stade précoce pour des cas réels.
Différents niveaux d'endommagement ont été simulés à deux endroits distincts le long de la poutre. Pour chaque série d'endommagement incrémentiel, des mesures répétées (~ 50 à 100) ont été effectuées pour tenir compte de l'incertitude et de la variabilité du premier mode de vibration de la structure en raison d'erreurs expérimentales et du bruit. Une technique d'analyse par ondelette basée sur les modes a été appliquée pour détecter les changements anormaux survenant dans les modes propres causées par le dommage. La réduction du bruit ainsi que les caractéristiques des agrégats ont été obtenues en mettant en œuvre l'analyse des composantes principales (PCA) pour l'ensemble des coefficients d'ondelettes calculés à des nœuds (ou positions) régulièrement espacés le long du mode propre. En rejetant les composantes qui contribuent le moins à la variance globale, les scores PCA correspondant aux premières composantes principales se sont révélés très corrélés avec de faibles niveaux d'endommagement incrémentiel. Des méthodes classiques d'essai d'hypothèses ont été effectuées sur les changements des paramètres de localisation des scores pour conclure objectivement et statistiquement, à un niveau de signification donné, sur la présence du dommage. Lorsqu'un dommage statistiquement significatif a été détecté, un nouvel algorithme basé sur les probabilités a été développé pour déterminer l'emplacement le plus probable de l'endommagement le long de la structure.
Deuxièmement, se basant sur l'approche probabiliste, une série de tests a été effectuée dans une chambre environnementale à température contrôlée pour étudier les contributions relatives des effets de l’endommagement et de la température sur les propriétés dynamiques de la poutre afin d’estimer un facteur de correction pour l'ajustement des scores extraits. Il s'est avéré que la température avait un effet réversible sur la distribution des scores et que cet effet était plus grand lorsque le niveau d'endommagement était plus élevé. Les résultats obtenus pour les scores ajustés indiquent que la correction des effets réversibles de la température peut améliorer la probabilité de détection et minimiser les fausses alarmes. Les résultats expérimentaux indiquent que la contribution combinée des algorithmes utilisés dans cette étude était très efficace pour détecter de faibles niveaux d'endommagement
v
incrémentiel à plusieurs endroits le long de la poutre tout en minimisant les effets indésirables du bruit et de la température dans les résultats. Les résultats de cette recherche démontrent que l'approche proposée est prometteuse pour la surveillance des structures. Cependant, une quantité importante de travail de validation est attendue avant sa mise en œuvre sur des structures réelles.
Mots-clés : Détection et localisation des dommages, Poutre, Mode propre, Ondelette,
vi
ABSTRACT
Remote monitoring of structures has emerged as an important concern for engineers to maintain safety and reliability of civil infrastructure during its service life. Structural Health Monitoring (SHM) techniques are increasingly becoming popular to provide ideas for diagnosis of the "state" of potential defects in structures due to aging, deterioration and fault during construction. The limitations of visual inspection and non-destructive techniques, which were commonly used to detect extreme defects on only accessible portions of structures, led to the discovery of new technologies which assess the "global state" of a monitored structure at once. Global monitoring techniques have been used extensively for the recognition of damage in large civil infrastructure, such as bridges, based on modal analysis of structural dynamic response. However, because of complicated features of real-life structures under varying environmental conditions and statistical uncertainties in modal parameters, current diagnosis techniques have not been conclusive in ascertaining a robust and straightforward methodology to detect damage increments before it reaches its critical stage. Statistical pattern recognition techniques are incorporated with vibration-based damage detection methods to provide a better estimate for the probability of the detection of damage in field applications, which is usually challenging given the high noise to signal ratio. Nevertheless, this part of SHM is still in its initial stage of development and, hence, further attempts are required to achieve a reliable damage detection methodology.
A statistical-based damage detection strategy was proposed to detect and localize low levels of incremental damage in an experimental beam in which the level of damage and beam restraint conditions are adjustable (e.g. fixed-fixed and pinned-pinned). First, experiments were performed in controlled laboratory conditions to detect small levels of induced-damage (e.g. 4% crack height for an equivalent rectangular section) simulated for early stage damage scenarios in real cases. Various levels of damage were simulated at two distinct locations along the beam. For each sate of incremental damage, repeat measurements (~ 50 to 100) were performed to account for uncertainty and variability in
vii
the first vibration mode of the structure due to experimental errors and noise. A modal-based wavelet analysis technique was applied to detect abnormal changes occurring in the mode shapes caused by damage. Noise reduction as well as aggregate characteristics were obtained by implementing the Principal Component Analysis (PCA) into the set of wavelet coefficients computed at regularly spaced nodes along the mode shape. By discarding components that contribute least to the overall variance, the PCA scores corresponding to the first few PCs were found to be highly correlated with low levels of incremental damage. Classical hypothesis testing methods were performed on changes on the location parameters of the scores to conclude damage objectively and statistically at a given significance level. When a statistically significant damage was detected, a novel Likelihood-based algorithm was developed to determine the most likely location of damage along the structure.
Secondly, given the likelihood approach, a series of tests were carried out in a climate-controlled room to investigate the relative contributions of damage and temperature effects on the dynamic properties of the beam and to estimate a correction factor for the adjustment of scores extracted. It was found that the temperature had a reversible effect on the distribution of scores and that the effect was larger when the damage level was higher. The resulted obtained for the adjusted scores indicated that the correction for reversible effects of temperature can improve the probability of detection and minimize false alarms.
The experimental results indicate that the combined contribution of the algorithms used in this study were very efficient to detect small-scale levels of incremental damage at multiple locations along the beam, while minimizing undesired effects of noise and temperature in the results. The results of this research demonstrate that the proposed approach may be used as a promising tool for SHM of actual structures. However, a significant amount of challenging work is expected for implementing it on real structures.
Key-words: Damage Detection and Localization, Beam, Mode Shape, Wavelet, Principal
viii
TABLE OF CONTENTS
RÉSUMÉ ... iii
ABSTRACT ... vi
TABLE OF CONTENTS ... viii
LIST OF TABLES ... xii
LIST OF FIGURES ... xiii
LIST OF ABBREVIATIONS ... xviii
LIST OF SYMBOLS ... xx
DEDICATION ... xxiv
ACKNOWLEDEGMENTS ... xxv
FOREWORD ... xxvi
CHAPTER 1 ... 1
1. Structural Health Monitoring (SHM) ... 1
1-1 Introduction ... 1
1-2 Objectives of SHM ... 3
1-3 SHM Solution Steps ... 4
1-4 Problem Statement ... 7
1-5 General Objectives of the Research ... 10
1-6 Originality ... 11
1-7 Thesis Outline ... 12
CHAPTER 2 ... 14
2. Literature Review ... 14
2-1 Introduction ... 14
2-2 Introduction to Natural Frequencies and Mode Shapes ... 14
2-3 Global Picture of SHM ... 18
2-4 Global Monitoring Methods ... 20
2-4-1 Vibration-Based Damage Detection Methods ... 20
2-4-2 Vibration-Based Signal Processing Techniques ... 29
ix
2-5 Concluding Remarks ... 44
2-6 Wavelet Transform (WT) ... 49
2-6-1 Introduction to Wavelets ... 49
2-6-2 Continuous Wavelet Transform (CWT) ... 53
2-6-3 Vanishing Moment ... 55
2-8 Conclusions ... 57
CHAPTER 3 ... 59
3. Methodology ... 59
3-1 Experimental Program ... 59
3-2 Test Setup Configuration ... 60
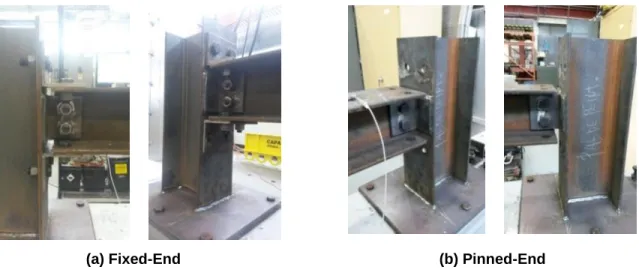
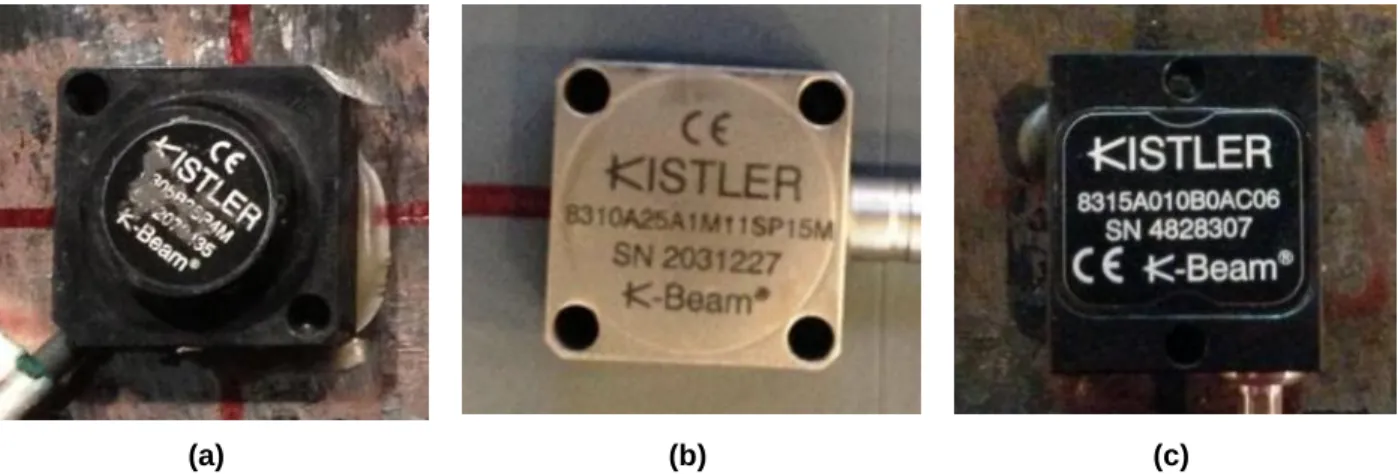
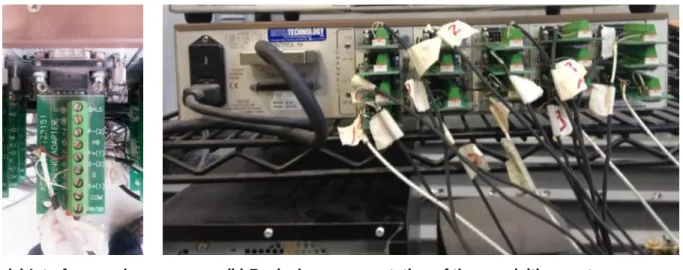
3-2-1 Test Object ... 60 3-2-1 Definition of Damage ... 61 3-2-3 Stiffening Tool ... 62 3-2-4 Boundary Conditions ... 62 3-2-5 Excitation Method ... 63 3-2-6 Accelerometers ... 63 3-2-7 Mounting Method ... 64 3-2-8 Acquisition System ... 65 3-2-9 Climate-Controlled Room ... 66 3-3 Signal Processing ... 68
3-3-1 Mode Shape Extraction ... 70
3-3-2 Extrapolation and Interpolation ... 73
3-3-3 Continuous Wavelet Transform (CWT) ... 73
3-3-4 Principal Component Analysis (PCA) ... 74
3-3-5 Hypothesis Testing ... 76
3-3-6 Likelihood Test ... 79
CHAPTER 4 : AVANT-PROPOS... 82
4. Likelihood-Based Testing of Wavelet Coefficients for Damage Detection in Beam Structures ... 84
4-1 Abstract ... 84
4-2 Introduction ... 85
x
4-4 Comparative Study of Damage Detection Techniques ... 93
4-4-1 Techniques Based on the Natural Frequency ... 93
4-4-2 Modal Assurance Criterion (MAC) ... 94
4-4-3 Mode Shape Curvature (MSC) ... 95
4-4-4 Discrete Wavelet Transform (DWT) ... 96
4-4-5 Continuous Wavelet Transform (CWT) ... 100
4-5 Damage Detection and Localization Algorithm ... 102
4-5-1 Principal Component Analysis (PCA) ... 102
4-5-2 Statistical Detection of Damage ... 104
4-5-3 Likelihood-Based Localization of Damage ... 111
4-6 Conclusions ... 115
4-7 Nomenclatures ... 117
4-8 References ... 119
CHAPTER 5 : AVANT-PROPOS... 124
5. Wavelet-Based Analysis of Mode Shapes for Statistical Detection and Localization of Damage in Beams Using Likelihood Ratio Test ... 126
5-1 Abstract ... 126
5-2 Introduction ... 127
5-3 Damage Detection Algorithm ... 131
5-3-1 Continuous Wavelet Transform (CWT) ... 133
5-3-2 Principal Component Analysis (PCA) ... 134
5-3-3 Hypothesis Testing ... 137
5-3-4 Likelihood Ratio (LR) ... 139
5-4 Experimental Setup... 141
5-5 Results and Discussion ... 145
5-6 Conclusions ... 156
5-7 Nomenclatures ... 158
5-8 References ... 160
CHAPTER 6 : AVANT-PROPOS... 164
6. Detection of Structural Damage under Varying Environmental Conditions ... 166
6-1 Abstract ... 166
xi
6-3 Methodology ... 170
6-3-1 Continuous Wavelet Transform (CWT) ... 170
6-3-2 Principal Component Analysis (PCA) ... 172
6-3-3 Likelihood Ratio (LR) Test ... 174
6-4 Experimental Setup and Protocol ... 175
6-5 Correction of Wavelet Coefficients for Thermal Effects ... 177
6-6 Conclusions ... 187
6-7 Nomenclatures ... 189
6-8 References ... 191
CHAPTER 7 ... 194
7. Conclusion and Future Work... 194
7-1 Conclusion ... 194
7-2 Future Work ... 197
APPENDIX A ... 200
xii
LIST OF TABLES
Table 1-1: Most frequently used nondestructive methods... 2 Table 3-1: A typical representation of an acceleration time-history output for an array of sixteen accelerometers. ... 68 Table 4-1: Damage scenarios corresponding to damage locations 1 and 2. ... 92 Table 4-2: Damage identification with MAC method. ... 95 Table 4-3: Summary of results for the t-test between two independent samples (E0, E1).110 Table 4-4: The results of the Mann-Whitney U-test between two independent samples (E0, E1). ... 110 Table 5-1: Parameters for test setups for the experimental program. ... 144 Table 5-2: Summary of results for the t-test between two scores at levels E0 and E1. ... 151 Table 5-3: The results of the Mann-Whitney U-test between two scores at levels E0 and E1. ... 152 Table 6-1: Parameters for test setups for the experimental program. ... 177 Table 6-2: The percentage of explained variance (%) for the first four Principal Components (PCs) at different experimental conditions. ... 178 Table 6-3: Average scores and standard deviation for each setup. ... 184
xiii
LIST OF FIGURES
Figure 1-1: The two possible situations of SHM: a) passive and b) active monitoring. ... 5 Figure 2-1: Graphical representation of the FT ... 15 Figure 2-2: Left: Plate excitation, Right: Time-history response of the plate ... 16 Figure 2-3: Left: Frequency response function (FRF), Right: Superposition of the time and FRF ... 16 Figure 2-4: Extraction of mode shapes associated with natural frequencies of the plate. . 17 Figure 2-5: Global classification of SHM techniques. ... 19 Figure 2-6: Schematic representation of the test bridge and its vibration modes; a) the locations of sensors and the damage introduced to the middle span, b) extracted mode shapes for the first mode ... 22 Figure 2-7: The steel grid model in the laboratory, a) instrumentation of the model, b) loss of stiffness by removing cover plate from the top and bottom of the girder ... 27 Figure 2-8: FFT representation, indicating its capability to exhibit the frequency contents only ... 29 Figure 2-9: STFT representation, indicating its capability to exhibit time-frequency information of a signal simultaneously ... 30 Figure 2-10: CWT representation, indicating its capability to exhibit multi-resolution characteristics of a signal using a size varying wavelet.. ... 32
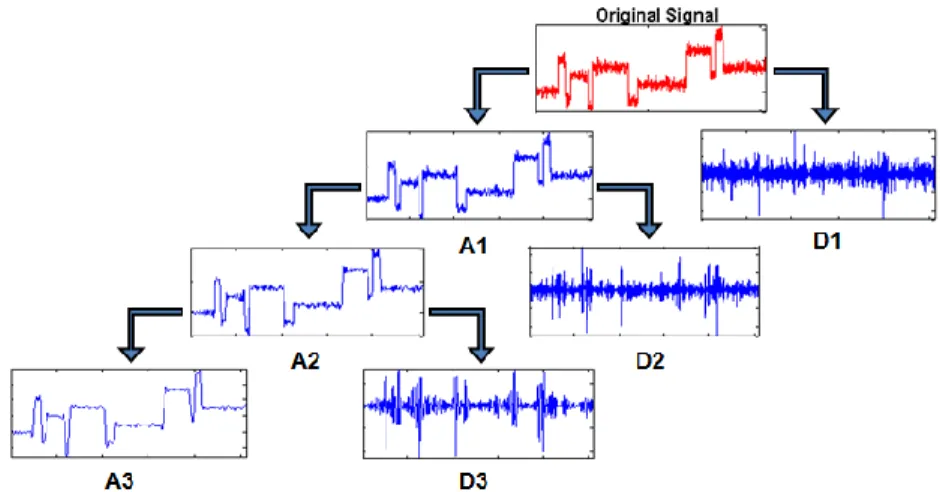
Figure 2-11: Schematic diagram of the third level of decomposition of a signal using DWT. ... 34 Figure 2-12. Schematic representation of WPT three. ... 38 Figure 2-13: Low scale and large scale wavelets correspond to rapidly and slowly changing details of the signal respectively. ... 50 Figure 2-14: Examples of different types of wavelets. ... 51 Figure 2-15: A scalogram representing of wavelet transform (WT). ... 52 Figure 2-16: Calculation of wavelet coefficient for the first section of the original signal.53 Figure 2-17: Shifting the wavelet and repeat step 1 and 2 for the whole signal. ... 54
xiv
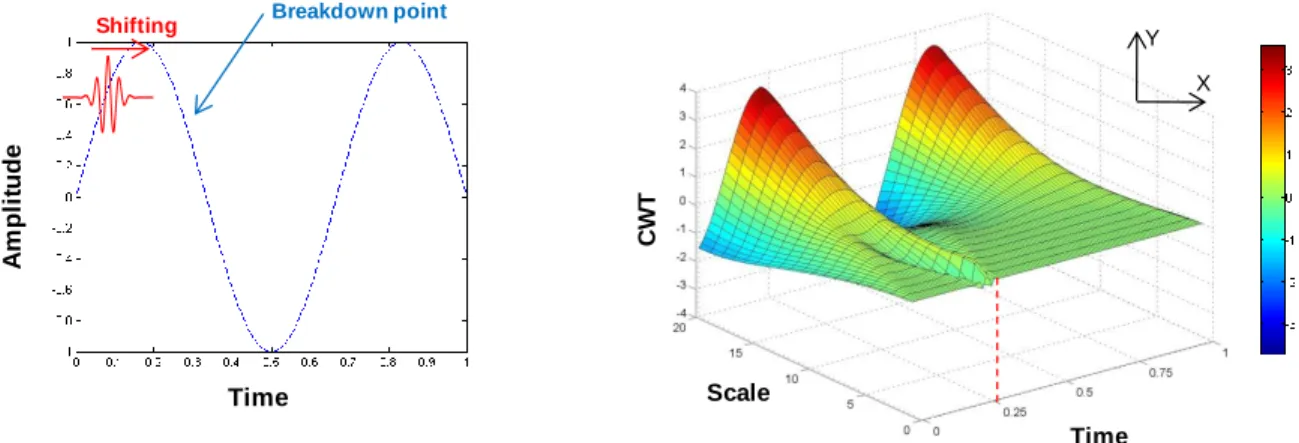
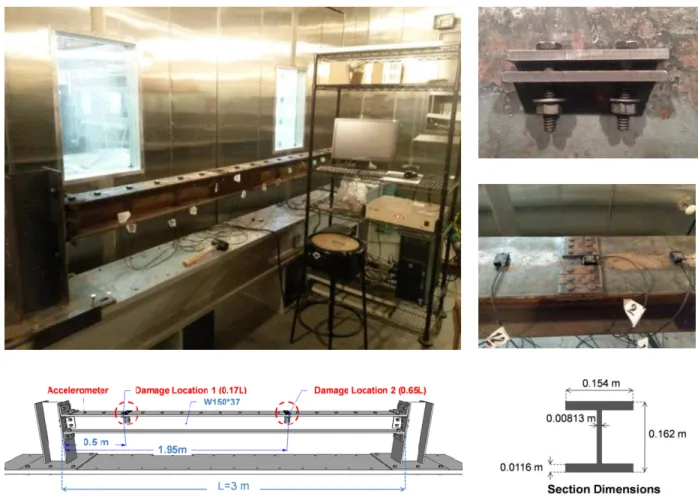
Figure 2-18: Scaling the wavelet and repeat steps 1 to 3. ... 54 Figure 2-19: Applying the CWT on a sine wave with a small discontinuity along its length. ... 55 Figure 3-1: A schematic representation of the beam showing the beam in its fully bolted configuration state. ... 60 Figure 3-2: Damage evolving from the initial state E0 to the state E4. ... 61 Figure 3-3: Use a torque wrench to apply a same tightening torque to the fasteners. ... 62 Figure 3-4: The setup allows to make different boundary conditions at the end of the beam. ... 62 Figure 3-5: Impact hammer used to induce dynamic random excitations on the beam. ... 63 Figure 3-6: The types of the sensors used in the setup, a) 8305B2SP4M, b) 8310A25A1M11SP15M, c) 8315A010B0AC06 ... 64 Figure 3-7: The adhesive mounting method used to fix the accelerometers on the beam surface. ... 65 Figure 3-8: StrainSmart® data acquisition system, model 6100. ... 66 Figure 3-9: The connection of the cables of the accelerometers to the acquisition system using an interface card. ... 66 Figure 3-10: Step-by-step moving process of the beam in the climate-controlled room. . 67 Figure 3-11: Flowchart of the proposed approach for detection and localization of damage. ... 69 Figure 3-12: The singular values of the spectrum matrix as a function of the frequency. The first three local maxima are shown as dash vertical lines which correspond to the first three true natural frequencies of the beam respectively. ... 72 Figure 3-13: The first vibration mode of the beam corresponding to the first natural frequency. ... 72 Figure 4-1: Test setup in its fully bolted configuration state indicating a small discontinuity at the location of joint assembly. ... 89 Figure 4-2: Damage increase from the initial state to the next increased level of damage.89 Figure 4-3: Schematic representation of the setup with relevant dimensions. ... 90 Figure 4-4: Modal superposition of several measurements for a small increase in the size of damage at 0.17L (or near the accelerometer #3). ... 91
xv
Figure 4-5: Different patterns of damage evolving sequentially from state E0 to E4. ... 91
Figure 4-6: Histogram of changes in the distribution of natural frequencies as a function of damage level located at 0.17L. ... 93
Figure 4-7: Histogram of changes in the distribution of natural frequencies as a function of damage level located at 0.65L. ... 94
Figure 4-8: Changes in the MSC coefficients as a function of damage level. ... 96
Figure 4-9: Detail coefficients of the DWT as a function of damage level. ... 99
Figure 4-10: Gaussian wavelet function with zero mean value and finite length. ... 100
Figure 4-11: CWT coefficients for all measurements at all damage levels (E0 to E4). .. 101
Figure 4-12: Scree plot of Principal Components (PCs) for states E0 and E1. ... 105
Figure 4-13: Plot of the first few Principal Components (PCs) for states E0 and E1 ... 106
Figure 4-14: Observed scores corresponding to the first few components for states E0 and E1. ... 106
Figure 4-15: Box and Whisker plots for scores of PCs between states E0 and E1. ... 108
Figure 4-16: Analysis of the distribution of scores for states E0 and E1, normal probability plot. ... 108
Figure 4-17: Analysis of the distribution of scores for states E0 and E1, histogram. ... 109
Figure 4-18: Damage detection based on likelihood of scores for damage evolving from states E0 to E1 at 0.17L. ... 113
Figure 4-19: Damage detection based on likelihood of scores for damage evolving from states E0 to E1 at 0.65L. ... 113
Figure 5-1: Experimental setup with different end support conditions. ... 141
Figure 5-2: Test setup in its fully bolted configuration showing damage locations at 0.17L and 0.65L. ... 142
Figure 5-3: Section dimensions, initial (E0) and first (E1) damage states. ... 143
Figure 5-4: CWT coefficients for a pinned beam at damage levels E0 to E1. ... 146
Figure 5-5: CWT coefficients for a fixed beam at damage levels E0 to E1. ... 146
Figure 5-6: Scree plot for PCA for a pinned beam. ... 147
Figure 5-7: Scree plot for PCA for a fixed beam. ... 147
Figure 5-8: Plot of the first three Principal Components (PCs) for a pinned beam. ... 148
xvi
Figure 5-10: PC scores for a pinned beam. ... 149
Figure 5-11: PC scores for a fixed beam. ... 149
Figure 5-12: Box and Whisker plot for the scores of a pinned beam. ... 150
Figure 5-13: Box and Whisker plot for the scores of a fixed beam... 150
Figure 5-14: Likelihood for damage evolving from states E0 to E1, Pinned beam. ... 153
Figure 5-15: Likelihood for damage evolving from states E0 to E1, fixed beam. ... 154
Figure 6-1: Experimental test setup in a climate-controlled room. ... 176
Figure 6-2: Damage-induced modifications in the beam at the initial state E0 and the damage state E1. ... 176
Figure 6-3: The first principal component corresponding to: a) the effect of temperature increasing from 5oC to 25oC in state E0 and the effect of damage evolving from states E0 to E1 at 5oC, b) the effect of temperature increasing from 5oC to 25oC in state E1 and the effect of damage evolving from states E0 to E1 at 25oC, c) the combined effects of temperature and incremental damage from state E0 at 5oC to state E1 at 25oC and the effect of damage evolving from states E0 to E1 at 5oC, d) the combined effects of temperature and incremental damage from state E0 at 25oC to state E1 at 5oC and the effect of damage evolving from states E0 to E1 at 25oC. ... 179
Figure 6-4: a) Scores for the temperature effect (5oC to 25oC) for damage levels E0 (red) and E1 (blue), b) Scores for incremental damage (E0 to E1) at constant temperature (5oC in red, 25oC in blue), c) Scores as a function of both temperature and incremental damage (E0 at 5oC to E1 at 25oC in red, E1 at 25oC to E1 at 5oC in blue)... 180
Figure 6-5: Box-Whisker plot for comparing the location parameters in the distribution of scores. ... 181
Figure 6-6: Likelihood Ratio (LR) test applied to the scores of the first component for the localization of damage locations. ... 182
Figure 6-7: Wavelet coefficients for the first mode shape and for each of the first four setups. ... 183
Figure 6-8: Corresponding scores for each setup indicating significant differences in the average scores due to changes in temperature and damage level. ... 184
Figure 6-9: Likelihood test result before (a) and after (b) correction for increasing effect of temperature. ... 185
xvii
Figure 6-10: Likelihood test result before (a) and after (b) correction for decreasing effect of temperature. ... 186
xviii
LIST OF ABBREVIATIONS
ANN Artificial Neural Network
ARTBA American Road and Transportation Builders Association
AR Auto-Regressive
CRIC Canadian Infrastructure Report Card CMIF Complex Mode Identification Function
CWT Continuous Wavelet Transform
COMAC Coordinate Modal Assurance Criterion COMSF Coordinate Modal Scaling Factor
DWT Discrete Wavelet Transform
EMD Empirical Mode Decomposition
FEA Finite Element Analysis
FHWA Federal Highway Administration
FD Fractal Dimension
FT Fourier Transform
FFT Fast Fourier Transform
FRF Frequency Reference Function
GDF Girder Distribution Factor
HHT Hilbert-Huang Transform
LR Likelihood Ratio
MAC Structural Health Monitoring
MCS Monte Carlo Simulation
MSF Modal Scaling Factor
MSC Mode Shape Curvature
MUSIC Multiple Signal Classification
NDT Non-Destructive Test
PP Peak-Picking
xix
PC Principal Component
RC Reinforced-Concrete
SHM Structural Health Monitoring STFT Short-Time-Fourier-Transform
SUV Singular Value Decomposition
WT Wavelet Transform
xx
LIST OF SYMBOLS
Mathematical Symbols ω Angular frequency i Imaginary unit e Euler's number( )* Function complex conjugate
[ ]T Matrix transpose { } Vector ∫ Integral ∑ Summation √ Square root | | Absolute value # Number % Percent
≤ Less than or equal to
≥ Greater than or equal to
= Equality
~ Approximately equal
π Pi constant
(.)H Complex conjugate transpose
∞ Infinity Statistical Symbols Sample mean N Sample size µ Population mean σ Standard deviation ν2 Variance
xxi
P P-value
H Hypothesis testing
H0 Null hypothesis
H1 Alternative hypothesis
α Type I error and/or significance level
β Type II error
R Sum of ranks
T t-test statistic
Z z-statistics
Dof Hypothesis testing degree of freedom U Test statistic for the U-test
T Test statistic for the t-test
Data Analysis Symbols
r Mode shape number (subscript)
ωr Natural frequency of the rth mode
h Distance between two nodes
u Undamaged (subscript)
d Damaged (subscript)
{φ} Mode shape displacement vector MAC(u,d) MAC value between two mode shapes MSC(x) Mode shape curvature at location x
f(t) Time-domain function t Time variable F(ω) Fourier Transform of f(t) f(x) Space-domain function x Spatial coordinate Ѱ(x) Wavelet function Ѱ(ω) Fourier Transform of Ѱ(x)
u Wavelet function position parameter
xxii
j Positive integer
k Positive integer
Dj jth level of the Detail coefficient
Aj jth level of the Approximation coefficient CWT(x) Wavelet coefficient at location x
m Number of observations
n Number of variables/nodes
[X] Wavelet coefficients matrix [U] Left-singular values of [X]
[Ʌ] Singular-values of [X]
[V] Right-singular values of [X]
[C] Covariance matrix of [X]
PCi ith principal component
λi ith eigenvalue
ηi Percentage of variance for the ith PC
[S] Score matrix
[S1] Scores for the 1st set of measurements [S2] Scores for the 2nd set of measurements pc Selected component (subscript)
{V}pc Selected eigenvector or PC
{S}pc Score vector for the selected component
{SR} Scores for the reference model {Si} Scores for the alternative model LR(xi) Likelihood Ratio at ith location L(SR | µ, σ) Likelihood of reference scores
L(Si | µi, σi)i Likelihood of alternative scores at ith node
Ru Input covariance matrix
{νi} ith mode shape
Sy(s) Output spectrum matrix in the Laplace domain λ Variance of a white noise sequence
xxiii
ωi ith eigenfrequency
xxiv
DEDICATION
xxv
ACKNOWLEDEGMENTS
First and foremost, I wish to express my sincere thanks to my advisors Prof. Josée Bastien and Prof. Luc Chouinard. Undoubtedly, without your consistent support, valuable guidance, critical feedback, and encouragement this dissertation would not have been possible. I would also like to thank Dr. Antoine Clément for his great ideas and contribution throughout this study.
I would like to thank thesis committee members, Prof. Josée Bastien, Prof. Luc Chouinard, Prof. Charles Darwin Annan, Prof. Laurent Molez, and Prof. James Goulet, for their valuable time in evaluating and improving the quality of this work.
I also would like to extend my appreciation to all the members of the CRIB Research Center at Université Laval, who have been incredibly supportive colleagues. I am very thankful to Mr. René Malo and Mr. Mathieu Thomassin Mailhot, CRIB structural laboratory technicians, for their technical assistance and availability to supply testing facilities.
I gratefully acknowledge the funding received through a CREATE grant from the Natural Sciences and Engineering Research Council of Canada (NSERC) and the CRIB Research Center.
I would like to acknowledge Dr. Shirin Panahi for English proof reading of the thesis. I wish to extend my gratitude to my friends and family who played an integral role in the successful achievement of this thesis. My special thanks to my parents for their unflagging love and never ending support throughout my life.
At the end, but certainly not least, no words can describe how grateful I am to my lovely wife, Sara Kazemiha, for her unconditional love and support over the entire period of my Ph.D. studies.
xxvi
FOREWORD
This dissertation is written in an manuscript-based format composed of seven chapters. In this thesis, the aim is to demonstrate how the efficiency of damage detection techniques may
be improved for small levels of damage on bridge-type structures. Chapter 1 is a general
introduction to Structural Health Monitoring (SHM) techniques and includes the problem, challenges of the research, overall objective and hypothesis of this work. The importance of global monitoring techniques for vibration-based assessment of structures is highlighted and reviewed according to the literature reviewed in Chapter 2. The methodology of this work is discussed in Chapter 3. Chapters 4-6 report the main findings of this research which are the subject of three publications. The author of this dissertation is the main author of all papers. The first draft of the papers including experimental work and data analysis was performed by the main author which are revised by all co-authors.
The publications are as follows:
Chapter 4
• V Shahsavari, J Bastien, L Chouinard, A Clément, (2017), "Likelihood-based testing of wavelet coefficients for damage detection in beam structures", Journal of Civil Structural Health Monitoring, 7(1), 79-98.
In this chapter, for the first time, the combined application of the Continuous Wavelet Transform (CWT), the Principal Component Analysis (PCA), and a series of statistical tests based on an adaptation of the Likelihood Ratio (LR) test are discussed and compared with current SHM techniques for damage detection in an instrumented beam. The experiments were performed under steady-state or controlled conditions of the laboratory where the main objective was to detect incremental damage at low levels of damage despite high noise to signal ratios. Furthermore, in addition to the above publication, some results of this work were published previously in an international conference proceeding, reporting the de-noising application of the PCA in the context of SHM.
xxvii
• V Shahsavari, J Bastien, L Chouinard, A Clément, (2015), "A Novel Response-Based Approach to Localize Low Intensity Damage of Beam-Like Structures", The 5th International Conference on Smart Materials and Nanotechnology in Engineering, Vancouver, BC, Canada.
Chapter 5
• V Shahsavari, L Chouinard, J Bastien (2017), "Wavelet-Based Analysis of Mode Shapes for Statistical Detection and Localization of Damage in Beams Using Likelihood Ratio Test", Journal of Engineering Structures, 132, 494-507.
Given the promising results achieved from chapter 4, further investigations were performed in chapter 5 to examine the efficiency of the proposed likelihood-based approach for damage localization at different limit conditions, implying various levels of noise. Chapter 5 is a continuation of the work presented in chapter 4 to further validate the robustness of the approach for damage detection under steady-state condition of the laboratory.
Chapter 6
• V Shahsavari, L Chouinard, J Bastien (2016), "Detection of Structural Damage under Varying Environmental Conditions", Structural Health Monitoring, under review.
This chapter addresses challenges given by the reversible effects of temperature change on damage detection with a primary goal to expand the contribution of the proposed technique in real field tests. The experiments were performed in a climate-controlled room under two different temperature degrees. While the same methodology as in previous chapters was used in this chapter, a novel mathematical algorithm was established to obtain a temperature correction factor and minimize the reversible effect of the temperature on the likelihood result.
Finally, in Chapter 7, the overall conclusions, novelty of this work and future directions are discussed. Recently, an additional article has been submitted to the Journal of Structural Control and Health Monitoring as a natural continuation of this work. However, this article is not included in this thesis:
xxviii
• L Chouianrd, O Baptista, V Shahsavari, J Bastien, (2017), "Objective Performance Measures of SHM for the Early Detection of Damage in Beams", Journal of Structural Control and Health Monitoring, under review.
1
CHAPTER 1
1. Structural Health Monitoring (SHM)
1-1
Introduction
According to recent surveys of the assets of civil infrastructure in the United States, the average age of the nation’s 607,380 bridges is currently 42 years. In total, one in nine of the US bridges are rated as structurally deficient and require pressing replacement or rehabilitation of at least one major component. It has been estimated that $20.5 billion is needed annually to eliminate the nation’s bridge deficient backlog by 2028, while there are nearly over two hundred million daily crossings across deficient bridges in the nation’s 102 largest municipal regions (Herrmann, A. W. 2013). According to the American Road and Transportation Builders Association (ARTBA) most recent analysis on the raw 2015 bridge inspection data which was released by the Federal Highway Administration (FHWA) department, more than 9% of the nation's bridges are in poor condition rating, meaning that 58,495 bridges are currently classified as structurally deficient (ARTBA, 2016). The 2016 Canadian Infrastructure Report Card (CIRC) also indicates that approximately 30% of bridges in Canada are at risk of rapid deterioration, representing a call for immediate action before a catastrophic failure event occurs (CIRC, 2016).
Bad design, faulty construction, and extraordinary loads may introduce substantial change of stress/strain distributions in structural elements and cause damage or unexpected failures of structures. In December 1967, the Silver bridge suddenly collapsed into the Ohio River due to a defective eyebar that experienced a cleavage fracture in the lower part of its head. This disaster killed 46 people while only 9 survived (Bosela, Brady et al. 2013). Bridges are generally rated and largely monitored by the predominance of visual inspection and nondestructive evaluation techniques (Moore, Phares et al. 2001). In general, nondestructive techniques can be used for
2
variety of purposes such as investigating mechanical properties of subsurface layers in structures and/or detecting defects and discontinuities on small portions of structures (Shahsavari 2011).
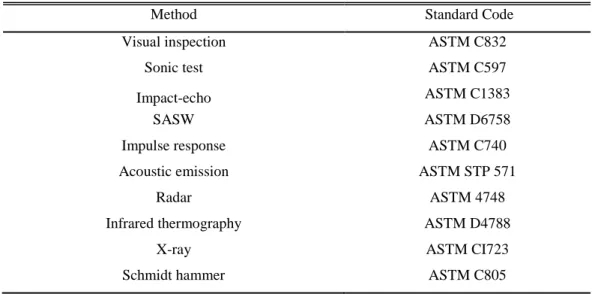
Table 1-1 lists some of the main nondestructive techniques frequently used in engineering fields. The critical changes experienced in structural parameters are commonly investigated by non-destructive inspection techniques, such as acoustic emission methods, X-ray methods, and thermal field methods. These methods are based on a local evaluation in easily accessible surfaces of the structure and are, therefore, referred to as "local monitoring methods". Furthermore, they are passive and costly methods, since a large amount of human intervention is required to obtain prior knowledge of the damage distribution in order to perform inspection (Robertson, Farrar et al. 2003, Sahin and Shenoi 2003, Han, Ren et al. 2005, Perera and Huerta 2008).
Table 1-1: Most frequently used nondestructive methods.
Method Standard Code
Visual inspection ASTM C832
Sonic test ASTM C597
Impact-echo ASTM C1383
SASW ASTM D6758
Impulse response ASTM C740
Acoustic emission ASTM STP 571
Radar ASTM 4748
Infrared thermography ASTM D4788
X-ray ASTM CI723
Schmidt hammer ASTM C805
The limitations of local monitoring techniques raise the need to introduce global monitoring methods. The need of nondestructive and global techniques leads to the development of damage diagnostic techniques by measuring global parameters of structures at a few easily accessible points on the structure. An ideal Structural Health Monitoring (SHM) technique is expected to remotely monitor the structure with almost no human interventions (Salawu and Williams 1995, Alvandi and Cremona 2006, Curadelli, Riera et al. 2008). Research on the potential of damage
3
detection and localization on the basis of vibration-based analysis techniques date back to the late 1970s from studies in various fields. In the past decade, vibration-based analysis techniques have evolved to the remote monitoring of structures based on observable changes in the dynamic characteristics of structures (e.g. natural frequencies and mode shapes) as a result of localized structural damage (Taha, Noureldin et al. 2006).
In the last thirty years, the number of studies that attempted to evolve SHM to more sensitive and quantifiable methods for damage detection has increased considerably. In contrast with the application of SHM to mechanical systems (e.g. rotating machinery industry), which has been accomplished with the transition from a research topic to successful implementation by practicing engineers, the application of SHM for civil infrastructure on larger scales, such as bridges, has not been particularly effective. This can be explained due to a combination of different factors, including the relatively large size of civil infrastructure, the greater amount of uncertainties inherently existing in material properties, support conditions, system connectively, and variability in operational and environmental conditions. The vibration-based damage assessment of bridge structures was initiated by the civil engineering community since the early 1980s. It was motivated by a number of unexpected bridge failures which resulted in a great deal of attention to the need for early detection of damage or structural change, as well as the desire to minimize life cycle costs of such structures (Harik, Shaaban et al. 1990, Wardhana and Hadipriono 2003).
To build on this research, a large proportion of this study is allocated to the damage monitoring of bridge or beam-like structures as a means to argue and/or overcome the shortcomings of current local Non-Destructive Tests (NDT).
1-2 Objectives of SHM
In this project the industrial interests of SHM as well as scientific originality and contribution required for a Ph.D. project were considered. These two aspects included both challenges and opportunities. For most SHM systems in the field of civil engineering, the industrial objectives maybe expressed as follows (Balageas, Fritzen et al. 2006):
4
To reduce the repair costs of civil infrastructures (economical aspect).
To improve safety and ensure the reliability of civil infrastructures before it reaches a critical state.
To specify the weak zones of construction and prevent the destruction of structures. To prolong the life time of structures by the early detection of damage.
To increase safety factor of global monitoring techniques of structures.
In order to fulfill our desire for the purpose of precise diagnosis of damage in structures, continuous remote monitoring of structures could be a promising approach in the field of civil infrastructures. Damage detection based on dynamic monitoring of structures can be designed to reach four different levels (Rytter 1993):
1) Detection of the existence of damage 2) Location of the damage plus level 1 3) Extent of the damage severity plus level 2
4) Estimation of the remaining service life of the structure which is usually uncoupled from other three levels.
In this case, the term damage is defined as reduction in stiffness for steel girder bridges. To this end, incremental damage scenarios are introduced into the system connectivity of an experimental beam, which is an assembly of three bolted sections. Since any modification on the connection system relative to its initial or fully bolted configuration state weakens the rigidity of the beam at the location of joint assembly, different patterns of incremental damage can be introduced by removing sequentially a set of stiffeners at each joint. More detailed explanations are found in the Sections 3-2-1 and 3-2-2 of this dissertation.
1-3 SHM Solution Steps
Like nondestructive techniques, SHM can use two approaches: a) passive and b) active. The two possible attitudes in which both experimenter and examined structures are involved is indicated
5
in Figure 1-1. Passive monitoring refers to an operation in which the structure is being monitored based on evaluations received from embedded sensors. Conversely, if the experimenter has equipped the structure in such a way that both sensors and actuators are used to monitor the response of the structure, the monitoring becomes active (Balageas, Fritzen et al. 2006).
The active monitoring of a highway bridge with a high volume of traffic would be nearly impractical. Indeed, it would require the entire closure of the bridge in order to perform the required vibration test and a high energy shaker. Instead, to ensure a continuous monitoring of the bridge, the passive approach is preferred. The latter will greatly facilitate the remote access for data processing and continuous evaluation of the structure (Olund and DeWolf 2007). For real field tests, the use of free excitation sources (e.g. ambient vibrations due to traffic loads, wind, human activities, etc) is encouraged to retrieve data.
Figure 1-1: The two possible situations of SHM: a) passive and b) active monitoring (Balageas, Fritzen et al. 2006).
6
Recently, damage detection has been treated more as a classification problem of different patterns formed by the damaged and undamaged response of structures. Thus, it can be included into the statistical pattern recognition paradigm. This paradigm can be explained as the following four-part process for the development of SHM solutions (Farrar, Doebling et al. 2001, Sohn, Farrar et al. 2001, Sohn, Farrar et al. 2004):
1) Operational evaluation 2) Data acquisition 3) Feature extraction
4) Statistical model development for feature classification.
Operational evaluation is the first step of the SHM solution process which answers four questions concerning the implementation of a SHM system: 1) What are the economic justifications and/or life safety for the monitoring process of a system? 2) How is damage defined for the system that is going to be monitored? 3) What are the operational and environmental conditions for performing the monitoring? and 4) What are the data acquisition limitations in the operational environment?
The data acquisition portion consists of selecting different quantities to be measured such as excitation methods, data acquisition/storage/transmittal hardware, the type of sensors, locations, numbers, and bandwidth. Once the data is collected, they must be analyzed to reveal the information related to the existing damage. This is done by extracting damage-sensitive features from the measure vibration response (Farrar, Doebling et al. 2001, Sohn, Farrar et al. 2004). A damage-sensitive feature is a certain quantity derived from the measured vibration response that is correlated with the presence of damage in a structure and allows one to distinguish between the undamaged and damaged states. This process is based on fitting a variety of methods to identify features for damage detection. Several features (e.g. the resonance frequencies of a structure and mode shapes) are often selected for a structure that can be assembled into a feature vector for further analysis.
7
The last portion of statistical pattern recognition, statistical modeling for feature classification, is concerned with the implementation of the algorithms that operate on the extracted features for their classification and de-noising. However, the least attention in the literature has been given to the development of statistical models, which are essential to enhance the efficiency of damage detection techniques and decision making rules. The statistical models are used to answer, in an unambiguous and quantifiable manner, different questions about the damage state such as the existence, location, type, and extent of damage. The testing of these models on actual data is the important stage of the statistical model development process used to establish the sensitivity analysis of the selected features to damage and to study the possibility of false indications. More information on this paradigm may be found in cited reviews (Farrar, Doebling et al. 2001, Sohn, Farrar et al. 2004, Figueiredo, Park et al. 2009).
1-4 Problem Statement
In large scale civil structures subjected to environmental variations and noisy conditions, the determination of damage without filtering the undesired effects of these factors on global characteristics of structures is not reliable. This occurs particularly when damage-induced modifications in modal parameters at low levels of damage are at the same order of magnitude due to environmental conditions (Farrar and Worden 2012).
Environmental and operational variations can often conceal slight structural changes caused by damage that are not easily discernible by standard testing methods and may cause false indications of damage (Sohn, Farrar et al. 2004). The latter implies the need to develop statistical pattern recognition paradigms with an effort to minimize the effects of environmental variability on the measurements obtained from real-time monitoring of structures. The values obtained from statistical predictions on thermal gradients in a steel box-girder over multiple years in France, were found to be outside the guidelines proposed by the Eurocode at the time (Lucas 2003, Olund and DeWolf 2007).
8
In contrast to large civil engineering infrastructures that environmental variations have higher negative effects on measurements, the mechanical systems are, in most cases, mounted in a relatively confined environment and perform under relatively constant conditions. This and the uniqueness of each civil structure, are the main reasons that explain the difference of maturity in vibration-based SHM technology between mechanical and civil engineering (Farrar and Worden 2012). Until now, there is little literature describing the application of this technology to bridge damage detection studies. The availability of mechanical parts in large inventories with data available from both damaged and undamaged systems is another fact that discriminates the application of SHM in mechanical engineering from civil engineering. However, civil structures, in general, such as highway bridges are irreplaceable items with little or no data available from the damaged structure. In mechanical engineering the number of damage scenarios is often limited and the possible positions of damage are restricted to fairly small partial regions. However, one of the primary challenges of many damage detection studies in civil engineering research is to define either the damage type or the areas where damage can occur. In general, the response of mechanical systems are exhibited to harmonic-like inputs that are stationary, while measured inputs produced by external loads in civil structures (e.g. traffic trends) are often non-stationary and assumed to be random in nature. On the other hand, data acquisition equipment for mechanical pieces may consist of a single sensor and single channel analyzer. In contrast, in large scale civil monitoring systems, since the approximate location of damage is not generally known, several channels distributed over a relatively large spatial zone are required to complete the setup (Farrar and Worden 2012).
For damage detection at low levels, one of the most important challenges is to increase the sensitivity of SHM methods to detect slight changes of structural characteristics due to damage in an early stage without obtaining false alarms and distinguish between the effects of the damage from the environmental variations (Balageas, Fritzen et al. 2006). Most SHM approaches rely mainly on the features extracted from modal-based techniques alone, which are found poor indicators of localized damage in the presence of noise or environmental variations (Wahalathantri, Thambiratnam et al. 2010, Beskhyroun, Wegner et al. 2012).
9
The portion of the SHM that has received the least attention is the development of statistical modeling for feature classification which represents one of the crucial points of this research (Farrar, Doebling et al. 2001, Sohn, Farrar et al. 2004). Conceptually, the current vibration-based damage detection methods more or less use the pattern recognition/classification techniques which can discriminate features that are extracted, classified, and monitored. In almost none of several studies reported by Doebling et al. (1996) and Burton et al. (1998), the statistical methods have not been used to assess if changes in selected features are statistically significant for damage decision making (Sohn, Farrar et al. 2004). Lately, few researchers have tried to discriminate between irreversible changes in natural frequencies due to structural damage to those from reversible thermal effects. Comparatively very little attention has been devoted to investigate the variations in air temperature on the vibration modes of structures. For a bridge with small levels of incremental damage and prone to varying environmental conditions, damage detection through changes in natural frequencies and mode shapes can get masked due to adverse impacts of environmental conditions on modal parameters (Doebling, Farrar et al. 1996, Xu and Wu 2007). Current studies are mostly based on either pure statistical approaches or machine learning algorithms to detect the existence of damage under temperature variations only and fail to provide local information about the location and/or extend of damage (Sohn, Dzwonczyk et al. 1999, Cury, Cremona et al. 2012). For both cases, to derive a robust damage detection decision rule training data sets are required from undamaged states of a given structure in different environmental conditions, which are rarely available for real structures (Sohn, Farrar et al. 2004).
In several studies, the damage detection techniques have been encountered with serious problems to localize damage in case of simultaneous and multiple damage scenarios. Considering the economic aspects and human interventions, in in-situ cases, localization of damage has required for too many sensors to measure the structural response (Alvandi and Cremona 2006, Alvandi, Bastien et al. 2009).
Although the idea of using modal parameters was attractive for engineers in many years, these indices cannot be used as directly reliable and effective damage indicators (Sun and Chang 2004). In many existing vibration-based approaches temporal signals measured from the structure are analyzed via traditional Fourier Transform (FT), whereas it is not able to preserve
10
both the time and frequency information of the signals (Sun and Chang 2002, Law, Li et al. 2005). Wavelet transform (WT) is another approach that has recently been developed as an extension of FT with adjustable window locations and sizes (Sun and Chang 2002, Law, Li et al. 2006). Over the past 10 years, because of the time-frequency multi-resolution property and the ability of WT to perform local analysis of a signal, this method has become one of the most fast-evolving mathematical and signal processing tools to reveal some hidden aspects of the data that other signal processing tools fail to detect (Sun and Chang 2002, Law, Li et al. 2005, Law, Li et al. 2006). This study deals with wavelet analysis in order to expand successful applications of this technology for SHM of real structures.
Despite powerful assets of the wavelet analysis in the processing of signals, it cannot provide clear or consistent patterns in noisy conditions and complicated damage scenarios at small levels of damage. To overcome the limitations of WT, a robust statistical pattern recognition technique has to be developed in order to recognize and extract the features that are highly correlated with damage and are less sensitive to environmental noise.
1-5 General Objectives of the Research
The objective of the ongoing research is to improve the feasibility of vibration-based damage detection techniques to identify the existence and location of damage in bridge structures. Statistical models are developed to further evolve the processing of signals obtained from dynamic measurements in the presence of noise and environmental/operational variations. In particular, since temperature is the most important factor influencing the dynamic characteristics of structures, this study aims to overcome the difficulties associated with previous studies for damage detection under temperature variations.
Aside from the points discussed above, another goal of this research is to discuss the sensitivity of damage localization in noisy conditions which may reduce the ability to detect damage where there are low levels of damage (Farrar, Baker et al. 1994, Taha, Noureldin et al. 2004). In addition, due to insufficient attention on the statistical modeling for damage detection studies reviewed herein (Sohn, Farrar et al. 2004, Farrar and Worden 2012), this research will further
11
discuss the important contribution of the statistical techniques to accurate identification of structural damage.
To comply with the aforementioned objectives of this project, the implementation of special algorithms that can operate on the extracted feature has become essential on the successful application of the wavelet analysis for health monitoring of bridge-type structures. In order to achieve these goals, an experimental program was planned in the laboratory that will be described in detail in the chapters that follow.
1-6 Originality
The amount of research that has been considered thus far is neither sufficient nor promising to study the effect of environmental variations in beam-like structures (Cross, Koo et al. 2013, Grosso and Lanata 2014). This project has raised various challenges in order to improve the dynamic response analysis of such structures subjected to thermal variations. However, the most fundamental challenge of this project was that the dynamic response of the structures due to environmental and operational variations (e.g. ambient temperature, moisture, wind, and loading conditions) may not be overlooked (Sohn, Farrar et al. 2004). Considering the importance and difficulties related to this subject, a mathematical algorithm was established to correct for the reversible effect of temperature on measured data obtained from different surveys subject to different temperatures.
To address issues related to the limitations of the WT for damage detection in high noise to signal ratio environments, a de-noising algorithm based on a statistical method called the Principal Component Analysis (PCA) method was developed to introduce new features that explained most of the information contained in the observations and were sensitive to changes in the structural dynamic response due to damage. In addition, since experimental errors and environmental noise are important obstacles to gain pure information of the structure to be monitored, a large number of repeated measurements were performed for each state of structure in order to minimize statistical uncertainty and variability in experimental measurements.
12
Another novelty of this project was to set a statistical level of significance to attain a reliable damage decision making. This significance level obtained from statistical procedures may have enhanced the accuracy of results where different false alarms existed for damage detection as a result of varying factors such as experimental noise. For this purpose, a set of statistical procedures were proposed to perform damage detection for a given significance level. Given statistical detection of damage, a novel statistical approach based on an adaptation of the Likelihood Ratio (LR) test is proposed to localize clearly small levels of damage.
1-7 Thesis Outline
This thesis contains seven chapters based on three manuscripts. The current chapter introduces the project definition, motivations, objectives, and the problem to be face.
Chapter 2 includes a review of the literature as a basis for understanding the subsequent research. A state-of-the-art is presented in this chapter, which reviews the evolution of vibration-based damage detection techniques in global monitoring of bridge-type structures. The details of the problem, principle of current and traditional techniques as well as their advantages and limitations are provided.
Chapter 3 defines the methodology and rationale for technical specifications in the experimental program required for a complete formation of the test configuration setup.
Chapter 4 covers the results of the first article published in the Journal of Civil Structural Health Monitoring. A comparative study is conducted to highlight the limitations of conventional techniques and evaluate the sensitivity of the proposed approach for damage detection in low signal to noise ratio. In this chapter, a set of different statistical tests are explored to detect damage statistically and minimize false indications of damage due to experimental noise with the raw data presented. Moreover, a novel statistical pattern recognition technique is developed to locate different levels of incremental damage gradually evolving from the lowest to highest level of damage. The methodology is tested in an experimental beam restrained at two ends. The results and discussion are presented in the same chapter.
13
Chapter 5 contains the results of the second article published in the Journal of Engineering Structures. In chapter 5, the proposed methodology was tested and validated with a new set of sensors network implemented on a beam with different boundary conditions (e.g. pinned-pinned and fixed-fixed). The experiments were performed in controlled laboratory conditions to detect small levels of induced-damage simulated for early stage damage scenarios in real cases. In this chapter, a good understanding of the concept behind the proposed methodology was achieved which indicate that the results are in agreement with the results obtained in the previous chapter.
Chapter 6 describes the results of the third article submitted to the Journal of Structural Health Monitoring. In this chapter, given the validity of the proposed approach for damage detection in the laboratory-controlled conditions from chapters 4 and 5, a novel mathematical algorithm was developed to investigate the effect of temperature changes in damage detection. The purpose of this chapter was to minimize the probability of false alarms due to undesired effects of temperature in damage detection and provide a reliable protocol to discriminate between the effect of damage and temperature change in measured data. The experiments were performed in a climate-controlled room and the discussion of the results are presented in the same chapter.
Lastly, chapter 7 provides final conclusions and original findings of this study with suggestions for future work.
14
CHAPTER 2
2. Literature Review
2-1 Introduction
This chapter provides an overview of the different studies based on the vibration-based assessment of bridge-type structures. The state-of-the-art aims to highlight the originality of the present study and tries to outline how the proposed approach departs from previous studies in this field. As illustrated in the previous chapter, global monitoring methods have developed broadly in different studies because of their advantages over conventional local monitoring methods. Over the past years, numerous attempts have been made by many researchers to assess the efficiency of different techniques through a wide variety of parameters. Modal parameters such as natural frequencies and mode shapes are the most popular global parameters that are closely related to each other for damage detection.
2-2 Introduction to Natural Frequencies and Mode Shapes
The theoretical explanation begins with the introduction of the Fourier Transform (FT) before presenting the identification of modal parameters. The Fourier analysis is defined as a method of decomposition of a function into a set of basic sinusoid functions of various frequencies and phases (Kim and Melhem 2004, Bajaba and Alnefaie 2005). The process of FT can be explained as the sum over all the times of the signal multiplied by a complex exponential. The FT results in many Fourier coefficients which yield the sinusoidal components of the original signal through selection of a sinusoid function with appropriate frequency, 𝜔, multiplied by Fourier coefficients (Misiti, Misiti et al. 1996). To go beyond the colloquial conversation, the mathematical expression of the FT for a periodic function 𝑓 𝑡 using a complex exponential over an infinite range (−∞ , +∞ ) can be expressed as:
15 𝐹 𝜔 = 𝑓 𝑡 𝑒−𝑖𝜔𝑡 𝑑𝑡
+∞
−∞
(2.1)
where 𝐹 𝜔 is the Fourier transform of the function 𝑓 𝑡 , 𝑖 = −1 is the complex number, 𝜔 is the angular frequency, and 𝑡 is the time variable. The equation below shows the inverse Fourier transform that produces a function of time:
𝑓 𝑡 = 1 2𝜋 𝐹 𝜔 𝑒 𝑖𝜔𝑡 𝑑𝜔 +∞ −∞ (2.2)
More details about the FT can be found in (Kreyszig 2007). The function 𝐹 𝜔 allows us to visualize the frequency contents of the function 𝑓 𝑡 . Therefore, Fourier analysis of the periodic function 𝑓 𝑡 able to one to go through either the time or frequency domains of the function (Figure 2-1).
Figure 2-1: Graphical representation of the FT (adapted from http://pgfplots.net).
The FT has made possible the development of modal analysis as the study of the natural characteristics of structures. To become better acquainted with the basic premise behind this theory, a constant sinusoidal force is applied with varying frequency of oscillation on a freely supported flat plate. This excitation is applied in a manner where the peak force will always be the same value. Using an accelerometer attached to one corner of the plate, if the time-history response of the plate is drawn due to the excitation, it will be noticed that the amplitude changed while corresponding to the different rates of oscillation of the input force (Figure 2-2). As time passed, it will be observed that the response function amplifies at different points where the rate
ω
1ω
2ω
3ω
416
of oscillation of the input excitation gets closer to the natural frequency of the system. By transforming the measured time data from time-domain to the frequency-domain, we can compute the so-called Frequency Response Function (FRF). As shown in Figure 2-3, by overlaying the time trace with the FRF, it will be noted that the peak values of the FRF, which occurr at the resonance frequencies of the system, correspond to the input frequency at which the time response is observed to reaches its maximum value (Avitabile 2001).
Figure 2-2: Left: Plate excitation, Right: Time-history response of the plate (adabted from Avitabile 2001).
Figure 2-3: Left: Frequency response function (FRF), Right: Superposition of the time and FRF (adabted from Avitabile 2001).
In the latter case, when the frequency of external excitation coincides with natural frequencies of the system the deformation pattern of the structure will be different for each frequency mode. The term "mode shape" is introduced as one of the deformation patterns of a structure that occur at a particular resonance frequency. As an example, for a plate covered with 45 evenly distributed accelerometers it will be seen that a deformation pattern (mode shape) exists at each
Time
Sensor
Applied Force
Frequency Response Function
Signal FRF Time-history response of the plate