Science Arts & Métiers (SAM)
is an open access repository that collects the work of Arts et Métiers Institute of
Technology researchers and makes it freely available over the web where possible.
This is an author-deposited version published in: https://sam.ensam.eu Handle ID: .http://hdl.handle.net/10985/9467
To cite this version :
Van-Hanh NGUYEN, Frédéric MERIENNE, Jean-Luc MARTINEZ, Thierry POZZO - An approach for measuring the human gesture learning ability in third-person view environment for motor rehabilitation - In: An approach for measuring the human gesture learning ability in third-person view environment for motor rehabilitation, Etats-Unis, 2010-05-12 - ASME World Conference on Innovative Virtual Reality (WinVR) - 2010
Any correspondence concerning this service should be sent to the repository Administrator : archiveouverte@ensam.eu
AN APPROACH FOR MEASURING THE HUMAN GESTURE LEARNING ABILITY IN
THIRD-PERSON VIEW VIRTUAL ENVIRONMENT FOR MOTOR REHABILITATION
Van Hanh Nguyen1, Frederic Merienne, Jean-Luc Martinez
Arts & Métiers ParisTech – CNRS – Le2i
1Contact Author
Thierry Pozzo
U887 INSERM Motricité, Plasticité University de Bourgogne
KEYWORDS
Human gesture learning, Virtual rehabilitation, Third-person view system, LCSS, Curve simplification
ABSTRACT
In this paper, we describe a novel and quantitative approach to assess the capability of performing training task in the third-person view virtual environment for motor rehabilitation. Our proposed approach is based on human gestures which are constructed from gesture-units according to levels of complexity. Experimented in a Cave Automatic Virtual Environment, human gestures are represented by a virtual human thus the training task of the subject is to memorize those gestures and then to reproduce them. Performance of executing this training task is measured by the similarity between the virtual human’s gesture and that of the subject which is captured by an optical motion capture device. In practice, a combination of performance and the complexity of the gesture is carried out to evaluate the ability of learning the human gestures of the subject.
I. INTRODUCTION & MOTIVATION
Recently, various promising applications for human activities have been developed based on the third-person view virtual environment. Several well-known applications include computer games, simulation based training and learning and virtual psychotherapies [1]. In fact, by using the third-person view, in which the subject watches himself as a virtual human in the virtual environment, thus the subject can observe his own actions and interactions with the other characters and objects visually. Hence, not only the third-person view increases natural interaction within virtual environment but it also improves the
sense of being together thereby enhancing the overall sense of shared presence in the environment [1]. In the application of motor rehabilitation, there has been an increasing number of papers dedicated to the approach of using a third-person view virtual environment. Effectively, the purpose of using a third-person view in motor rehabilitation application is to enhance the interaction between the patient and the virtual environment in which not only the patient can see the actions of another character (virtual professor) but also through a virtual human (virtual patient) the patient can watch the interaction between the virtual professor and the virtual patient [2]. In a general third-person view virtual environment for motor rehabilitation, the therapeutic learning process involves asking the patient to employ a sequence of physical actions with various scenarios presented by the virtual environment [3]. In this approach, an important issue is the measure of the ability of performing the therapeutic learning task of patient. In our work, the physical task of the patient is to demand the patient learning the human gestures which are guided by a virtual human in the virtual environment. Practically, the reference gesture of the virtual human is the gesture of healthy person which is captured by a motion capture device. In reality, the ideal gestures of a patient in physical rehabilitation tend to approach those gestures of a healthy person. Moreover, gesture in a virtual environment is equivalent to a muscular execution in the physical environment [4][5]. Therefore, knowledge about the ability of the patient of learning a physical task compared to a healthy person (represented by a virtual human), could deduce the therapy progress for the patient. Actually, that ability of the patient is assessed by subjective observation of the therapist in general. Therefore, there is a strong need to develop a quantitative
method to evaluate the ability of learning the human gesture of the patient.
Indeed, in this paper we employed a novel and quantitative approach to assess the ability of learning the human gesture of patient. Our work is studied under the assumption that the patient has undergone a process of motor rehabilitation by learning the human-gestures and now is about to evaluate the efficiency of this process. In practice, the human gestures in our work are classified according to their levels of complexity. Indeed, we constructed a human gesture from a set of six units of human gesture. The number of units in each gesture is used to define the level of complexity of this gesture. Our experiment is performed in a Cave Automatic Virtual Environment in which, the human gestures are represented by a virtual human. As a result, the learning task of the subject is to memorize those gestures and then to reproduce them. Thus the performance of execution of this learning task or the learning ability of patient is measured by the similarity between the virtual human gesture and that of the subject which is captured by an optical motion capture device. In practice, a combination of this performance and the complexity of the gesture is taken into account to evaluate the learning ability of the subject.
The remainder of our paper is organized as follows. In the next section, we describe the overall configuration of our proposed gesture-based third-person view virtual environment for motor rehabilitation. In Section 3, we elaborate on our method to evaluate the human gesture leaning ability of patient which consists of choosing human skeleton representation, techniques to reduce gesture dimension and chosen distance function called Longest Common Sub-Sequence (LCSS) to measure the similarity between two gestures. Section 4 focuses on our experiments and results. The first experiment is carried out to analyze the performance of our proposed similarity measure which is based on the dimensionality reduction technique and the LCSS distance function. The second one is carried to analyze the result of the proposed approach to assess the learning the human gestures ability of the real subjects. We finish with the conclusion and further implications for future study In Section 5.
II. GESTURE-BASED THIRD-PERSON VIEW VIRTUAL ENVIRONMENT
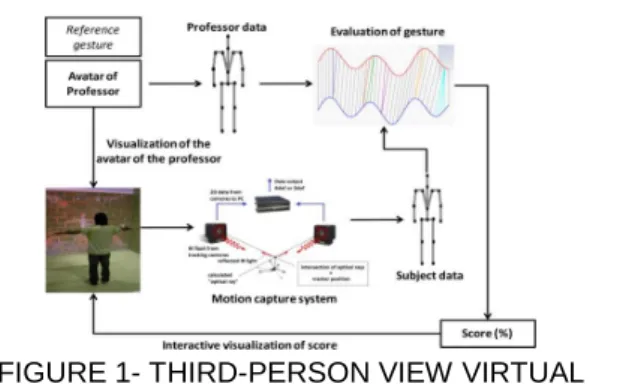
FIGURE 1- THIRD-PERSON VIEW VIRTUAL ENVIRONMENT FOR MOTOR REHABILITATION
The overall system of our approach is illustrated in Figure 1. Our system uses an infra-red motion capture system (A.R.Tracking) and a Cave Automatic Virtual Environment (CAVE). Motion of patients is captured by using a set of markers and rendered by a virtual human on the screen. This animation is controlled based on the joint angle estimated from the position of markers attached to the user.
The technique in this work is based on the work of Cameron et al. [6] who proposed a closed form sequential solution enabling real-time estimation of the joint angle. This technique takes full advantages of the approximation that all markers on body segments are attached to a rigid body [7]. The simple scenario of our work is as follows. Firstly, the user is watching and learning a reference gesture realized by a virtual human. When the virtual human finishes his gesture, the user has to rememorize and immediately reproduce the gesture. This gesture of the user is animated simultaneously by a virtual human in mirror mode, so that the user can watch his own gesture through the virtual human. The learning ability is scored by measuring the geometric similarity between the reference gesture and the executed gesture of the user and the time correlation between temporal length of reference gesture and the duration the user reproduces the gesture. In fact, such rehabilitation generally involves the gesture of a single limb rather than the gesture of the entire body. Therefore, within the context of motor rehabilitation for upper limbs, our work is experimented with only the gesture of the upper limbs.
III. GESTURE EVALUATION METHOD 3.1 Gesture feature representation
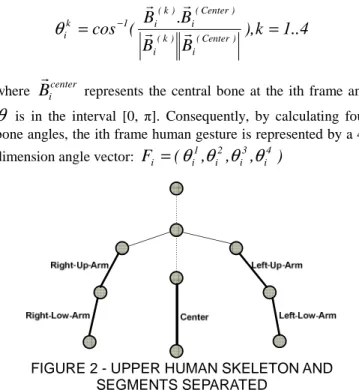
To animate user gesture by a virtual human, we use a human skeleton model called H-ANIM 1.1 [8] which defines human body as a number of segments (such as the forearms, hands and feet) connected to each other by joints (such as elbows, wrists and ankles). Each joint in the body is represented by a joint node used to define the relationship of each body segment to its immediate parent. In terms of using the human skeleton model to evaluate the gesture with a view to reducing computational complexity, we consider using a gesture feature representation which deals with motion capture data. Figure 2 illustrates the upper human skeleton and segments separated to extract the gesture feature representation of our approach. The upper human skeleton model in this figure contains ten joints that are constructed as a tree diagram. Five bones are extracted as the objects to represent gesture feature, including four bones in the upper human limbs and a central bone that is connected by root and chest joints as a reference bone. Each bone is defined as a vector from the upper joint to the lower joint in the upper human skeleton. For every limb bone, the bone angle is defined as the angle between the limb bone and the central bone.
4
..
1
k
),
B
B
B
.
B
(
cos
(Center) i ) k ( i ) Center ( i ) k ( i 1 k i=
=
−r
r
r
r
θ
whereB
icenterr
represents the central bone at the ith frame and
θ
is in the interval [0, π]. Consequently, by calculating four bone angles, the ith frame human gesture is represented by a 4-dimension angle vector:F
(
,
,
,
i4)
3 i 2 i 1 i i
=
θ
θ
θ
θ
FIGURE 2 - UPPER HUMAN SKELETON AND SEGMENTS SEPARATED
3.2 Key frame extraction technique for motion capture data
The human gesture data represented by bone angle vectors above could be treated as a cluster of four trajectories curves in the bone angle space thus the problem of measuring the similarity between two human gestures hereafter becomes the problem to measure the similarity of four pairs of the trajectories curves, respectively. Due to the fact that the complexity of the current techniques to measure the similarity between two trajectories curves depends strongly on the dimension of both gestures. Therefore, we consider the technique to reduce the dimensions. Indeed, as opposed to the executed gesture of the user, reference gestures are the prepared data which is independent from the main process. Hence, applying the dimension reduction technique on those gestures doesn’t impact on the performance of the system. In practice, we perform the dimension reduction technique in reference gestures as a database pre-processing step. Our dimension or key point reduction technique for motion capture data is based on the curve simplification algorithm defined by Lowe [9] that has the complexity in the order of O(n*N) in which, n is the original dimension of the curve and N is the its reduced dimension. The idea of this algorithm is as follows [10] [11]: initially, the trajectory curve will have two key points, one at the beginning and the other at the end. Then the point that produces the highest error value will be turned into a key point, and the algorithm will continue iteratively. Due to the fact that, in our work, two axis of the coordinate system for the time-series curves do not have the same property, while vertical axis is represented in the degree unit the horizontal one is represented in the frame number unit. Therefore instead of using the
Euclidean distance of the point to a line as in the original version of Lowe technique, we utilize a distance measure of the length of the segment defined by the given point and the point lied in the line which has the same frame number value (orthogonal point). The ideal is illustrated in Figure 3 thus the modified technique to simplify the candidate curve is described as follows:
FIGURE 3 - AN ILLUSTRATION OF THE UTILIZED DISTANCE INSTEAD OF USING THE EUCLIDEAN DISTANCE AS IN THE ORIGINAL VERSION OF THE
LOWE TECHNIQUE
Step 1: Set the first and the last points as key points,
creating 2 key points.
Step 2: Find the highest absolute distance point, which
would have the distance called the error distance.
Step 3: If the error distance is lower than a specified
threshold
σ
, stop further subdividing this interval. Otherwise, create a new key point at the point with the highest error distance.Step 4: Sub-divide the current state into two smaller
segments, a segment between the beginning key point and the newly created middle key point, and another segment between the middle key point and the ending key point. Assume that the new segments now have only 2 key points and restart the algorithm from step 2 for both segments.
Figure 4 shows the modified algorithm to simplify the curve step by step.
FIGURE 4 - AN ILLUSTRATION OF THE MODIFIED CURVE SIMPLIFICATION IN WHICH, THE CHOSEN
Notice that, though we describe the dimensionality reduction technique for the separated planar curve, in practice we perform the technique simultaneously for the cluster of four curves of the gesture. Hence, a frame is chosen as long as a key-frame on condition that there is at least one point of the key-frame is the key point.
3.3 Distance function to evaluate the gestures
Our chosen distance function to evaluate the gestures is based on constrained Longest Common Sub-Sequence (cLCSS) technique which is widely used to solve the time-series data matching problem. Therefore, we review the related works for time-series data matching techniques to explain why we choose the cLCSS in our system. Time-series data matching is a part of data mining in a very large database (VLDB) domain. To solve the time-series data matching problem, there are many proposed methods classified into two main approaches: Model-based approach such as Hidden Markov Model (HMM)[17], Neural Network (NN)[18], and Distance function-based approach, which is differentiated into two sub-approaches, in which the first one is called the Metric functions such as Euclidean distance, Manhattan distance or Normal distance [19] and the second one is called the Non-metric functions such as constrained Dynamic Time Wrapping (cDTW)[12], cLCSS [15], Edit distance with Real Penalty (ERP)[20], Edit Distance on Real sequence (EDR)[21], Spatial Assembling Distance (SpADe)[22], etc. In that domain, the experimental results of Keogh et al., 2002 [12] have to be mentioned. Keogh et al. showed that the performance of later is much better than that of the first one, for both criteria of accuracy and computational cost. Moreover, the work of Ding et al. [13] performed a comparison of the major techniques of distance function-based approach by testing their effectiveness on 38 time series data set from a wide variety of application domains. Experimental results obtained show that in over a dozen of distance measures of similarity among time series data in the literature, cLCSS [14][15] and cDTW [12] are slightly better than the others from accuracy point of view. Moreover, on large data set, computation cost of cLCSS and cDTW is very close to Euclidean distance algorithm.
Actually, cLCSS and cDTW are the most popular techniques used in time-series data matching application. However, in our case, we work with motion capture (MoCap) data which are a type of time-series data. MoCap data are captured by recording the positions of the markers during the motion. Unlike other types of time-series data (stock, weather, etc), MoCap data usually have many outliers and noises mainly due to sensor failures, disturbance signals or errors in detection technique. By their characteristics, MoCap data consist of different sampling rates of tracking and recording devices combined with different speeds of moving objects. Therefore, we would like to use a distance function that can address the following issues [14]: different sampling rates or different speed, different data length, capability of ignoring the outliers and robustness to noise. Practically, cDTW technique performs on all items of a MoCap data sequence so cDTW is not capable
of ignoring outliers. Furthermore, this technique is sensitive to noise. On the contrary, cLCSS technique has already been applied to address these problems [16]. Effectively, some others works have shown that cLCSS is more robust and appropriate when comparing distance measure for MoCap data than cDTW [17]. The standard of cLCSS [8] over two multi-dimensional time-series gestures Q (reference gesture) and C (executed gesture of user) with dimensional length of n and m, respectively, is defined recursively as follows:
≤ − ≤ > − ∈ ∀ ≤ − ≤ < − ∈ ∀ + < = n d,n d,t d,n δ,ε δ,ε n d,n d,t d,n δ,ε δ,ε δ,ε δ n m 0 and ε c q D, d if )) (Q,Head(C) ),LCSS (Head(Q),C (LCSS max δ n m 0 and ε c q D, d if ead(C)) (Head(Q),H LCSS 1 n m if ) (Head(Q),C LCSS empty is C or Q if 0 (Q,C) LCSS
where
δ
∈
ℜ
nis the dimensional threshold,ε
∈
ℜ
n*Dis the spatial threshold and D is the total number of dimensions to match over. The temporal and spatial complexities of cLCSS model are in the order ofO
(
δ
(
n
+
m
))
with a constant matching windowδ
andO
(max(
m
,
n
))
, respectively [14]. The final similarity between two time-series gesture is defined as: ) m ; n min( ) C , Q ( LCSS ) C , Q ( S with ) C , Q ( S 1 ) C , Q ( D , , , , ε δ ε δ ε δ ε δ = − =In practice, the dimension of reference gesture and that of gesture executed by subject aren’t recorded in the same frequency because of the latency. Hence, before applying the dimensionality reduction technique and the LCSS algorithm, we perform a uniform frequency technique to ensure that the dimensional length of executed gesture (C) is equal to the one of reference gesture (Q) thus the value m is equal to n. In addition, because cLCSS algorithm carries only the geometric similarity between two gestures, we define another measure which gives the executed time similarity between them. This similarity bases on the elapsed time of two gestures. Given TQ
and TC are the elapsed times of gesture Q and C, respectively.
The executed time similarity between two gestures Q and C is defined simply as follows:
) T , T max( ) T , T min( ) C , Q ( V C Q C Q =
Hence the final similarity between reference gesture and executed gesture of subject is defined as:
(%) 100 * ) C , Q ( V * ) C , Q ( D ) C , Q ( P =
Practically, similarity measure P (%) and level of reference gesture are used to determine the learning ability of subject.
IV. EXPERIMENTS AND RESULTS
In this section, we describe the experiments carried out to analyze the result of our proposed method to measure the human gesture learning ability of the subjects. In fact, our method is based on the the curve simplification to reduce the computational cost and the cLCSS algorithm to measure the similarity between two motions. Hence, we consider validating the effectiveness of the dimensionality reduction as well as the performance of the cLCSS on the dimensionality reduction human motion data. The experiments are divided by two parts. The first one is carried out to analyze the performance of the dimensionality reduction technique and the validity of the similarity measure based on cLCSS. The second one is executed to analyze the result of our proposed method to measure the human gesture learning ability of the real subjects.
4.1 Dimensionality reduction effectiveness and the validity of LCSS to the human gesture data
4.1.1 Performance of the dimensionality reduction technique
To analyze the performance of the dimensionality reduction technique based on the curve simplification, we define a pruning scale P which is described as follows:
(%) 100 * dataset in gestures of frames of Number gestures reduced of frames of Number P=
The human motion dataset for the experiment is gathered from “The MocapClub.com” [23] with various kinds of human motion activities such as the walking, running, dancing, kung-fu and etc which are recorded in the frequency of 60Hz with more than 42 markers attached on the human body. Due to the proposed approach of the human motion representation, we extracted from the original dataset the 3D position of 8 joints of the kinematic chain model as described in Figure 2. Thus, we transformed them to the bone angle space and reorganized them so that each human motion is described by 4 curves of the bone angle. The obtained dataset differed significantly in size and length. In order to produce meaningful results, we reorganized obtained dataset in the bone space. We derived six sets of data, each containing 270 human motion sequences, with variable lengths of 32, 64, 128, 256, 512 and 1024, respectively. Short sequences were gathered by using a scale factor of the length of original data and the desired lengths of extracted data while long sequences were produced by concatenating original sequences.
4.1.2 Validate the cLCSS to measure the similarity of the dimensionality reduction gestures
In order to validate the performance of the cLCSS measuring the similarity of the dimensionality reduction gestures, a random pairs of human gestures was chosen from the dataset. We carried out 50 trials of the longest dimension human gestures. We occupied the measured similarity in percentage and the executed time of each pair for analyzing. The results of both the analysis are described as below in the next part.
4.1.3 Results
The performance of the dimensionality reduction technique based on the curve simplification
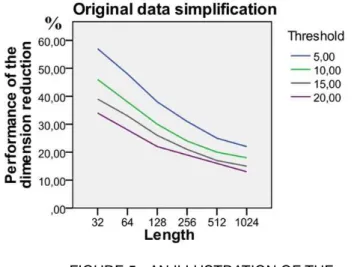
Figure 5 illustrates the performance of the curve simplification P1 due to the length of the human motion when
we carry out the technique for the gathered dataset. As shown in the figure, the performance of the reducing the dimension of the curves increased with the length of the data suggesting. In practice, to choose the specified threhold
σ
we recall the work of Baek et al. [2] which developed experiment to choose the threshold for the human joint of the kinematic chain model. From this work, the suggested error interval for human joint is (100,200) thus we choose the specified thresholdσ
=
10
0 as the smallest value as possible which is illustrated as the green curve in Figure 5.FIGURE 5 - AN ILLUSTRATION OF THE PERFORMANCE OF THE DIMENSIONALITY REDUCTION TECHNIQUE TO THE REAL HUMAN MOTION DATASET. THE SPECIFIED THRESHOLD IS IN
DEGREE
The validity of the lcss to measure the similarity of the dimensionality reduction gestures
In order to validate the effectiveness of LCSS technique in terms of the reduced dataset, we consider in two aspects, the similarity measure deviation and the executed time deviation between the performing LCSS on the original gestures and the reduced gestures.
Figure 6 describes the similarity curves obtained when we carried out 50 random trials of LCSS technique to the original gesture (blue curve) and reduced gestures (curve). As shown in the figure, the similarity deviations of the reduced gestures from the original gestures are inconsiderable. Indeed, the mean of the similarity deviation is 0.3 ÷ 3.3 (%) which means, thought we performed the dimensionality reduction technique, the similarity of the reduced gestures is very slightly changing in comparison with the original gestures. On the contrary, the difference of the executed time between them is meaningful as shown in Figure
7. In fact, the executed time is consistently reduced and the difference is considerable, in which the average of the executed time for original gestures is 220÷16 (ms) while that of the reduced time is only 30 ÷ 57 (ms).
FIGURE 6 - AN ILLUSTRATION OF THE SIMILARITY COMPARISON BETWEEN THE PERFORMING LCSS ON 50 PAIRS OF THE ORIGINAL PAIRS OF GESTURES
AND THE REDUCED GESTURES.
FIGURE 7 - AN ILLUSTRATION OF THE EXECUTED TIME COMPARISON BETWEEN THE PERFORMING LCSS ON 50 PAIRS OF THE ORIGINAL GESTURES AND REDUCED GESTURES
4.2 Human gesture learning ability measurement
In this part, we describe our experiment to analyze the result of our proposed method to the real subjects. The experiment is executed in the Cave Automatic Virtual Environment.
4.2.1 Database organization
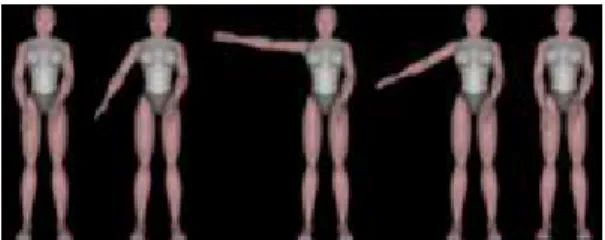
As we described above, our data test gestures are constructed from six gesture-units which are represented in the figures as follows.
FIGURE 8 - GESTURE-UNIT 1: Firstly, from the rested state, the left-arm is raised in front of user till it is perpendicular to the vertical axis of human body and then the left-arm is taken
down to the rested state
FIGURE 9 - GESTURE-UNIT 2: Firstly, from the rested state, the right-arm is raised in front of user till it is perpendicular to the vertical axis of human body and then the
left-arm is taken down to the rested state
FIGURE 10 - GESTURE-UNIT 3: Firstly, from the rested state both of arms are raised in front of user till they are perpendicular to the vertical axis of human body and then they
are taken down to the rested state
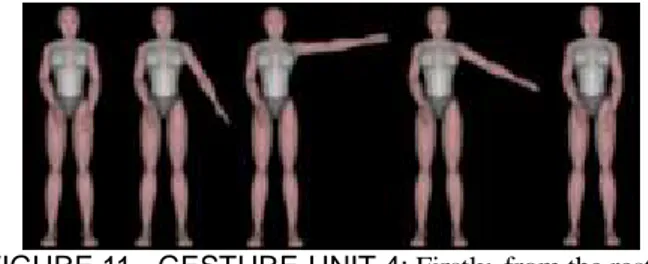
FIGURE 11 - GESTURE-UNIT 4: Firstly, from the rested state left-arm is raised in horizontal of user till it is perpendicular to the vertical axis of human body and then the
FIGURE 12 - GESTURE-UNIT 5: Firstly, from the rested state right-arm is raised in horizontal of user till it is perpendicular to the vertical axis of human body and then the
right-arm is taken down to the rested state
FIGURE 13 - GESTURE-UNIT 6: Firstly, from the rested state both of arms are raised horizontal of user till they are perpendicular to the vertical axis of human body and then
they are taken down to the rested state
From those six of gesture-units, we construct twenty-one human reference gestures according to six levels of gesture so that the reference gesture of ith level is the combination of i different gesture-units. Moreover, level 1 has 6 reference gestures samples and the others levels (from 2 to 6) have 3 reference gesture samples. In fact, 6 reference gesture samples of level 1 are also the 6 gesture-units, requiring us to validate the normalization of the gesture-units due to the performance learning of users. This explains why level 1 has 6 gestures while the others have only 3 samples.
4.2.2 Procedure
In practice, each subject executes 21 trials of human gestures. The procedure of experiment is performed as follows: the human avatar renders a reference gesture and mission of subject is seeing and memorizing this gesture. When the virtual human gesture finishes, the subject tries to reproduce this gesture to obtain the most similarity in terms of both geometry and executed time of gesture. Besides, this subject gesture is animated by the human avatar. The similarity between reference gesture (rendered by the virtual human) and the reproduced gesture of the subject (animated by the virtual human also) is measured as soon as the subject finishes his gesture.
4.2.3 How to assess the ability of learning the human gesture of the subject?
We occupy the obtained performance value P (%) of eight subjects performing the 21 trial human gestures then we calculate the mean value of the total performance for the ith level of the human gesture called
P
i(
i
=
1
..
6
)
for each subject. To assess the level of the ability of learning the human gesture of the subjects, given a threshold value0
≤
θ
≤
100
we define that the ability of learning the human gesture of the subject is at level k if the inequality as follows is met:
k
i
,
P
i≥
θ
∀
≤
4.2.4 Participants
Our experiments were performed for healthy subjects. In fact, eight participants aged 22-43 years (i.e. mean 39.4 ÷ 3.8) have participated in our experiment.
4.2.5 Results
The mean values
P
1of eight subjects are shown in Table 1. In the table, we can see that the standard deviations ofP
1for eight subjects are fewer than 5%. Therefore, the normalization of six gesture units is efficient, thus complicated gestures constructed by those gesture-units are reliable.TABLE 1 - MEAN VALUE OF LEVEL 1 OF EIGHT SUBJECTS S1 S2 S3 S4 S5 S6 S7 S8 M (%) 94, 3 93, 3 93, 6 86, 5 92, 6 88, 6 94, 5 97, 1 N 6 6 6 6 6 6 6 6 Std. Devi 2,4 2,3 3,3 4,9 4,0 1,8 4,9 3,1
In Figure 14, we show the mean value curves for eight subjects. Eight curves illustrate the mean value at 6 levels of the human gesture complexity. We can see that all curves tend to decrease due to the increasing of the human gestures complexity. This means that more complicated human gestures are more difficult to execute.
FIGURE 14 - MEAN VALUE PERFORMANCE OF HUMAN GESTURE EXECUTED OF EIGHT SUBJECTS
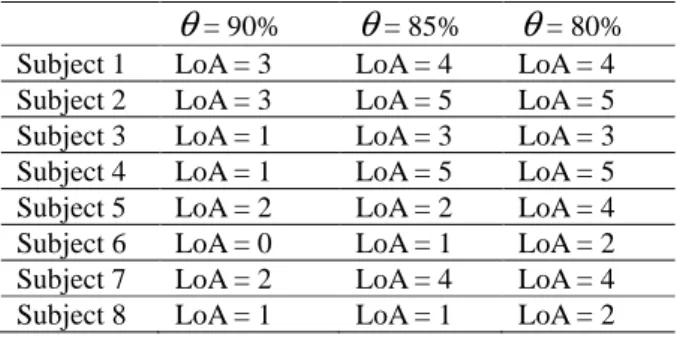
TABLE 2 - LEVEL OF THE ABILITY OF LEARNING
HUMAN GESTURES OF EIGHT SUBJECTS
θ
= 90%θ
= 85%θ
= 80% Subject 1 LoA = 3 LoA = 4 LoA = 4 Subject 2 LoA = 3 LoA = 5 LoA = 5 Subject 3 LoA = 1 LoA = 3 LoA = 3 Subject 4 LoA = 1 LoA = 5 LoA = 5 Subject 5 LoA = 2 LoA = 2 LoA = 4 Subject 6 LoA = 0 LoA = 1 LoA = 2 Subject 7 LoA = 2 LoA = 4 LoA = 4 Subject 8 LoA = 1 LoA = 1 LoA = 2 As described above, to assess the level of the human gesture learning ability of the subject, we defined a thresholdθ
and thus the gestures learning ability of the subject is measured by comparing the thresholdθ
with the performance of reproducing the human gesture of the subjects. We show in Table 2 the level of the ability (LoA) of learning the human gesture of subjects corresponding to the variety of the thresholdθ
.V. CONCLUSION
In this paper, we have proposed a novel approach to measure the ability of learning human gestures in the third-person view virtual environment for motor rehabilitation. The valid assessment is based on the function distance to measure the similarity of the gestures which are simplified the dimension for reducing the computational cost. The results obtained with healthy subjects prove to be reliable and would be applied to rehabilitated subjects in motor rehabilitation.
ACKNOWLEDGMENTS
This work is part of the project SIMACTION supported by the French Agency for the Research (ANR) through the call “Technologies for Health”.
REFERENCES
[1] P. Salamin, F.Vexo, and D.Thalmann. The Benefits of Third-Person Perspective in Virtual and Augmented Reality ? In proceeding of the ACM Symposium on Virtual Reality Software and Technology (VRST ‘06), p. 27-30. 2006
[2] Masaki Oshita. Motion-Capture-Based Avatar Control Framework in Third-Person View Virtual Environments. ACM SIGCHI International Conference on Advances in Computer Entertainment Technology 2006 (ACE 2006), Hollywood, U.S.A., June 2006.
[3] S. Baek, S. Lee, and G. Kim. Motion retargeting and evaluation for vr-based training of free motions. The Visual Computer, 19(4):222--242, July 2003.
[4] Holden, M., Todorov, E., Callahan, J., and Bizzi, E. Virtual environment training improves motor performance in two patients with stroke: Case report. Neurology Report, 23, 57-67. 1999.
[5] Piron, L., Dam, M., Trivello, E., Iaia, V., and Tonin, P. Virtual environment training ameliorates motor deficits in post-stroke patients. Neurology, 52, A138. 1999.
[6] J. Cameron and J. Lasenby. A real-time sequential algorithm for human joint localization. In ACM SIGGRAPH Posters, page 107, USA, 2005.
[7] Aristidou, A., Cameron, J., and Lasenby, J. Real-Time Estimation of Missing Markers in Human Motion Capture. ICBBE 2008. The 2nd International Conference on Bioinformatics and Biomedical Engineering,. Volume , Issue , Page(s):1343 – 1346. 2008.
[8] Marc Cardle, Automated motion editing. Technical report, Computer Laboratory – University of Cambrigde. 2004.
[9] G. Lowe, Three-dimensional object recognition from single two dimensional images. Artificial Intelligence, vol. 31, no. 3, pp. 355–395, March 1987.
[10] L. S. Lim and D. Thalmann, Key-posture extraction out of human motion data by curve simplification, Proceedings of the 23rd Annual EMBS International Conference, Istanbul, Turkey, 2001.
[11] Onder, O. Gudukbay, U. Ozguc, B. Erdem, T. Erdem, and C. Ozkan, Keyframe Reduction Techniques for Motion Capture Data. In proceeding of 3DTV Conference: The True Vision - Capture, Transmission and Display of 3D Video, 2008.
[12] Keogh. Exact Indexing of Dynamic Time Warping. In proceeding of VLDB Conference. 2002.
[13] Ding, H.Trajcevski, G. Scheuermann, P. Wang, and Keogh. Querying and Mining of Time Series Data Experimental Comparison of Representations and Distance Measures. In Proc of the 34th VLDB. 1542--1552. 2008.
[14] Keogh and C. A. Ratanamahatana. Exact indexing of dynamic time warping”. Knowl. Inf. Syst.,7(3). 2008.
[15] Keogh and S. Kasetty. On the Need for Time Series Data Mining Benchmarks: A Survey and Empirical Demonstration. Data Min. Knowl. Discov., 7(4). 2003.
[16] Vlachos, G. Kollios, and D. Gunopulos. Discovering similar multidimensional trajectories. In proceding of ICDE conference. 2002
[17] Croitoru, Peggy Agouris, and Anthony Stefanidis.3D trajectory matching by pose normalization. Geographic Information Systems Proceedings of the 13th annual ACM international workshop on Geographic information systems Bremen, Germany. 2003
[18] Porikli,F. Trajectory Distance Metric Using Hidden Markov Model based Representation. In proceeding of IEEE European conference on Computer Vision. 2004
[19] J. Berndt and J. Clifford. Using dynamic time warping to find patterns in time series. In KDD Workshop. 1994
[20] L. Chen and R. T. Ng . On the marriage of lp-norms and edit distance. In VLDB.2004.
[21] L. Chen, M. T. ¨Ozsu, and V. Oria . Robust and fast similarity search for moving object trajectories. In SIGMOD Conference. 2005
[22] Y. Chen, M. A. Nascimento, B. C. Ooi, and A. K. H. Tung. SpADe: On Shape-based Pattern Detection in Streaming Time Series. In ICDE. 2007.