HAL Id: hal-00987667
https://hal.archives-ouvertes.fr/hal-00987667
Submitted on 6 May 2014
HAL is a multi-disciplinary open access
archive for the deposit and dissemination of
sci-entific research documents, whether they are
pub-lished or not. The documents may come from
teaching and research institutions in France or
abroad, or from public or private research centers.
L’archive ouverte pluridisciplinaire HAL, est
destinée au dépôt et à la diffusion de documents
scientifiques de niveau recherche, publiés ou non,
émanant des établissements d’enseignement et de
recherche français ou étrangers, des laboratoires
publics ou privés.
partitioning in a polluted cloud during wintertime
Maud Leriche, Laurent Deguillaume, Nadine Chaumerliac
To cite this version:
Maud Leriche, Laurent Deguillaume, Nadine Chaumerliac. Modeling study of strong acids
forma-tion and partiforma-tioning in a polluted cloud during wintertime. Journal of Geophysical Research:
At-mospheres, American Geophysical Union, 2003, 108 (D14), pp.1984-2012. �10.1029/2002JD002950�.
�hal-00987667�
Modeling study of strong acids formation and partitioning in
a polluted cloud during wintertime
Maud Leriche, Laurent Deguillaume, Nadine Chaumerliac
Laboratoire de Météorologie Physique (LaMP), Université Blaise Pascal/CNRS, Aubière, France
Abstract. A multiphase chemistry model coupled with a quasi-spectral microphysical model has been applied to measurements from the European CIME campaign to quantify the formation of the strong acids nitrate and sulfate, and to evaluate the role of microphysical processes in redistributing reactive species among the different phases (gas versus cloud and/or rain). Significant formation of nitrate and sulfate are found to be due to the reaction of pernitric acid with the sulfite ion. Moreover, pernitric acid, because of its equilibrium in the gas phase and its high solubility, is always available both in cloud water and in rainwater via mass transfer from the gas phase. The sulfite ion comes from the mass transfer from the gas phase of sulfur dioxide in cloud water. When rain formation begins, it is efficiently
transferred to the rainwater by collision/coalescence processes. This leads to an enhancement in strong acid production when microphysics is activated in the model. Modeled results have been compared with experimental data, in an effort to retrieve a behavior law related to the partitioning between the gas and aqueous phases of the cloud. In particular, when
collision/coalescence processes are considered, an improvement in retrieving the partitioning of soluble species and especially nitrate is observed. A higher production in sulfate could help interpret the discrepancy of global model calculations with observed sulfate concentrations in Europe in wintertime.
1. Introduction
For several years, significant efforts have been made by the scientific community to understand atmospheric chemistry. However, these efforts have concentrated mainly on atmospheric chemistry in the homogeneous gas phase, which currently begins to be well documented [Atkinson et al., 1996; IPCC, 2001]. The role of clouds in the chemical composition of the atmosphere is significant in two aspects of planetary evolution: the atmospheric oxidizing capacity and the greenhouse effect linked to the role of aerosols (direct and indirect) in radiative forcing. Even if some modeling studies have tried to understand the overall role of cloud chemistry in global climate studies [Jacob et al., 1986;
Lelieveld and Crutzen, 1990; Dentener et al., 2002], our knowledge is still at a rudimentary stage when looking at the
details of cloud processes [Facchini, 2002].
Recently, the reaction pathway of pernitric acid with the sulfite ion in aqueous phase has been proposed to play an important role in tropospheric chemistry [Warneck, 2000; Leriche et al., 2000]. Furthermore, recent studies by Warneck [2000], Dentener et al. [2002] and Williams et al. [2002] have also suggested the potential role of aqueous phase pernitric acid reactivity in tropospheric chemistry. The kinetic constant of this reaction has been measured by Amels et
al. [1996]. Due to its thermal decomposition in the gas phase, its impact on tropospheric chemistry via cloud chemistry
could be important in winter and/or at high latitudes. The reaction of pernitric acid with the sulfite ion produces both sulfate and nitrate and is the only reaction pathway, which links N-chemistry and S-chemistry. This reaction could have an impact on the amounts of nitrate and sulfate in aerosols for non-precipitating clouds and on the wet acid deposition
when clouds are precipitating. Also, this reaction could have an effect on NOx levels because pernitric acid is a NOx
reservoir species [see Leriche et al., 2001]. Finally, pernitric acid can lead to a release of nitrous acid by the cloud droplets at moderate pH in moderately polluted conditions [Williams et al., 2002]. The possible role of this reaction in the production of sulfate aerosol could be a first hypothesis to explain the systematic under-estimation of sulfate in winter in Europe by global models as described for example in Feichter et al. [1996], in Chin et al. [2000] and in Barrie
et al. [2001]. Global models, however, often do not contain a very good description of cloud processes. Many models
exclude the explicit implementation of intermediate chemical reactions, and have resolution too coarse to provide a detailed comparison with measurements in polluted regions.
The present modeling study aims at:
• quantifying the formation of strong acids like nitrate and sulfate when considering multiphase chemistry
during an observed cloud event,
• verifying the importance of intermediate species such as HNO4 in this strong acid production and
• evaluating the role of microphysical processes in redistributing reactive species among the different phases
(gas versus cloud and/or rain).
We use the model from Leriche et al. [2001], which presents a coupling between a fully explicit multiphase chemistry model [Leriche et al., 2000] and a quasi-spectral microphysics model based upon Berry and Reinhardt’s parameterization [1974a, b, c, d]. The microphysical scheme considers two categories of particles (cloud drops and raindrops) and aerosol particles are not taken into account.
This model has been used for the modeling of a cloud event [Voisin et al., 2000] during the European CIME experiment [Cloud Ice Mountain Experiment, Atm. Res., Special Issue, 2001], which is a typical polluted wintertime event. The simulation is described in detail in Leriche et al. [2001]. This paper is the continuation of Leriche et al. [2001] paper and focuses on the formation pathway of strong acids, sulfate and nitrate for a precipitating and
non-precipitating cloud. We also compare measurements of the partitioning between the gas and aqueous phase with model calculations. Of particular focus on is the very soluble and reactive species nitric acid which is found to be more efficiently produced when microphysical processes are considered.
2. Description of the model
The model is the result of a coupling between a multiphase chemical box model as described in Leriche et al. [2000] and a quasi-spectral microphysical model based upon a parameterization of a cloud evolution following Berry and
Reinhardt [1974a, b, c, d] and Huret et al. [1994]. The detailed description of the coupling between the chemical and the
microphysical modules can be found in Leriche et al. [2001].
The chemistry included in the chemical module is explicit and describes a rural environment. The gas-phase
mechanism includes the oxidation of methane, and the chemistry of NOy and ammonia, which is derived and updated
after Madronich and Calvert [1990]. The exchange of chemical species between the gas and aqueous phase is parameterized by the mass transfer kinetic formulation developed by Schwartz [1986]. The thermodynamical data involved in mass transfer are listed in Table 1 with accommodation coefficients and Henry’s law constants. In Table 2, for aqueous phase equilibrium, only new references for updated values after Leriche et al. [2000] are given. The
aqueous phase chemistry includes the detailed chemistry of HOx (Table 3), chlorine (Table 4), carbonates (Table 5),
NOy (Table 6) and sulfur (Table 8) and the oxidation of organic volatile compounds (VOCs) with one carbon atom
(Table 7). These aqueous phase chemical mechanisms have been updated and only new references for updated values are indicated in Table 3-8. The pH of the droplets is calculated at each time step by solving a simplified ionic balance equation.
The microphysical module takes into account two categories of liquid water, cloud water and the rainwater, which is
distributed according to a lognormal spectrum defined by the median size diameter D0 and the standard geometric
deviation σ. The microphysical processes taken into account are collision/coalescence represented by autoconversion, accretion and self-collection, and evaporation and sedimentation. The time step of this module is ten seconds.
The chemical and microphysical processes act together to redistribute the chemical species concentrations as described in Figure 1.
This model can be used with two different options. In one case, the microphysical processes are not taken into account, which means that only cloud water is considered varying with time but with a constant radius for the droplets. In the other case, the microphysics is considered, and due to the quasi-spectral nature of the Berry and Reinhardt parameterization, allows for partitioning of the liquid phase among the two water categories (cloud and rain) and for varying mean raindrop diameter. The first case simulates a non-precipitating cloud while the second case corresponds to a precipitating cloud with maritime parameters (defined through the median size diameter and the standard geometric deviation for the lognormal distribution of cloud droplets).
3. Results and discussion
3.1 Description of the simulation
The conditions of the simulation are described in details in Leriche et al. [2001]. We only briefly summarized these conditions below.
To initialize the model, we used data from the Cloud Ice Mountain Experiment (CIME campaign). CIME was a European experiment, which took place during winters 97 and 98 at the top of The Puy de Dôme mountain in the center of France. During December 1997, chemical measurements were performed in both gas and aqueous phases by Voisin et
al. [2000] in the presence of clouds. We chose to simulate the 13th of December because there was a stable meteorological situation which produced drizzle without either ice or rain. The air mass was polluted coming from the North-North-East. In the simulation, the chemical measurements used to initialize the chemistry are typical of a
wintertime-polluted air mass with high NOx (7.1 ppbv) and high formaldehyde (6 ppbv) concentrations.
Meteorological parameters are prescribed by the time change of the temperature, which simulates the temperature variation in an orographic cloud at the top of the Puy de Dôme mountain, the site of the CIME experiment. The
simulation begins at noon and its duration is half an hour. The liquid water content of the cloud initialized with 0.3 g m
-3
, further evolves as a function of time and temperature through microphysical conversions, providing the partitioning between cloud and rainwater, and the change in raindrop diameter. At the end of the simulation, the cloud evaporates as the temperature increases. The maximum in the cloud water and rainwater content are respectively found at 12.7 p.m. and at 12.12 p.m. If the microphysical processes are not considered (when autoconversion is turned off), the liquid water content of the cloud only evolves through the effect of varying the temperature across the simulation (which describes a non-precipitating case). In this case, the maximum in the liquid water content arises at 12.15 p.m.
As discussed before, two options are available for considering cloud chemistry: either the liquid water content is in the only one form of cloud with no conversion allowed for rain production (non-precipitating case) or liquid water is shared out between cloud phase and rain phase with varying raindrop diameter (precipitating case).
3.2. Formation pathway of strong acids: sulfuric and nitric acids
3.2.1. Simulation results: Precipitating versus non precipitating cloud.
We now examine the formation pathway of strong acids (sulfate and nitrate) in the gas phase, in cloud and in rain. We present results for two simulations, with and without microphysical conversions. Results for the formation of nitric acid and sulfate through chemical reactions are presented in Figure 2 for both cases. Only the main production pathways are indicated in both gas and aqueous phases. First, total production of both nitric acid and sulfate (gas plus liquid phases) are higher in the case where microphysics is activated, a factor of 1.2 more important for nitric acid and a factor 1.45 more important for sulfate than for the case without microphysics. The production pathway of pernitric acid (A69) is an important contribution to the formation of both nitric acid and sulfate. This pathway accounts for 58% of the total sulfate production for the case with microphysics considering cloud plus rain contributions, and 53% for the case without microphysics. For nitric acid formation, it accounts for 37% of the total production for the case with microphysics considering cloud plus rain contributions, and 28% for the case without microphysics. The budget of
HNO4 indicates that the reaction with the sulfite ion contributes 82% to the total pernitric acid destruction (gas and
liquid phases) in the case with microphysics considering cloud plus rain contributions. The other predominant
destruction pathways of HNO4 are A66 and A68 (respectively around 7% and 10% in the case with microphysics
considering cloud plus rain contributions). For nitric acid, the main production pathway arises via the gas phase
production from reaction of NO2 with OH (58% for the case with microphysics and 68% for the case without
microphysics). This could be expected in our run conditions describing a high NOx regime. The contribution of
hydrolysis of N2O5 (A74) to the production of nitric acid is less significant with 5% contribution to the total production
sulfate formation in the gas phase is negligible and the formation in the aqueous phase by oxidation of sulfur dioxide by hydrogen peroxide (A161) contributes 39% to the total production for the case with microphysics considering cloud plus rain contributions and 46% for the case without microphysics. If we examine the formation pathway in the aqueous phase for the case with microphysics, we observe that the contribution of one reaction is the same in cloud and in the rain phase. This fact explains the more important total production of nitric acid and sulfate when microphysics is considered.
These results underline the efficient production of nitrate and sulfate by the pernitric acid pathway in the aqueous phase, which enhances total production of sulfate and nitrate in aerosols for a non-precipitating cloud and leads to an acidification of rain for a precipitating cloud. This aqueous production pathway of both nitrate and sulfate is not taken into account in global models such as the GOCART model for example [Chin et al., 2000]. As suggested by Dentener et
al. [2002], the production of sulfate aerosols by pernitric acid in cloud could improve the comparison between sulfate
concentrations simulated by global models with observations. In fact, global models tend to under-estimate sulfate concentrations over Europe in winter.
3.2.2. Sensitivity tests.
We have made some sensitivity tests on this simulation on microphysical processes or on initial chemical conditions to understand their relative contribution to the observed behavior of the strong acid formation. A first test on sedimentation shows that sedimentation acts as a sink for soluble species but has no significant role on chemical
pathways. Secondly, to test how the contribution of pernitric acid in nitric acid and sulfate formation is linked to NOx
levels, we have performed a sensitivity test in which we have reduced the initial NOx concentration by a factor of 50.
Results of this new run are presented in Figure 3, which is directly comparable to Figure 2, except that total nitric acid
production is 6 to 9 times smaller when reducing NOx by 50 and total sulfate production is 1.2 to 1.16 times smaller. As
expected, when diminishing the initial NOx concentration, the contribution to total nitric acid production of gas phase
pathway becomes less important and represents 10% and 16% of the total nitric acid production respectively, when microphysics is considered, or not.
But surprisingly, when diminishing the initial NOx concentration, the production of strong acids by the pathway
involving pernitric acid is still important.
For nitric acid, pernitric acid pathway contributes 90% to the total production for the case with microphysics considering cloud plus rain contributions and 84% for the case without microphysics. For sulfate, it represents 28% of the total production for the case with microphysics considering cloud plus rain contributions and 21% in case without microphysics. The most important production pathway for sulfate production is now the oxidation of the sulfite ion by
hydrogen peroxide because the diminution of NOx involves a new chemical regime of peroxides production. This can
explain the smaller diminution of total sulfate production in comparison to the diminution of total nitric acid production.
The differences observed in the low NOx regime (Figure 3) between the two cases with and without microphysics are
still remaining the same as in the high NOx regime (Figure 2). The productions via aqueous phase are also equivalent in
the cloud and rain phases and contribute equally to the total production for both nitric acid and sulfate. This has to be directly related to the indirect effect of microphysical conversion. To understand this equal production in cloud and rain phases, we have examined the sources of the precursors of nitric acid and sulfate in the aqueous phase. We only focus on the reaction with pernitric acid since the source of hydrogen peroxide in the aqueous phase is the same as pernitric acid.
On the one hand, nitric acid and sulfate are produced in the aqueous phase through the oxidation of the sulfite ion by pernitric acid continuously formed in the gas phase and very soluble. On the other hand, the sulfur dioxide is transferred from the gas phase to the cloud phase through mass transfer, before rain production and produces the sulfite ion that leads to nitric acid and sulfate production. A schematic diagram is drawn in Figure 4 to investigate the origin of those chemical precursors of nitric acid and sulfate in aqueous phase. The pernitric acid, available in the gas phase, is efficiently transferred to the aqueous phase through mass transfer with a relative contribution of pernitric acid production in the cloud phase of 90% and a relative contribution of pernitric acid production in the rain phase of 87%. The other production pathways of pernitric acid in the aqueous phase are reactions A64 and A65, which contribute respectively 8% and 2% to total pernitric acid production in the cloud phase and 8.5% and 2% in total pernitric acid production in the rain phase. The remaining production in the rain phase comes from conversion of cloud water into rainwater by collision/coalescence processes. Although the kinetic constant of reaction A65 is greater than that of
reaction A64, reaction A65 has a more important contribution in HNO4 production because HO2 prevails on O2
for
simulated low pH values (pKa of HO2 4.8 and simulated pH 3.7). For sulfite ion production in the aqueous phase, the
pattern is slightly different. The sulfite ion already exists in cloud phase from the mass transfer of sulfur dioxide, and as the rain appears, it is transferred through collision/coalescence processes to the rain phase. This source of the sulfite ion in the rain phase represents 99% of the total production in the rain phase (chemical and microphysical processes). Moreover, the destruction of the sulfite ion in the cloud phase by collision/coalescence processes is only 1% of the total destruction (chemical and microphysical processes). The resulting effect of this precursor production is an increase in the production of nitric acid and sulfate equally shared among the cloud and the rain phases.
3.2.3. Potential uncertainties in the chemical mechanism.
The above discussion on the formation of strong acids in cloud and rain strongly depends on the value of the reaction constant of the oxidation of sulfite ion by pernitric acid (A69). This constant has only been measured once in Amels et
al. [1996] study, which is part of the PhD work of Götz [1996] and this value can be a source of potential error. Despite
the lack of data on the reaction constant A69, the reactivity of peroxo compounds R-OOH towards the sulfur(IV) has been investigated in details by Drexler et al. [1991]. In this study, looking at the reactivity of hydrogen peroxide (R = H), peroxonitrous acid (R = NO) and peroxoacetic acid (R = Ac), a general relationship for the rates of oxidation of sulfur(IV) by peroxo compounds following a three-term rates law was established including available data for reactivity
of peroxomonosulfuric acid (R = SO3
-) and methyl hydroperoxide (R = CH3). These three-term rates are proton
catalysis, general acid catalysis and water catalysis. For hydrogen peroxide, only the proton catalysis is significant for atmospheric chemistry. An interesting result of this study is the relationship correlating the rate constant for water catalysis (independent of pH value) with the pKa of the peroxo compounds. Using this relationship to estimate the
reaction constant of A69 gives a value of 2.2 105 M-1 s-1, which is in the same order of magnitude than the value
measured by Amels et al. [1996].
However, as the main conclusion about strong acids formation depends on the value of reaction constant of A69, additional sensitivity tests have been performed on this reaction constant taking into account the maximal potential error: the constant is divided or multiplied by a factor 10. Figure 5 shows the relative contribution of each production pathway to the total production of nitric acid (a) and sulfate (b) for three cases: the reaction constant of A69 is divided by 10, the reference simulation (using A69 constant) is corresponding to Figure 2 and the reaction constant of A69 is
that the contribution of the reaction A69 is still significant even if the reaction constant is divided by 10 for both production of nitric acid and sulfate. The relative contribution of this reaction is respectively 16.9% and 33% of the total production of nitric acid and sulfate when the reaction constant is divided by 10, is respectively 36.6% and 59% of the total production of nitric acid and sulfate for the reference simulation and is respectively 40% and 64% of the total production of nitric acid and sulfate when the reaction constant is multiplied by 10. For both nitric acid and sulfate, we can notice that the increase of the contribution of A69 as well as the increase of the value of the total production is more important between the simulation where the reaction constant is divided by 10 and the reference simulation than between the reference simulation and the simulation where the reaction constant is multiplied by 10. This is due to the non-linearity of the chemistry.
In conclusion, this test shows that, despite the potential error on the reaction constant of A69, it is clearly demonstrated that this reaction significantly contributes to the production of both nitric acid and sulfate in winter.
3.3. Partitioning of chemical species between phases.
In this paper, we are also interested in investigating the effect of microphysical conversions on the partitioning of chemical species as described by Voisin et al. [2000]. This partitioning was represented by the q factor, defined as:
i g i w RTC LH C q= * (1)
where Cig and Ciw are respectively the gaseous and aqueous concentrations of the species i in molec.cm
-3
, L is the
liquid water content in vol/vol, H* is the Henry law effective constant of the species i in M.atm-1 and R = 0,08206
atm.M-1.K-1). This factor indicates whether the species i is at Henry’s law equilibrium (q=1), under-saturated in the
aqueous phase (q<1) or over-saturated in the aqueous phase (q>1).
An important point is that, while measuring q, the liquid water content involved in the partitioning includes both cloud water and drizzle. In order to adequately compare the measurements with model calculations, we introduce a bulk q factor defined as:
i g total ra in cloud i total w bulk RTC H L L C q , * ) ( + = (2) with ra in cloud ra in i ra in cloud i cloud i total w L L L C L C C + + = , , and * total
H is the effective Henry’s law constant that includes possible dissociation and hydration, using the bulk pH.
The bulk pH, calculated from resolving the ionic balance equation in the mixed solution of cloud water and rainwater, has a mean value of 3.7 whereas the bulk pH measured during the cloud event is more acidic with a value of 3.3. The difference between the experimental and simulated pH values is firstly due to the precision of the experimental pH value, around 0.1 units. Secondly, we use chemical measurements from bulk samples to initialize the model, which may not be representative of the initial chemical composition of cloud droplets determined by aerosol nucleation and not known in detail in the measurements.
Figure 6 shows the partitioning factor between the gas and condensed phase through a comparison between experimental results versus two model results (without and with microphysics) for several chemical species ordered by
values of the q factor for the radical HO2 has been indicated as an example of the partitioning of a very reactive radical but no measurements were available for this species.
We notice a rather good agreement between experimental and numerical results, except for nitric acid and sulfur dioxide when microphysics is not considered. For sulfur dioxide, the discrepancy between model and measurements comes from an overestimation of measured sulfur dioxide concentrations in cloud because of HMSA conversion into S(IV) due to some experimental biases. However, coupling chemistry and microphysics improves considerably the comparison for almost all the soluble species, and more particularly for nitric acid. The remaining difference between numerical and experimental results for nitric acid comes from the discrepancy between pH values that are measured and simulated with an experimental value more acidic. In fact, Voisin et al. [2000] show that the q factor for nitric acid decreases when the pH increases.
The under-saturation of nitric acid in the aqueous phase comes from its high solubility in connection with its production in the gas phase, which is faster than its production in the aqueous phase. In fact, the rate of nitric acid production in the gas phase is greater than the rate of transfer to aqueous phase. This means that the equilibrium time of phase exchange is greater than the characteristic time of nitric acid production in the gas phase. When microphysics is considered, the gaseous nitric acid must pass two aqueous frontiers corresponding to cloud and rain phases. Nitric acid is more under-saturated in the aqueous phase when microphysics is taken into account.
Finally, coupling chemistry and microphysics allows for a more realistic nitric acid partitioning between the gas and aqueous phases, closer to the measurements.
4. Conclusion
A coupled model of multiphase chemistry [Leriche et al., 2001] has been applied to a cloud event taken from the European CIME experiment [Voisin et al., 2000] during a polluted chemical situation.
First, the production pathways of the strong acids, nitric and sulfuric acid are examined. The results show a significant contribution of the reaction between pernitric acid and the sulfite ion in the production of both acids. Moreover, the comparison between a case without microphysics corresponding to a non-precipitating cloud and a case with microphysics corresponding to a precipitating cloud shows a greater production of strong acids when microphysics is considered. This is due to an equivalent production in cloud and rain phases, which arise from interaction between microphysics and chemistry. The study of the main sources of strong acids precursors highlights the role of collision/coalescence processes in the enhancement of strong acids production.
Secondly, modeling results have been compared with data, based upon a behavior law that relates the partitioning among gas/aqueous phases and species solubility. Coupling multiphase detailed chemistry with microphysics allows for retrieving this behavior law that could be possibly used as a parameterization in global models.
The numerical results and their comparisons with observational data demonstrate the interest of such a modeling approach in linking laboratory kinetics with in-situ measurements. It also represents a potential tool for sensitivity analysis on chemical species reactivity and partitioning among various phases of the cloud, which can now be assessed using new instruments such as a counter virtual impactor [Noone et al., 1988]. In that sense, if completed by some aerosol chemistry and microphysics, it could help to interpret data from such an instrumentation platform. More generally, this modeling study has put evidence on the importance of intermediate compounds such as pernitric acid, which is often neglected in models and leads to sulfuric and nitric acid production in clouds [Hermann et al., 2001].
Further laboratory investigations in the conditions of a real atmosphere (temperature, pressure, concentration) for aqueous phase pernitric acid reactivity are needed. However, considering the actual knowledge, the linkage between sulfur and nitrogen chemistry through pernitric reactivity in aqueous phase can bring a possible explanation of the discrepancy between models and observations that is found in winter in sulfate aerosol concentrations, which are actually underestimated in global models [IPCC, 2001].
Acknowledgments. This work was supported by the “Programme National de Chimie Atmosphérique” (PNCA) of the INSU (Institut des Sciences de l'Univers). Computer resources were provided by I.D.R.I.S (Institut du développement et des Ressources en Informatiques Scientifique), project n°000187. The first author is very grateful to Agence de l’Environnement et de la Maîtrise de l’Energie (ADEME) and to Electricité de France (EDF), who financed this work. The authors would like to thank Professor Horst Elias for his help on the reactivity of pernitric acid with the sulfite ion measured by his team.
References
Amels, P., H. Elias, U. Götz, U. Steinges, and K.J. Wannowius, Kinetic investigation of the stability of peroxonitric acid and of its reaction with sulfur(IV) in aqueous solution, in: Heterogeneous and Liquid Phase Processes, Vol2 of Transport and Chemical Transformation of Pollutants in the Troposphere, edited by P. Warneck, pp. 77-88, Springer, Berlin, 1996.
Atkinson, R., D.L. Baulch, R.A. Cox, R.F. Jr Hampson, J.A. Ker, M.J. Rossi, and J. Troe, Evaluated kinetic and photochemical data for atmospheric chemistry: Supplement V. IUPAC subcommittee on gas kinetic data evaluation for atmospheric chemistry, Atmos.
Environ., 30(22), 3903-3904, 1996.
Barker, G.C., P. Fowles, and B. Stringer, Pulse radiolytic induced transient electrical conductance in liquid solutions of NO3-, NO2-,
and Fe(CN)6
3-, Trans. Faraday Soc.3-, 663-, 1509-15193-, 1970.
Barrie, L.A., Y. Yi, W.R. Leaitch, U. Lohmann, P. Kasibhatla, G.-J. Roelofs, J. Wilson, F. McGovern, C. Benkovitz, M.A. Mélières, K. Law, J. Prospero, M. Kritz, D. Bergmann, C. Bridgeman, M. Chin, D. Koch, and P. Rasch, A comparison of large-scale atmospheric sulphate aerosol models (COSAM): Overview and highlights, Tellus, 53B, 615-645, 2001.
Berry, E.X. and R.L. Reinhardt, An analysis of cloud drops growth by collection: Part I. Double distributions, J. Atmos. Sci., 31, 1814-1824, 1974a.
Berry, E.X. and R.L. Reinhardt, An analysis of cloud drop growth by collection: Part II. Single initial distributions, J. Atmos. Sci., 31, 1825-1831, 1974b.
Berry, E.X. and R.L. Reinhardt, An analysis of cloud drop growth by collection: Part III. Accretion and self-collection, J. Atmos. Sci.,
31, 2118-2126, 1974c.
Berry, E.X. and R.L. Reinhardt, An analysis of cloud drop growth by collection: Part IV. A new parameterization, J. Atmos. Sci., 31, 2127-2135, 1974d.
Bielski B.H.J., D.E. Cabelli, R.L. Arudi, and A.B. Ross, Reactivity of HO2/O2
in aqueous solution, J. Phys. Chem. Ref. Data, 14, 1041-1100, 1985.
Buxton, G.V., N.D. Wood, and (in part) S. Dyster, Ionisation constants of OH and HO2 in aqueous solution, J. Chem. Soc. Faraday Trans., 84(4), 1113-1121, 1988.
Buxton, G.V., S. McGowan, G.A. Salmon, J.E. Williams, and N.D. Wood, A study of the spectra and reactivity of oxysulphur radical anions involved in the chain oxidation of S(IV): a pulse and gamma-radiolysis study, Atmos. Environ., 30, 2483-2493, 1996. Chin, M., D.L. Savoie, B.J. Huebert, A.R. Bandy, D.C. Thornton, T.S. Bates, P.K. Quinn, E.S. Saltzman, and W.J. De Bruyn,
Atmospheric sulfur cycle simulated in the global model GOCART: Comparison with field observations and regional budgets, J.
Geophys. Res., 105(D20), 24689-24712, 2000.
Christensen, H,. and K. Sehested, HO2 and O2- radicals at elevated temperatures, J. Phys. Chem., 92, 3007-3011, 1988.
CIME Special Issue, Atmos. Res., 58(4), 229-230, 2001.
Clegg, S.L., and P. Brimblecombe, Solubility of volatile electrolytes in multicomponent solutions with atmospheric application, ACS
Symposium series, 416, pp. 58-73, 1990.
Cotton, F.A., and G. Wilkinson, Advanced Inorganic Chemistry, 4th ed., John Wiley, New York, 1980.
Dentener, F., J. Williams, and S. Metzger, Aqueous phase reaction of HNO4: The impact on tropospheric chemistry, J. Atmos. Chem., 41, 109-134, 2002.
Drexler, C., H. Elias, B. Fecher and K.J. Wannowius, Kinetic investigation of sulfur(IV) oxidation by peroxo compounds R-OOH in aqueous solution, Fresenuis J. Anal. Chem., 340, 605-615, 1991.
Eigen, M., W. Krause, G. Maass, and L. Demaeyer, Rate constants of photolytic reactions in aqueous solution, in Progress in Reaction
Kinetics, vol. 2, edited by G. Porter, chap. 6, pp. 285-318, Macmillan, New York, 1964.
Facchini, M.C., Clouds, atmospheric chemistry and climate, IGAC Activities Newsletter, 26, 13-19, 2002.
Feichter, J., E. Kjellström, H. Rodhe, F. Dentener, J. Lelieveld, and G.-J. Roelofs, Simulation of the tropospheric sulfur cycle in a global climate model, Atmos. Environ., 30(10/11), 1693-1707, 1996.
George, C., and J.-M. Chovelon, A laser flash photolysis study of the decay of SO4- and Cl2- radical anions in the presence of Cl- in
aqueous solutions, Chemosphere, 47, 385-393, 2002.
Goldstein, S., and G. Czapski, Reactivity of peroxynitric acid (O2NOOH): A pulse radiolysis study, Inorg. Chem., 36, 4156-4162,
1997.
Götz, U., Kinetische Untersuchung von Reaktionen der Peroxosalpetersäure in wäßriger Lösung, PhD Thesis, Technische Hochschule Darmstadt, Germany, 1996.
Grigor’ev, A.E., I.E. Makarov, and A.K. Pikaev, Formation of Cl2
in the bulk solution during the radiolysis of concentrated aqueous solutions of chloride, High Energy Chem., 21, 99, 1987.
Hanson, D.R., J.B. Burkholder, C.J. Howard, and A.R. Ravishankara, Measurements of OH and HO2 radical uptake coefficients on
water and sulfuric acid surfaces, J. Phys. Chem., 96, 4979-4985, 1992.
Herrmann, H., H.–W. Jacobi, G. Raabe, A. Reese, and R. Zellner, Laboratory studies of free radicals reactions with tropospheric aqueous phase constituents, in Air Pollution Report 57: Homogeneous and heterogeneous chemical processes in the troposphere, edited by Ph. Mirabel, pp. 90-95, Office for official Publications of the European Communities, Luxembourg, 1996.
Herrmann, H. and R. Zellner, Reactions of NO3 radical in aqueous solutions, in: N-Centered Radicals, edited by Z. B. Alfassi, John
Wiley and Sons, Ltd, 1998.
Herrmann, H., B. Ervens, H.–W. Jacobi, R. Wolke, P. Nowacki, and R. Zellner, CAPRAM2.3: A chemical aqueous radical mechanism for tropospheric chemistry, J. Atmos. Chem., 36(3), 231-284, 2000.
Herrmann, H., B. Ervens, and D. Weise, Sulfur chemistry in clouds, IGAC Activities Newsletter, 23, 6-9, 2001. Hesper, J., and H. Herrmann, personal communication, 2002.
Huret, N., N. Chaumerliac, H. Isaka, and E.C. Nickerson, Influence of different microphysical schemes on the prediction of dissolution of nonreactive gases by cloud droplets and raindrops, J. Applied Meteor., 33(9), 1096-1109, 1994.
Jacob, D.J., Chemistry of OH in remote clouds and its role in the production of formic acid and peroxymonosulfate, J. Geophys. Res.,
91, 9807-9826, 1986.
Jacobi, H.-W., Kinetische untersuchungen und modellrechnungen zur troposphärischen chemie von radikalanionen und ozon in wäβriger phase, Ph.D. Thesis, University GH-Essen, Germany, 1996.
Leriche M., D. Voisin, D., N. Chaumerliac, A. Monod, and B. Aumont, A model for tropospheric multiphase chemistry: application to one cloudy event during the CIME experiment, Atmos. Environ., 34(29/30), 5015-5036, 2000.
Leriche, M., N. Chaumerliac and A. Monod, Coupling quasi-spectral microphysics with multiphase chemistry: A case study of a polluted air mass at the top of the Puy de Dôme mountain (France), Atmos. Environ., 35(32), 5411-5423, 2001.
Maahs, H.G., Sulfur dioxide / water equilibrium between 0 degrees and 50 degrees Celsius, and examination of data at low concentrations, In Heterogenous Atmospheric Chemistry, Geophysical Monograph Series, Vol. 6, edited by D. R. Schryer, pp. 187-195, American Geophysical Union, Washington DC., 1982.
Madronich, S. and J.G. Calvert, The NCAR Master Mechanism of the gas phase chemistry, NCAR technical Note, TN-333+SRT, Boulder Colorado, 1990.
Neta, P., R. E. Huie, and A. B. Ross, Rate constant for reactions of peroxy radicals in fluid solutions, J. Phys. Chem. Ref. Data, 100, 3241-3247, 1990.
Noone, K.J., R.J. Charlson, D.S. Covert, J.A. Ogren and J. Heintzenberg, Design and calibration of a counterflow virtual impactor for sampling of atmospheric fog and cloud droplets, Aerosol Sci. Technol., 8, 235-244, 1988.
Park, J.Y., and Y.–N. Lee, Solubility and decomposition kinetics of nitrous acid in aqueous solution, J. Phys. Chem., 92, 6294-6302, 1988.
Raabe, G., Eine laserphotolytische studie zur kinetik der reaktionen des NO3 radicals in wäβriger lösung, Cuvillier, Göttingen,
Germany, 1996.
Reese, A., UV/VIS-spektrometrische und kinetische untersuchungen von radikalen Sox- (x=3, 4, 5) in wäβriger lösung, Ph.D. Thesis, University Essen, Germany, 1997.
Rudich, Y., R. K. Talukdar, A. R. Ravishankara, and R. W. Fox, Reactive uptake of NO3 on pure water and ionic solutions, J.
Geophys. Res., 101(D15), 21023, 1996.
Schwartz, S.E. and W. H. White, Kinetics of reactive dissolution of nitrogen oxides into aqueous solution, Adv. Environm. Sci.
Technol., 12, 1-115, 1983.
Schwartz, S.E., Mass-transport considerations pertinent to aqueous phase reactions of gases in liquid water clouds, in Chemistry of
multiphase atmospheric systems, NATO ASI Series, vol. G6, edited by W. Jaeschke, pp. 415-472, Spinger, Berlin, 1986.
Sehested, K., J. Holcman, and E.J. Hart, Rate constants and products of the reactions of e-aq, O2
-, and H with ozone in aqueous solutions, J. Phys. Chem., 87(11), 1951-1954, 1983.
Sehested, K., J. Holcman, E. Bjerbakke, and E.J. Hart, A pulse radiolytic study of the reaction OH + O3 in aqueous medium, J. Phys. Chem., 88, 4144-4147, 1984.
Voisin, D., M. Legrand, and N. Chaumerliac, Investigations of the scavenging of acidic gases and ammonia in mixed liquid solid water clouds at the Puy de Dôme mountain (France), J. Geophys. Res., 105(D5), 6817-6836, 2000.
Warneck, P., Chemistry of the Natural Atmosphere, Second Edition, International Geophysics Series, vol. 71, edited by R. Dmowska, J.R. Holton, and H.T. Rossby, 927 pp., Academic Press, INC., 2000.
Williams, J.E., F.J. Dentener, and A.R. van den Berg, The influence of cloud chemistry on HOx and NOx in the moderately polluted
Figure 1. Schematic diagram of reactive gases distribution among different cloud phases by microphysical
processes.
Figure 2. Chemical production of nitric acid (a) and sulfate (b) through the main chemical reactions in the
gas phase, in the cloud phase and in the rain phase for two simulations: with and without microphysical conversions.
Figure 3. Same as Figure 2 but with an initial NOx concentration divided by 50.
Figure 4. Schematic representation of the sulfite ion and pernitric acid sources in cloud water and in
rainwater, percentages of contribution in the total production (+) or destruction (-) are indicated.
Figure 5. Relative contribution pathways to the total production of nitric acid (a) and sulfate (b) for three
simulations: the reaction constant of A69 is divided by 10, the reference simulation (A69) and the reaction constant of A69 is multiplied by 10. The total production is indicated for each case.
Figure 6. Comparison between the partitioning q factor measured by Voisin et al. [2000] and the simulated
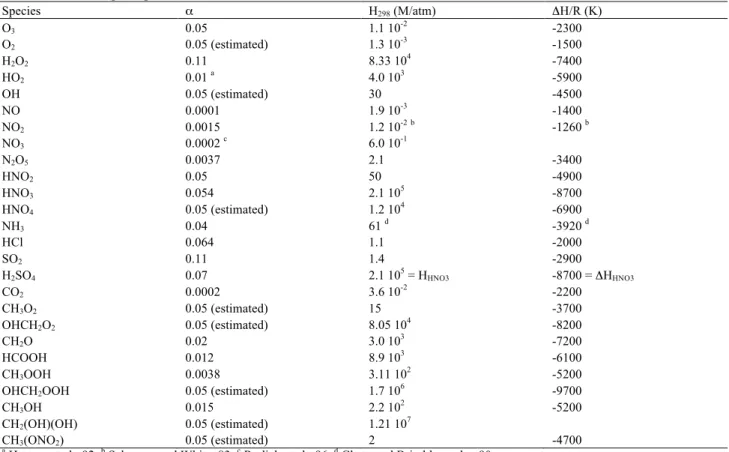
Table 1. Values of mass accommodation coefficients and Henry’s law constants. Only new references for updated values
after Leriche et al. [2000] are indicated.
Species α H298 (M/atm) ΔH/R (K) O3 0.05 1.1 10 -2 -2300 O2 0.05 (estimated) 1.3 10 -3 -1500 H2O2 0.11 8.33 104 -7400 HO2 0.01 a 4.0 103 -5900 OH 0.05 (estimated) 30 -4500 NO 0.0001 1.9 10-3 -1400 NO2 0.0015 1.2 10 -2b -1260 b NO3 0.0002 c 6.0 10-1 N2O5 0.0037 2.1 -3400 HNO2 0.05 50 -4900 HNO3 0.054 2.1 105 -8700 HNO4 0.05 (estimated) 1.2 10 4 -6900 NH3 0.04 61 d -3920 d HCl 0.064 1.1 -2000 SO2 0.11 1.4 -2900 H2SO4 0.07 2.1 10 5 = HHNO3 -8700 = ΔHHNO3 CO2 0.0002 3.6 10-2 -2200 CH3O2 0.05 (estimated) 15 -3700 OHCH2O2 0.05 (estimated) 8.05 10 4 -8200 CH2O 0.02 3.0 10 3 -7200 HCOOH 0.012 8.9 103 -6100 CH3OOH 0.0038 3.11 10 2 -5200
OHCH2OOH 0.05 (estimated) 1.7 106 -9700
CH3OH 0.015 2.2 10 2 -5200 CH2(OH)(OH) 0.05 (estimated) 1.21 10 7 CH3(ONO2) 0.05 (estimated) 2 -4700 a
Hanson et al., 92. b Schwartz and White, 83. c Rudich et al., 96. d Clegg and Brimblecombe, 90.
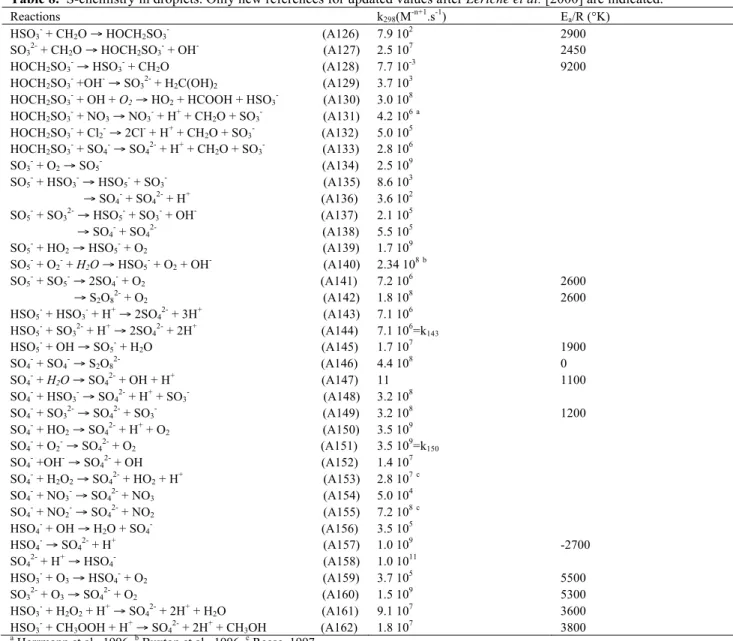
Table 2. Aqueous phase equilibrium. Only new references for updated values after Leriche et al. [2000] are indicated.
Equilibrium K (M) ΔH/R (K) CO2 + H2O ⇔ H + + HCO3 -4.2 10-7 HCO3- ⇔ H+ + CO32- 4.8 10-11 SO2 + H2O ⇔ H+ + HSO3- 1.3 10-2 a -2130 a HSO3 ⇔ H+ + SO3 2-6.4 10-8 a -1460 a H2SO4 ⇔ H+ + HSO4- 1.0 103 b HSO4 ⇔ H+ + SO4 2-1.0 10-2 c HNO3 ⇔ H + + NO3 -2.2 101 HO2 ⇔ H+ + O2- 1.6 10-5 d HCOOH ⇔ H+ + HCOO- 1.8 10-4 150 H2O2 ⇔ H + + HO2 -2.2 10-12 -3730 HNO2 ⇔ H+ + NO2- 5.3 10-4 e 1760 e HNO4 ⇔ H + + NO4 -1.26 10-6 f CH2O + H2O ⇔ CH2(OH)2 2.5 10 3 g -4030 HCl ⇔ H+ + Cl- 1.7 106 -6890 NH3 + H2O ⇔ NH4+ + OH- 1.7 10-5 4320 a
Maahs, 1982. b Cotton and Wilkinson, 1980. c Eigen et al., 1964. d Bielski et al., 1985. e Park and Lee, 1988. f Goldstein and Czapski, 1997. g K without unity.
Table 3. HOx chemistry in droplets. Only new references for updated values after Leriche et al. [2000] are indicated. New
reactions are indicated by (AN) instead of (A).
Reactions k298(M-n+1.s-1) Ea/R (°K)
O3 + hν + H2O → H2O2 + O2 (A1) calculated
H2O2 + hν → 2OH (A2) calculated
OH + O3 → O2 + HO2 (AN3) 1.0 10 8 a OH + HO2 → H2O + O2 (A4) 2.8 1010 0 OH + O2 → HO- + O2 (A5) 3.5 10 10 720 H2O2 + OH → H2O + HO2 (A6) 2.7 107 1700 HO2 + HO2 → H2O2 + O2 (A7) 8.3 10 5 b 2700 b HO2 + O2- + H2O → H2O2 + O2 +OH- (A8) 9.6 107 c 910 c O3 + HO2 → OH + 2O2 (A9) <1.0 10 4 O3 + O2- + H2O → OH + 2O2 + OH- (A10) 1.6 109 d 2200 d OH + HSO3 → SO3 + H2O (A11) 2.7 10 9 OH + SO32- → SO3- + OH- (A12) 4.6 109 a
Sehested et al.,1984. b Bielski et al., 1985. c Christensen et Sehested, 1988. d Hesper and Herrmann, 2002.
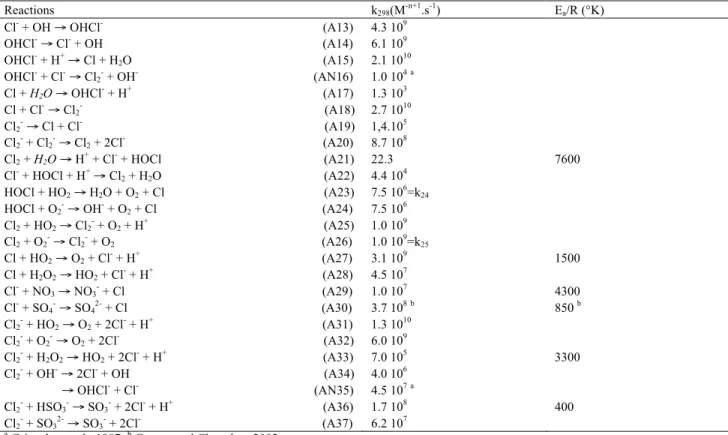
Table 4. Chlorine chemistry in droplets. Only new references for updated values after Leriche et al. [2000] are indicated.
New reactions are indicated by (AN) instead of (A).
Reactions k298(M -n+1 .s-1) Ea/R (°K) Cl- + OH → OHCl- (A13) 4.3 109 OHCl- → Cl- + OH (A14) 6.1 109 OHCl- + H+ → Cl + H2O (A15) 2.1 10 10 OHCl- + Cl- → Cl 2- + OH- (AN16) 1.0 104a Cl + H2O → OHCl + H+ (A17) 1.3 103 Cl + Cl- → Cl2- (A18) 2.7 1010 Cl2 → Cl + Cl- (A19) 1,4.105 Cl2 + Cl2 → Cl2 + 2Cl (A20) 8.7 108 Cl2 + H2O → H + + Cl- + HOCl (A21) 22.3 7600 Cl- + HOCl + H+ → Cl 2 + H2O (A22) 4.4 104 HOCl + HO2 → H2O + O2 + Cl (A23) 7.5 10 6 =k24 HOCl + O2- → OH- + O2 + Cl (A24) 7.5 106 Cl2 + HO2 → Cl2 + O2 + H + (A25) 1.0 109 Cl2 + O2 → Cl2 + O2 (A26) 1.0 10 9 =k25 Cl + HO2 → O2 + Cl + H+ (A27) 3.1 109 1500 Cl + H2O2 → HO2 + Cl- + H+ (A28) 4.5 107 Cl- + NO3 → NO3 + Cl (A29) 1.0 107 4300 Cl- + SO4- → SO42- + Cl (A30) 3.7 108b 850 b Cl2 + HO2 → O2 + 2Cl + H+ (A31) 1.3 1010 Cl2 + O2 → O2 + 2Cl (A32) 6.0 109 Cl2 + H2O2 → HO2 + 2Cl + H+ (A33) 7.0 105 3300 Cl2- + OH- → 2Cl- + OH (A34) → OHCl- + Cl- (AN35) 4.0 106 4.5 107a Cl2- + HSO3- → SO3- + 2Cl- + H+ (A36) 1.7 108 400 Cl2 + SO3 → SO3 + 2Cl- (A37) 6.2 107 a
Table 5. Carbonate chemistry in droplets. Only new references for updated values after Leriche et al. [2000] are indicated.
New reactions are indicated by (AN) instead of (A).
Reactions k298(M-n+1.s-1) Ea/R (°K) HCO3 + OH → H2O + CO3 (A38) 1.7 107 1900 CO32- + OH → OH- + CO3- (A39) 4.2 108a 2840 a HCO3 + O2 → HO2 + CO3 (A40) 1.5 106 HCO3- + NO3 → NO3- + CO3- + H+ (AN41) 4.1 107=k42 CO3 + NO3 → NO3 + CO3 (A42) 4.1 107 HCO3- + Cl2- → 2Cl- + CO3- + H+ (AN43) 2.7 106=k44 CO3 + Cl2 → 2Cl- + CO3 (A44) 2.7 106 HCO3- + SO4- → SO42- + H+ + CO3- (A45) 2.8 106 2100 CO3 + SO4 → SO4 + CO3 (A46) 4.1 106 3200 CO3- + CO3- + O2 → 2O2- + 2CO2 (A47) 2.2 106 CO3 + O3 → CO2 + O2 +O2 (AN48) 1.0 10 5b CO3- + HO2 → HCO3- + O2 (A49) 6.5 108=k50 CO3 + O2 → CO3 + O2 (A50) 6.5 10 8 CO3- + H2O2 → HO2 + HCO3- (A51) 4.3 105 CO3 + HSO3 → HCO3 + SO3 (A52) 1.0 107 CO3- + SO32- → CO32- + SO3- (A53) 2.9 107 470 a Buxton et al., 1988. b Sehested et al., 1983.
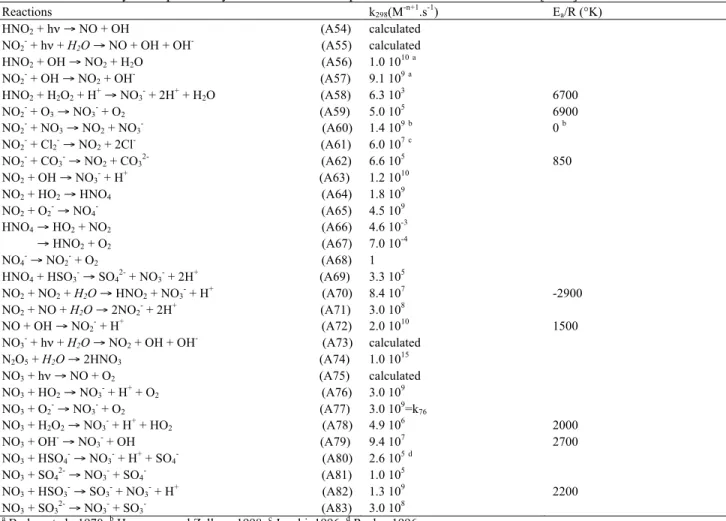
Table 6. N-chemistry in droplets. Only new references for updated values after Leriche et al. [2000] are indicated.
Reactions k298(M-n+1.s-1) Ea/R (°K)
HNO2 + hν → NO + OH (A54) calculated
NO2 + hν + H2O → NO + OH + OH (A55) calculated HNO2 + OH → NO2 + H2O (A56) 1.0 1010a NO2 + OH → NO2 + OH (A57) 9.1 109a HNO2 + H2O2 + H+ → NO3- + 2H+ + H2O (A58) 6.3 103 6700 NO2 + O3 → NO3 + O2 (A59) 5.0 10 5 6900 NO2- + NO3 → NO2 + NO3- (A60) 1.4 109b 0 b NO2 + Cl2 → NO2 + 2Cl (A61) 6.0 107c NO2- + CO3- → NO2 + CO32- (A62) 6.6 105 850 NO2 + OH → NO3 + H+ (A63) 1.2 1010 NO2 + HO2 → HNO4 (A64) 1.8 109 NO2 + O2 → NO4 (A65) 4.5 109 HNO4 → HO2 + NO2 (A66) → HNO2 + O2 (A67) 4.6 10-3 7.0 10-4 NO4- → NO2- + O2 (A68) 1 HNO4 + HSO3 → SO4 + NO3 + 2H+ (A69) 3.3 105 NO2 + NO2 + H2O → HNO2 + NO3- + H+ (A70) 8.4 107 -2900 NO2 + NO + H2O → 2NO2 + 2H+ (A71) 3.0 108 NO + OH → NO2- + H+ (A72) 2.0 1010 1500 NO3 + hν + H2O → NO2 + OH + OH (A73) calculated N2O5 + H2O → 2HNO3 (A74) 1.0 1015 NO3 + hν → NO + O2 (A75) calculated NO3 + HO2 → NO3- + H+ + O2 (A76) 3.0 109 NO3 + O2 → NO3 + O2 (A77) 3.0 10 9 =k76 NO3 + H2O2 → NO3- + H+ + HO2 (A78) 4.9 106 2000 NO3 + OH → NO3 + OH (A79) 9.4 107 2700 NO3 + HSO4- → NO3- + H+ + SO4- (A80) 2.6 105d NO3 + SO4 → NO3 + SO4 (A81) 1.0 105 NO3 + HSO3- → SO3- + NO3- + H+ (A82) 1.3 109 2200 NO3 + SO3 → NO3 + SO3 (A83) 3.0 108
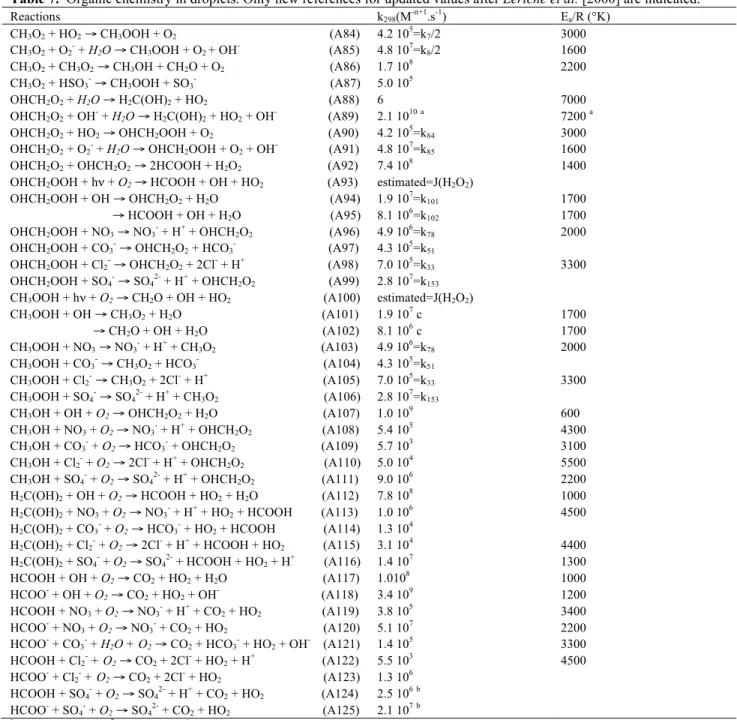
Table 7. Organic chemistry in droplets. Only new references for updated values after Leriche et al. [2000] are indicated. Reactions k298(M-n+1.s-1) Ea/R (°K) CH3O2 + HO2 → CH3OOH + O2 (A84) 4.2 105=k7/2 3000 CH3O2 + O2 + H2O → CH3OOH + O2 + OH (A85) 4.8 107=k8/2 1600 CH3O2 + CH3O2 → CH3OH + CH2O + O2 (A86) 1.7 108 2200 CH3O2 + HSO3 → CH3OOH + SO3 (A87) 5.0 105
OHCH2O2 + H2O → H2C(OH)2 + HO2 (A88) 6 7000
OHCH2O2 + OH
+ H2O → H2C(OH)2 + HO2 + OH
(A89) 2.1 1010a 7200 a OHCH2O2 + HO2 → OHCH2OOH + O2 (A90) 4.2 105=k84 3000
OHCH2O2 + O2
+ H2O → OHCH2OOH + O2 + OH
(A91) 4.8 107=k85 1600
OHCH2O2 + OHCH2O2 → 2HCOOH + H2O2 (A92) 7.4 108 1400
OHCH2OOH + hν + O2 → HCOOH + OH + HO2 (A93) estimated=J(H2O2)
OHCH2OOH + OH → OHCH2O2 + H2O (A94)
→ HCOOH + OH + H2O (A95)
1.9 107=k101
8.1 106=k102
1700 1700 OHCH2OOH + NO3 → NO3- + H+ + OHCH2O2 (A96) 4.9 106=k78 2000
OHCH2OOH + CO3
→ OHCH2O2 + HCO3
(A97) 4.3 105=k51
OHCH2OOH + Cl2- → OHCH2O2 + 2Cl- + H+ (A98) 7.0 105=k33 3300
OHCH2OOH + SO4 → SO4 + H+ + OHCH2O2 (A99) 2.8 10 7 =k153
CH3OOH + hν + O2 → CH2O + OH + HO2 (A100) estimated=J(H2O2)
CH3OOH + OH → CH3O2 + H2O (A101) → CH2O + OH + H2O (A102) 1.9 107 c 8.1 106 c 1700 1700 CH3OOH + NO3 → NO3 + H+ + CH3O2 (A103) 4.9 10 6 =k78 2000
CH3OOH + CO3- → CH3O2 + HCO3- (A104) 4.3 105=k51
CH3OOH + Cl2 → CH3O2 + 2Cl + H+ (A105) 7.0 105=k33 3300 CH3OOH + SO4- → SO42- + H+ + CH3O2 (A106) 2.8 107=k153 CH3OH + OH + O2 → OHCH2O2 + H2O (A107) 1.0 10 9 600 CH3OH + NO3 + O2 → NO3- + H+ + OHCH2O2 (A108) 5.4 105 4300 CH3OH + CO3 + O2 → HCO3 + OHCH2O2 (A109) 5.7 10 3 3100 CH3OH + Cl2- + O2 → 2Cl- + H+ + OHCH2O2 (A110) 5.0 104 5500 CH3OH + SO4 + O2 → SO4 + H+ + OHCH2O2 (A111) 9.0 10 6 2200 H2C(OH)2 + OH + O2 → HCOOH + HO2 + H2O (A112) 7.8 108 1000
H2C(OH)2 + NO3 + O2 → NO3
+ H+ + HO2 + HCOOH (A113) 1.0 10 6
4500 H2C(OH)2 + CO3- + O2 → HCO3- + HO2 + HCOOH (A114) 1.3 104
H2C(OH)2 + Cl2 + O2 → 2Cl + H+ + HCOOH + HO2 (A115) 3.1 10 4 4400 H2C(OH)2 + SO4- + O2 → SO42- + HCOOH + HO2 + H+ (A116) 1.4 107 1300
HCOOH + OH + O2 → CO2 + HO2 + H2O (A117) 1.010 8 1000 HCOO- + OH + O2 → CO2 + HO2 + OH- (A118) 3.4 109 1200 HCOOH + NO3 + O2 → NO3 + H+ + CO2 + HO2 (A119) 3.8 10 5 3400 HCOO- + NO3 + O2 → NO3- + CO2 + HO2 (A120) 5.1 107 2200 HCOO- + CO3 + H2O + O2 → CO2 + HCO3 + HO2 + OH (A121) 1.4 105 3300 HCOOH + Cl2- + O2 → CO2 + 2Cl- + HO2 + H+ (A122) 5.5 103 4500 HCOO- + Cl2 + O2 → CO2 + 2Cl + HO2 (A123) 1.3 10 6 HCOOH + SO4- + O2 → SO42- + H+ + CO2 + HO2 (A124) 2.5 106b HCOO- + SO4 + O2 → SO4 + CO2 + HO2 (A125) 2.1 10 7b a
Neta et al., 1990. b Reese, 1997.c Estimated from kinetic constant of aqueous phase reaction H2O2 + OH and the branching ratio of
Table 8. S-chemistry in droplets. Only new references for updated values after Leriche et al. [2000] are indicated.
Reactions k298(M-n+1.s-1) Ea/R (°K)
HSO3- + CH2O → HOCH2SO3- (A126) 7.9 102 2900
SO3
+ CH2O → HOCH2SO3
+ OH- (A127) 2.5 107 2450 HOCH2SO3- → HSO3- + CH2O (A128) 7.7 10-3 9200
HOCH2SO3 +OH- → SO3 + H2C(OH)2 (A129) 3.7 10 3
HOCH2SO3- + OH + O2 → HO2 + HCOOH + HSO3- (A130) 3.0 108
HOCH2SO3 + NO3 → NO3 + H+ + CH2O + SO3 (A131) 4.2 106a HOCH2SO3- + Cl2- → 2Cl- + H+ + CH2O + SO3- (A132) 5.0 105 HOCH2SO3 + SO4 → SO4 + H+ + CH2O + SO3 (A133) 2.8 106 SO3- + O2 → SO5- (A134) 2.5 109 SO5 + HSO3 → HSO5 + SO3 (A135) → SO4- + SO42- + H+ (A136) 8.6 103 3.6 102 SO5 + SO3 → HSO5 + SO3 + OH- (A137) → SO4- + SO42- (A138) 2.1 105 5.5 105 SO5 + HO2 → HSO5 + O2 (A139) 1.7 10 9 SO5- + O2- + H2O → HSO5- + O2 + OH- (A140) 2.34 108b SO5 + SO5 → 2SO4 + O2 (A141) → S2O82- + O2 (A142) 7.2 106 1.8 108 2600 2600 HSO5 + HSO3 + H+ → 2SO4 + 3H+ (A143) 7.1 106 HSO5- + SO32- + H+ → 2SO42- + 2H+ (A144) 7.1 106=k143
HSO5 + OH → SO5 + H2O (A145) 1.7 10 7 1900 SO4- + SO4- → S2O82- (A146) 4.4 108 0 SO4 + H2O → SO4 + OH + H+ (A147) 11 1100 SO4- + HSO3- → SO42- + H+ + SO3- (A148) 3.2 108 SO4 + SO3 → SO4 + SO3 (A149) 3.2 108 1200 SO4- + HO2 → SO42- + H+ + O2 (A150) 3.5 109 SO4 + O2 → SO4 + O2 (A151) 3.5 10 9 =k150 SO4- +OH- → SO42- + OH (A152) 1.4 107 SO4 + H2O2 → SO4 + HO2 + H + (A153) 2.8 107c SO4- + NO3- → SO42- + NO3 (A154) 5.0 104 SO4 + NO2 → SO4 + NO2 (A155) 7.2 10 8c HSO4- + OH → H2O + SO4- (A156) 3.5 105 HSO4 → SO4 + H+ (A157) 1.0 109 -2700 SO42- + H+ → HSO4- (A158) 1.0 1011 HSO3 + O3 → HSO4 + O2 (A159) 3.7 10 5 5500 SO32- + O3 → SO42- + O2 (A160) 1.5 109 5300 HSO3 + H2O2 + H + → SO4 + 2H+ + H2O (A161) 9.1 10 7 3600 HSO3- + CH3OOH + H+ → SO42- + 2H+ + CH3OH (A162) 1.8 107 3800 a
Cloud water
Rainwater
Evaporation Evaporation Sedimentation Self-collection Autoconversion AccretionHNO4 + HSO3-, cloud HNO4 + HSO3-, rain Total production
without microphysics with microphysics without microphysics with microphysics
a)
b)
0 0.2 0.4 0.6 0.8 C he m ic al n it ri c ac id p ro d u ct io n ( p p b v h -1) OH + NO2, gas N2O5, cloud N2O5, rain 0 0.1 0.2 0.3 0.4 0.5 C he m ic al s ul fa te p ro d u ct io n ( p p b v h -1)H2O2 + HSO3-, cloud H2O2 + HSO3-, rain
HNO4 + HSO3-, cloud HNO4 + HSO3-, rain Total production 0 0.04 0.08 0.12 C he m ic al n it ri c ac id p ro d u ct io n ( p p b v h -1) OH + NO2, gas 0 0.1 0.2 0.3 0.4 C he m ic al s u lf at e p ro d u ct io n ( p p b v h -1)
H2O2 + HSO3-, cloud H2O2 + HSO3-, rain
without microphysics, NOx/50 with microphysics, NOx/50 with microphysics, NOx/50 without microphysics, NOx/50