HAL Id: hal-02873081
https://hal.archives-ouvertes.fr/hal-02873081
Submitted on 18 Jun 2020HAL is a multi-disciplinary open access
archive for the deposit and dissemination of sci-entific research documents, whether they are pub-lished or not. The documents may come from teaching and research institutions in France or abroad, or from public or private research centers.
L’archive ouverte pluridisciplinaire HAL, est destinée au dépôt et à la diffusion de documents scientifiques de niveau recherche, publiés ou non, émanant des établissements d’enseignement et de recherche français ou étrangers, des laboratoires publics ou privés.
Mud Flow Levitation on Mars: Insights from Laboratory
Simulations
Petr Brož, O. Krýza, S.J. Conway, N.T. Mueller, E. Hauber, A. Mazzini, J.
Raack, M.R. Balme, M.E. Sylvest, M.R. Patel
To cite this version:
Petr Brož, O. Krýza, S.J. Conway, N.T. Mueller, E. Hauber, et al.. Mud Flow Levitation on Mars: Insights from Laboratory Simulations. Earth and Planetary Science Letters, Elsevier, 2020, 545, pp.116406. �10.1016/j.epsl.2020.116406�. �hal-02873081�
Mud Flow Levitation on Mars: Insights from Laboratory Simulations
1P. Brož1*, O. Krýza1, S. J. Conway2, N. T. Mueller3, E. Hauber3, A. Mazzini4, J. Raack5, M.R. Balme6,
2
M.E. Sylvest6 and M. R. Patel6,7
3
1Institute of Geophysics of the Czech Academy of Sciences, Boční II/1401, 141 31, Prague, Czech
4
Republic 5
2 CNRS UMR-6112 Laboratoire de Planétologie et Géodynamique, Université de Nantes, France
6
3Institute of Planetary Research, DLR, Rutherfordstr. 2, 12489, Berlin, Germany
7
4Centre for Earth Evolution and Dynamics (CEED), University of Oslo, Norway
8
5Institut für Planetologie, Westfälische Wilhelms-Universität Münster, Germany
9
6School of Physical Science, STEM, The Open University, Milton Keynes, UK Open University, Milton
10
Keynes, United Kingdom 11
7Space Science and Technology Department, STFC Rutherford Apple-ton Laboratory, Oxford, UK
12 13 Corresponding Author 14 Petr Brož 15
Institute of Geophysics of Czech Academy of Sciences (CAS) v.v.i 16 Boční II/1401 17 14131 Prague 4 18 Czech Republic 19 [email protected] 20 +420267103063 21
Abstract
22
Sediment mobilisation occurring at depth and ultimately manifesting at the surface, is a process 23
which may have operated on Mars. However, the propagation behaviour of this mixture of water and 24
sediments (hereafter simply referred to as mud) over the martian surface, remains uncertain. 25
Although most of the martian surface is below freezing today, locally warmer surface temperatures do 26
occur, and our current knowledge suggests that similar conditions prevailed in the recent past. Here, we 27
present the results of experiments performed inside a low pressure chamber to investigate mud 28
propagation over a warm (~295 K) unconsolidated sand surface under martian atmospheric pressure 29
conditions (~7 mbar). Results show that the mud boils while flowing over the warm surface. The gas 30
released during this process can displace the underlying sand particles and hence erode part of the 31
substrate. This “entrenched” flow can act as a platform for further mud propagation over the surface. 32
The escaping gas causes intermittent levitation of the mud resulting in enhanced flow rates. The mud 33
flow morphologies produced by these phenomena differ from those produced when mud flows over 34
a frozen martian surface as well as from their terrestrial counterparts. The intense boiling removes 35
the latent heat both from the mud and the subsurface, meaning that the mud flow would eventually 36
start to freeze and hence changing again the way it propagates. The diverse morphology expressed 37
by our experimental mudflows implies that caution should be exercised when interpreting flow 38
features on the surface of Mars and other celestial bodies. 39
1. Introduction
40
The surface of Mars is characterized by features with various shapes (Fig. 1a,b) ranging from 41
decimetres to kilometres in scale whose origin has been attributed to the action of sedimentary volcanism 42
(e.g., Allen et al., 2013; Hemmi and Miyamoto, 2018; Oehler and Allen, 2012; Pondrelli et al., 2011; 43
Salvatore and Christensen, 2015; Skinner and Mazzini, 2009; Skinner and Tanaka, 2007; Okubo, 2016; 44
Komatsu et al., 2016; Rubin et al., 2017; Brož et al., 2019, Wheatley et al., 2019; Kumar et al., 2019). 45
However, this interpretation is not unanimous, as igneous volcanism has also been proposed as a 46
formation mechanism for several of these features (e.g. Brož and Hauber, 2013; Brož et al., 2017). 47
Regardless of this ambiguity, if sedimentary volcanism (Oehler and Etiope, 2017) has ever been present 48
on Mars, the mud would propagate in an environment significantly different from the terrestrial one, in 49
particular with respect to atmospheric pressure and gravity. 50
Until recently it remained unclear as to whether such different environmental conditions would even 51
allow mud to propagate over the martian surface. This uncertainty was related to the fact that the martian 52
low-pressure environment inhibits the sustained presence of liquid water on the planet’s surface (e.g., 53
Bargery et al., 2010; Hecht, 2002). Previous studies have shown that water would boil and this could 54
significantly affect sediment transportation (Conway et al., 2011; Massé et al., 2016; Raack et al., 2017; 55
Herny et al., 2018). These results suggest that martian environmental conditions may have a profound 56
effect on mud rheology and hence its propagation may vary from our terrestrial experience. 57
On Earth, the effusion rates and volumes of ascending mud vary, and affect the sizes, thicknesses 58
and shapes of mud flows. Low effusion rates lead to the formation of flows a few centimetres-thick 59
capable of propagating up to several meters (Fig. 1c,d,e). In contrast, high effusion rates and volumes 60
may lead to flows metres thick capable of propagating over kilometres. However, the sizes and 61
thicknesses of mud flows strongly depends on its viscosity which is mainly linked to the water content. 62
Water-dominated mud flows have thicknesses varying from metres to centimetres. This is because the 63
flows preferentially spread laterally and therefore their thicknesses decreases towards the margins 64
forming overlapping lobes. 65
While the behaviour of mud during emplacement and its rheology under terrestrial conditions is 66
well studied and understood (e.g., O’Brien and Julien, 1988; Laigle and Coussot, 1997 and references 67
therein), this is not the case for Mars, nor for other planetary bodies within the Solar System, where 68
sedimentary volcanism has also been proposed (e.g., Ruesch et al., 2019). An initial study examining 69
the general behaviour of kilometre-sized mud flows in a low pressure environment was performed 70
by Wilson and Mouginis-Mark (2014), where some aspects of mud propagation over the martian 71
surface were discussed from a theoretical point of view. The authors proposed that the water present 72
in the mud would be unstable and hence evaporate from the mud flow, ultimately removing the latent 73
heat from the mixture. As a consequence, the residual water within mud should freeze in a relatively 74
short period of time, hours to days. Recent insights came from experimental work of Brož et al. (in 75
press) in which the behaviour of low viscosity mud was experimentally studied in a low pressure 76
chamber that partly simulated the environment of Mars. Their work demonstrated that low viscosity 77
mud flows can propagate over a cold (<273 K) surface under martian atmospheric pressure, however, 78
the mechanism of such propagation would be very different from that observed on Earth. On Mars, mud 79
would rapidly freeze due to evaporative cooling (Bargery et al., 2010) forming an icy-crust leading to 80
the propagation of the decimetre thick mud flows resembling pahoehoe lava flows on Earth (Brož et al., 81
in press). 82
The average temperature of the martian surface today is far below the freezing point of water, but 83
thermal infrared observations (e.g. Sinton and Strong, 1960; Kiefer et al., 1977; Christensen et al., 2001) 84
show locally higher temperatures can occur at certain locations at favourable seasonal times (Hecht, 85
2002). This is mainly because the redistribution of solar heat is impeded by the low atmospheric 86
pressure, which limits advective heat transport by the atmosphere, and by the low thermal conductivity 87
of the regolith covering most of the surface (e.g. Presley and Christensen, 1997). Numerical thermal 88
models of the surface have been developed to derive regolith thermophysical properties such as albedo 89
and thermal inertia from the observed temperatures (e.g. Kieffer et al., 1977, Putzig and Mellon, 2007). 90
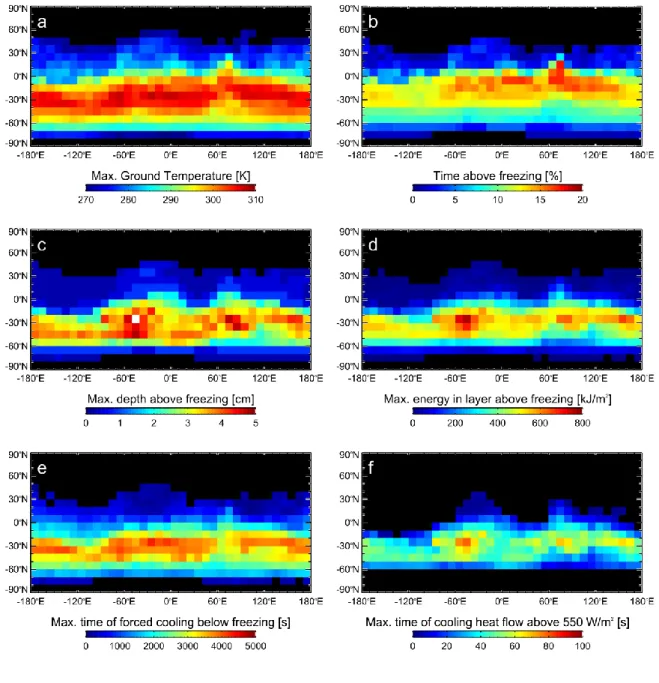
Conversely, we can use such models and the thermophysical properties to calculate the subsurface 91
temperature structure that is consistent with observed temperatures. The results are shown in Fig. 2 and 92
the details of calculations are described below in Section 2.2. Our data show that conditions above 93
freezing are not rare on Mars and that some significant amount of heat can be released to potentially 94
keep a mud flow from freezing. 95
The goal of this manuscript is therefore to investigate the behaviour of low viscosity mud flowing 96
under martian pressure conditions over a warm (from ~292 K to ~296 K) surface. More specifically, we 97
examine how the instability of water within the mud would change its flow behaviour during the phase 98
change from liquid to gaseous. Hence, we aim to reveal which transport processes would be reasonable 99
to expect during sedimentary volcanism on Mars and how they may affect the final morphology of the 100
resulting mud flows. 101
2. Methods
102
2.1. Experimental setup 103
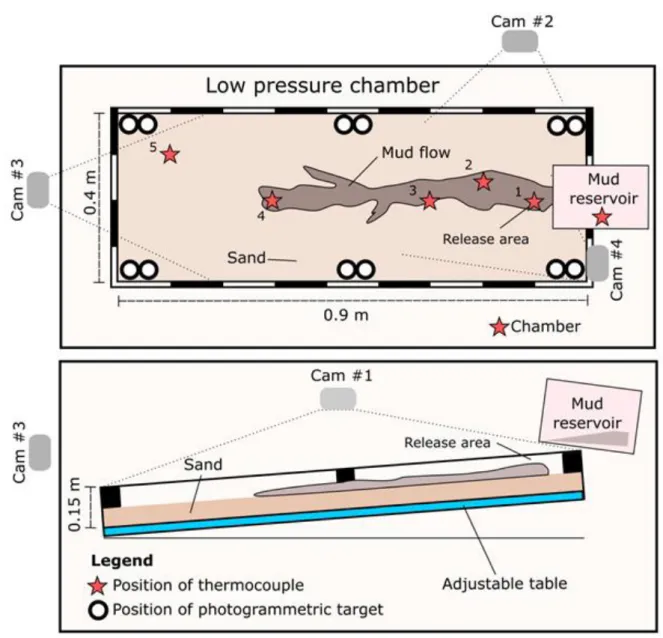
We performed a set of experiments (see Table 1 for details) using the Mars Simulation Chamber at 104
the Open University (UK). The chamber was equipped with a 0.9 × 0.4 m aluminium tray filled with a 105
~2 cm deep sediment bed (natural sand, ~200 µm) together with a reservoir containing 500 ml of low 106
viscosity, and hence water-dominated, mud (12.7 mPa*s at ~276 K and 10.7 mPa*s at ~296 K). The 107
container with the mud hung ~5 cm above the tray (Figure 3). Before depressurisation, the mud and sand 108
were at room temperature (from ~292 K to ~296 K). The tray was inclined by 5° and 10° to force the 109
mud to move under gravity once poured onto the surface. The mud was released from the container 110
under reduced pressure (~7 mbar) and the movement of the mixture was observed and recorded by four 111
cameras from different angles. In some experiments the sand bed was replaced by a smooth plastic plate 112
inclined by 5° to assess if the observed processes were dependent on the presence of unconsolidated and 113
porous material. We also performed comparative experiments under terrestrial pressure to get a 114
reference set of experiments. In an additional experimental setup, a plastic box (0.6 × 0.4 m) filled by a 115
33 cm thick layer of sand was used to investigate the depth to which the mud is able to propagate 116
vertically. Each experiment was performed in triplicate to confirm the reproducibility of the results. 117
The mud used for the experiments was a mixture of deionised water with 0.5% w/w of dissolved 118
magnesium sulphate salts (MgSO4) and clay at ~6.5 % of the mud mass (the mass ratio between
119
deionised water and clay was 4:1). The magnesium sulphate salt, which has previously been detected 120
on the martian surface (Clark, 1978; Vaniman et al., 2004; Hecht et al., 2009), was added to achieve the 121
average river water salinity which is necessary to suspend submillimetre clay particles (Corradi et al., 122
1994). As there is no direct in-situ knowledge of which types of clays could be involved in the subsurface 123
sediment mobilisation on Mars, we decided to use the clay obtained from the claystone named after the 124
Rokle locality situated near the town Kadaň in the Czech Republic and operated by the private company 125
Keramost. This clay is a bentonite composed of 76% montmorillonite, 23% illite, and 1% kaolinite and 126
formed by alteration of pyroclastic rocks. As explosive volcanism was likely common on Mars (e.g., 127
Wilson and Head, 1994), to a first approximation this material is a suitable analogue. The mud mixture 128
was obtained using a blender for 3 minutes to reduce the presence of more lithified clayey aggregates. 129
The average density of the resulting mixture was 1037.5 kg/m3. The viscosity was measured at the
130
Institute of Hydrodynamics of the Czech Academy of Science by using Haake Rotovisco RV 20 and 131
Viscotester VT 550 rheometers with ledges on the MV2 cylinder to prevent slip of the measured material 132
on its walls. 133
2.2. Modelling of Mars surface temperatures 134
To model the subsurface temperature on Mars we used the albedo and thermal inertia maps derived 135
by Putzig and Mellon (2007) from Thermal Emission Spectrometer data (Christensen et al., 2001). 136
Thermal inertia is the square root of the product of thermal conductivity, bulk density, and specific heat 137
capacity. Since the latter two exhibit much less variability in regolith than the former, we assume they 138
are constant. Density is assumed to be 1300 kg/m³ and heat capacity is assumed to be 630 J/kg/K from 139
the numbers recommended for the InSight landing site (Morgan et al., 2018). 140
The variables governing the boundary conditions are Mars’ orbit and spin axis obliquity, as well as 141
atmospheric pressure and dust optical thickness. For our modelling we use the timeseries output of the 142
local surface atmospheric pressure and local dust optical thickness at the 610 Pa pressure level provided 143
by the average climatology scenario of the Mars Climate Database (MCD, Forget et al. 1999, Millour et 144
al. 2017). The database covers the average of TES observations over martian years 24 – 31, with planet 145
encircling dust events excluded (Montabone et al., 2015). We scale the dust opacity to the local 146
atmospheric column by multiplying with the ratio of local pressure to 610 Pa (Montabone et al., 2015). 147
For the calculations of subsurface temperature, we use a 1-D version of the Mars Climate Database 148
MCD, which calculates the downwelling visible and infrared fluxes and solves the heat conduction 149
equation in the subsurface, assuming a zero heat flux lower boundary condition. The calculations are 150
done for 10x10 degree tiles, with each tile having the average surface albedo and thermal inertia, and 151
the average from the surface pressure and dust opacity timelines. The output is generated at intervals of 152
15° of solar longitude and 0.5 h of local solar time for the duration of one Mars year. The results are 153
validated by comparison with version 5.3 of the MCD and found to be consistent within a few Kelvin. 154
This dataset is searched to find the maximum surface temperatures, presented in Fig. 2a. The percentage 155
of the total time of a Mars year when the surface temperatures are above freezing is presented in Fig. 156
2b. The maximum depth of subsurface layer above freezing is shown in Fig. 2c and the maximum heat 157
that can be released from that layer before everything is below freezing in Fig. 2d. 158
3. Observations
159
Once the atmospheric pressure was reduced inside the chamber, the mud in the container started 160
to boil and to cool due to evaporative cooling. The boiling intensified as the pressure was decreased 161
to 12-14 mbar and continued to 7 mbar. When a pressure of ~7 mbar was reached, the mud had a 162
temperature slightly above freezing and was manually released by tipping the container, letting it 163
flow over the ‘warm’ (from ~292 K to ~296 K) sand surface inclined at 5°. The contact of the mud 164
with the warm surface triggered boiling, which caused ejection of sand grains to a height of several 165
centimetres. The particles landed both on the mud and on the surrounding sand. The deposition of 166
the sand grains formed a small raised rim around the contact area resulting in a crater-like depression 167
(Fig. 4, t=10 s). The explosive activity decreased with time. At the beginning, the mud was not visible 168
inside the crater area, as it was covered by a layer of loose sand grains, which was repeatedly 169
disturbed by bubbling (Fig. 4, t=10 s). Within seconds, mud could be observed on the surface – not 170
necessarily at the site where it was directly poured from the container – propagating inside the crater 171
(Fig. 4, t=22 s). At the boundary between the mud and the sand layer, a large number of millimetre-172
scale explosion pits formed, from which gas continued to eject particles for several minutes. This 173
caused a progressive expansion of the rim. 174
Continued mud supply caused the flow to breach the sandy rim and a lobe of mud advanced over 175
the warm sand (Fig. 4, t=22 s). This flow front triggered new explosions as the mud propagated and 176
infiltrated into the surface of the sand. The escape of gas at the base of the mud flow caused the lobe 177
to vibrate vertically and to quickly levitate over the first few centimetres of the sand surface (Fig. 4, 178
t=26 s; Fig. 5a). When boiling was insufficient to lift the entire weight of the mud flow, the flow 179
lobes slid/crept over the surface entraining the sand particles. Then the lobe stalled and small 180
millimetre-scale explosions occurred around its edge forming small ridges. Simultaneously fresh 181
mud outpouring from the crater started to propagate over the lobe’s surface and accumulate at the 182
front of the flow (Fig. 4, t=30 s). Once enough material had accumulated to overcome the small 183
ridges at the edges, a new lobe formed (Fig. 4, t=34 s to t=48 s) and the process repeated until the 184
supply of mud was exhausted (Fig. 4, t=49 s and t=105 s). The movement of mud through the lobes 185
created an interior trough with a curvy and irregular shape (Fig. 4, t=928 s). 186
When the same experiment was repeated with the surface inclined at 10°, a similar behaviour was 187
observed (Fig. 6). However, the flow lobes travelled faster and further than lobes at 5° inclination. 188
The resulting deposited lobes were also longer and narrower than in the previous set of experiments 189
(Fig. 6, t=30 s). In some cases, the flow lobe became separated from the main flow and/or from the 190
source crater by a layer of sand grains ejected by escaping gases from the sand layer (see the 191
evolution of the left flow lobe on Fig. 6 from t=25 s to t=35 s), giving the flow a discontinuous 192
appearance. 193
The boiling within the bulk volume of the mud also caused the nucleation of variously sized 194
bubbles which moved upwards to the surface of the mud. Once they reached the surface, they 195
dramatically expanded and as a result some portions of the mud were fragmented into small droplets 196
(Fig. 5b). These droplets were then ejected along ballistic pathways and deposited close to the active 197
mud flow (e.g. Fig. 4, note the presence of small dark droplets whose frequency increased around 198
the flow between times t=30 s and t=105 s). The influence of the mud fragmentation on the total 199
transported mud volume was only minor, however, it occurred over the entire length of the mud flow 200
wherever the bubbles were able to form and move through the mud. This mechanism was not active 201
during the experiments performed under terrestrial pressure conditions. Part of the ejected sand and 202
mud was also deposited on the mud flow where it formed a sandy-muddy crust (Fig. 4b) which partly 203
hindered the mud flow. The crust was either later destroyed by a new batch of mud or by a gas 204
release, or it survived until the end of the experiment. 205
We also observed the release of gases in the form of centimetre-sized bubbles for dozens of 206
minutes in the pouring area and in several other areas along the entire length of the flow providing 207
evidence that the mud remained liquid in the subsurface (Fig. 5b). The presence of liquid mud 208
covered by sand was later confirmed once the chamber was recompressed and the interior of the 209
resulting features were studied by breaking them apart from their edges to the source area (Fig. 7). 210
By using an additional experimental setup, a plastic box infilled by a 33 cm thick layer of sand, we 211
found that the mud flow was capable of eroding into the sand layer to a depth of several centimetres 212
as mud was observed beneath the original sand surface. This setup also revealed that the mud flow 213
was surrounded by a layer of sand saturated by water (Figs. 7b-d). 214
The inspection of the final morphology of the mud flows once the chamber was recompressed 215
revealed that the internal structures of the flows were supported by a hardened mixture of mud and 216
sand allowing the formation of vertical cliffs or overhangs forming crusts which fully or partially 217
covered the flow channels. These crusts enclosed cavities through which the flows had propagated 218
(Fig. 7f). We also observed that the bottoms of the troughs were covered by fine-grained clay. 219
Repeated gas explosions had formed holes which were located above small subsurface pockets 220
infilled by mud. 221
The experiments performed under terrestrial pressure did not show the same behaviour or 222
morphologies as those at martian pressure (Fig. 8). The mud within the container before pouring did 223
not boil and its internal temperature did not drop. Once the mud was poured from the container (Fig. 224
8, t=5 s), it started to flow relatively uniformly over the sand surface (Fig. 7f) and, as a consequence, 225
a broad and thin mud flow formed (Fig. 8, t=20 s). In some cases, centimetre-sized flow lobes formed 226
on the edge of the propagating flow (Fig. 8, t=25 s and t=85 s) as a result of topographic irregularities 227
in the sand layer. The flow did not significantly erode into the sand surface and vertical cliffs or 228
protective muddy-sandy crust were not observed to form. 229
The experiments performed under reduced atmospheric pressure over the 5° inclined plastic plate 230
showed that boiling still occurred, but it was not able to lift the propagating mud flow. Once the mud 231
was poured from the container, it started to flow over the surface forming a several centimetres wide 232
and a dozens of centimetres long flow. As no unconsolidated material was available, the flow did 233
not erode to the subsurface and hence the direction of the propagation of the mud flow was only 234
controlled by gravity. Analogue experiments performed under terrestrial pressure lead to the 235
formation of similarly looking mud flows, however, no boiling was observed. 236
4. Discussion
237
4.1. Application to Mars 238
Our experiments revealed that a low pressure environment has a significant effect on the 239
propagation of low viscosity mud over a warm unconsolidated surface (Fig. 9). The reason for this 240
different behaviour is the instability of water (Bargery et al., 2010) that leads to boiling and the 241
formation of water vapour bubbles which escape violently from the mud to the surrounding 242
atmosphere and partly also into the subsurface. The strongest influence of the boiling on the mud 243
movement occurs at the contact between the mud and the warm material over which the mud 244
propagates. Here the boiling is most intense as the heat stored within the substrate is available to 245
support boiling. As a result, a large quantity of water vapour is produced at this interface (Fig. 5a). 246
The release of water vapour can then modify the way the mud moves leading to levitation and 247
sliding/creeping of the advancing mud lobes. 248
This is similar to the transport mechanism described by Raack et al. (2017) and Herny et al. 249
(2018), who studied the downslope movement of water-saturated sediments in a low pressure 250
environment, albeit with one major difference. Whereas Raack et al. (2017) and Herny et al. (2018) 251
observed that the water-saturated sediments propagated in the form of individual small pellets, the 252
levitating mud observed herein moves as a coherent fluid (Figs. 2, 3 and 6a). The entire flow lobe is 253
therefore affected by the levitation. Once the gas production in the advancing lobe decreases, the 254
mud seems to propagate over the inclined unconsolidated surface by sliding and/or creeping (Figs. 2, 255
3 and 6a) as the gas release can only partly lift the lobe. These mechanisms cause an increase in the 256
speed of mud propagation over the unconsolidated surface under martian ambient pressure (Figs. 2 257
and 3) as compared to terrestrial ambient pressure (Fig. 8). 258
The boiling of water has also another effect on mud flow propagation in regard to its stability in 259
the martian environment. This is because the ejection of sandy grains by expanding gas and their re -260
deposition on top of the mud flow can form a sandy-muddy crust by coalescing sand and finer-261
grained clay particles together. The crust can partly isolate the liquid mud from the atmosphere and 262
prolongs its lifetime on the surface. The mud can then propagate under the crust giving rise to the 263
formation of an interconnected network of mud channels beneath the crust (e.g. experiment #26 and 264
#31). 265
The crust which developed in our experiments extended along the flow over several centimetres 266
of the mud flow channel (e.g., Figs. 4, 5, 6 and 7), but real mudflows are likely to be longer and 267
wider, so it is difficult to estimate the efficacy of this process at field-scale. We hypothesize that the 268
limited coverage of the flow in our experiments was caused by the fact that these experiments were 269
volume-limited and the processes associated with the development of the mud flow operated for only 270
a relatively short period of time. If the mud volume were larger, the flow would last for longer and 271
more mud-sand interaction would occur and perhaps a crust may be formed over a larger surface 272
area of the mud channel. If a larger section of the channel were covered by the crust, this may fully 273
isolate the flow from the low atmospheric pressure, causing boiling to cease. Under such scenario, 274
boiling would only occur at the active edges of the mud flow where the mud would be exposed to 275
the atmosphere. Even if the crust could only cover part of the channel over its entire length, our 276
observations suggest that mud propagating over a warm surface – similarly to the mud propagating 277
over a cold surface (Brož et al., in press) – is capable of developing a protective crust prolonging the 278
lifetime of the flow on the surface of Mars. This is an aspect of mud propagation that has not 279
previously considered and should be investigated further. However, it should be noted that this 280
process may only be important for martian mud flows whose width is within the range of centimetres 281
to decimetres, and less significant for wider ones. This is because even under the reduced martian 282
gravity the ballistic trajectory of the particles is limited. Furthermore, a larger width of the flow 283
would mean that the volume of ballistically transported particles, necessary to form a sufficiently 284
thick crust, would significantly increase. As a consequence it would be difficult to form a crust over 285
a flow more than several tens of centimetres wide. Therefore, decimetre-wide flows would show 286
variations on their surfaces as the flow edges (unlike the central part) would be affected by the 287
presence of a newly formed crust. Hence, the central part would display patterns associated with 288
flow processes. It should be highlighted that we predict crust formation only on martian mud flows 289
propagating over mobile substrates, such as, unconsolidated sandy regolith. As shown by the 290
experiment setup using the plastic plate, if the mud propagated over impermeable rocky or crusty 291
surfaces, even though boiling would still occur, the crust would not be formed because of the absence 292
of small particles that could be ejected onto the mud. The properties of the substrate could 293
significantly influence the way the mud propagates, and the final morphology observed at the surface. 294
We also observed that mixing of the mud and sand at the flow boundaries produced vertical cliffs 295
or even overhangs which were relatively stable as shown by their capacity to survive the processes 296
of chamber repressurisation (Figs. 7a,d and 8). We expect that within the range of centimetres to 297
decimetres wide mud flows such cliffs may result in atypical morphologies compared to those found 298
in terrestrial mud flows suggesting that comparison to terrestrial analogues could be misleading. 299
However, we do not expect that shapes of metre- or kilometre-sized mud flows would be affected as 300
the mechanical strength of such cliffs would be limited. Centimetre-sized cliffs can be attained, 301
whereas metre-sized cliffs would collapse. Small mud flows can therefore share some similarities 302
with terrestrial low viscosity lava flows for which vertical cliffs or overhangs are common (e.g., 303
Kilburn, 2000) as lava solidification is capable of forming such landforms. 304
4.2. Temperature drop within the mud and substrate 305
In addition, our experiments show that there is another crucial factor which deserves further 306
investigation when studying surface expressions of possible martian mud flows. The instability of 307
the water causes a temperature drop in the mud due to evaporative cooling which removes latent heat 308
from the mud and from the subsurface (Bargery et al., 2010; Brož et al., in press). So, once the 309
ascending mud reaches the martian surface, the mixture would rapidly self-cool close to the freezing 310
point. 311
Specifically, when the mud initially propagates over a warm surface, and the flow continues over 312
the same area for a certain amount of time, evaporative cooling removes the available heat both from 313
the mud and the substrate. This results in gradual freezing of the mud and the subsequent formation 314
of an icy-muddy crust (Brož et al., in press), altering the mechanisms of mud propagation. Ultimately 315
the mud would propagate via frozen mud tubes in similar fashion as pahoehoe lava (Brož et al., in 316
press). This leads us to conclude that mud movement over today’s martian surface would involve a 317
combined process governed both by levitation and/or sliding at the front and by freezing as the flow 318
progresses. Both mechanisms may occur during the formation of a single mud flow and this suggests 319
that the resulting morphologies may record these variations of mud transport. 320
To obtain a first order of understanding regarding what happens in case of a mud flow over a warm 321
surface, we use the subsurface temperature profiles corresponding to the maximum ground temperature 322
case in Fig. 2a as the initial temperature state. We force the top of that temperature profile to be at 273 K, 323
representing the coldest possible temperature in contact with boiling water. We then solve the heat 324
conduction equation starting from the above described condition, using the explicit Euler finite 325
difference method with 1 mm depth resolution and 0.1 s time resolution. The model is stopped when the 326
entire profile is below 273 K, the time until at that moment is presented in Fig. 2e. For comparison we 327
also conduct this cooling model with a profile resembling the laboratory setup: i.e. assuming a thermal 328
conductivity of 0.04 Wm-1K-1 for the 0.2 mm particle diameter sand at 700 Pa (Presley and Christensen,
329
1997) and an initial constant temperature of 273 K. The timescale of cooling below freezing everywhere 330
is not meaningful in this context, but we can calculate the heat flow conducted through the surface as a 331
function of time. This heat flow q with unit Wm-2 can be translated into a vapour column production
332
rate v with unit of m s-1, which is the thickness of the vapour layer produced per second:
333
v = q R T / (LvmH2O P) 334
where R = 8.314 J K-1 mol-1 is the ideal gas constant, T = 273 K is the assumed gas temperature, Lv =
335
2.46 x 10⁶ Jkg-1 is the latent heat of water vaporization, mH2O = 0.018 kg is the weight of 1 mol of water,
336
and P = 611 Pa is the saturation pressure of water at temperature T. Temperature and pressure below a 337
levitating flow will likely be higher, and the volume lower, than these assumed values, since it must 338
compensate for hydrostatic and ambient pressure. It is likely that for levitation a critical production rate, 339
proportional to the heat flow out of the top of the substrate must be sustained. In the laboratory 340
experiments the levitating is intermittent, with a typical duration on the order of 10 s after the 341
emplacement of fresh mud flow lobes (Fig. 4). In the thermal model of the laboratory setup with the top 342
of the substrate forced to 273 K, the heat flow conducted from the surface is > 550 Wm-2 in the first 10
343
seconds. This corresponds to column of vapour produced per second of v = 46 cm s-1. It should be noted
that not all of the heat from the subsurface will produce water vapour from the mud flow, some heat will 345
be transported away by the vapour. 346
Nevertheless, taking 550 Wm-2 as requirement for mud levitation, we can apply it to the model of
347
the forced cooling of Mars surface to estimate how long flows could levitate on Mars, Fig. 2f shows the 348
duration of heat flow > 550 Wm-2 conducted through the substrate surface forced to a temperature of
349
273 K starting from the maximum modelled temperature conditions (Fig. 2a). This map shows that over 350
a band of latitudes of 60°S to the equator, levitation is possible if a mud flow occurs close to noon during 351
the warmest season. In the northern hemisphere this also applies to parts of Syrtis Major Planum and 352
Chryse Planitia, due to their relatively high albedo. 353
This model neglects the observed ejection of substrate particles from below the flow, which would 354
initially increase the heat flow from the subsurface by exposing deeper layers. At some point however 355
the erosion of the substrate would expose layers below zero, so that this process would stop at most at a 356
few centimetres of depth (Fig. 2c). Also neglected is the possibility of water penetrating into the 357
subsurface, either in vapour or in liquid form, which would likely speed up cooling of the substrate. 358
We are also aware that the environmental properties on Mars vary over time, due to the chaotic 359
variation in Mars’ orbital parameters, which affects the distribution of incoming insolation (Laskar et 360
al., 2004). For example, during periods of higher obliquity (Ward, 1973) areas where surface 361
temperatures could be above the freezing point of water would vary in magnitude and position. Also, 362
the depth to which the freezing point would descend would vary (Costard et al., 2002) and hence the 363
amount of available heat necessary to keep the process of the violent boiling active would be 364
different. The time required by the evaporative cooling to remove the available heat from the 365
subsurface increases proportionally with the depth of the freezing point. Variations in surface 366
temperatures caused by variations in Mars’ orbital parameters may therefore prolong or foreshorten 367
the period over which boiling would dominate the behaviour of the mud. This means that the 368
mechanisms dominating in mud propagation should change through time. 369
Additionally, the complex magmatic history of Mars (e.g. Grott et al., 2013) suggests that the heat 370
flux within the martian crust has not been steady. In fact, it has varied through time at various 371
localities producing geothermal anomalies (e.g. Plesa et al., 2016). These sites may represent ideal 372
places where sedimentary eruptions may result due to the melting of subsurface water ice or 373
hydrothermal activity. Higher heat flux may also imply that the surface can be sufficiently warm to 374
prevent the freezing of the extruded mud for extended periods of time, or even completely inhibited. 375
Under such a scenario, it may be possible that the described processes, which operated in our 376
experiments at the centimetre-scale only, would be able to affect even wider surfaces and therefore 377
produce larger scale mud features. It should therefore be taken into account that some morphologies 378
which are present at the surface of Mars today, and which may have an origin associated with mud 379
eruptions, may be linked to the intense boiling and the above described transport mechanisms. 380
4.3. Scaling to Mars and experimental limitations 381
The presented experimental approach has several limitations as it cannot fully attempt to simulate 382
all the conditions of sedimentary volcanism on Mars or even on Earth. Firstly, our experiments were 383
performed with a fixed volume of mud (500 ml). This limits the size of the resulting flows to a length 384
of several decimetres, the width to several centimetres and the thickness to less than 1-2 centimetres. 385
On Earth, sedimentary volcanism can extrude mud volumes several orders of magnitudes larger than 386
those in our experiments (e.g. Kopf, 2002; Mazzini and Etiope, 2017) resulting in metre- to 387
kilometre-long mud flows. However, low volume eruptions are more common than voluminous ones. 388
Obviously, we were not able to perform experiments at the metre- to kilometre-scale due to the size 389
limitation of the available low pressure chamber. Nevertheless, our work can still provide valuable 390
insights into mud propagation in a low pressure environment due to the chosen mud viscosity. This 391
is because low viscosity mud flows, naturally occurring on Earth, propagate over flat surfaces 392
preferentially on their edges forming centimetres-thick mud lobes (Mazzini and Etiope, 2017; Miller 393
and Mazzini, 2018) similar to those observed in our experimental setup. Therefore, we are capable 394
to directly address, some of the differences between those terrestrial flows and putative martian 395
analogues. Our work therefore suggests that environmental differences between Earth and Mars 396
would affect the propagation of both small and large martian mud flows, but with differing intensity. 397
However, our experiments do not provide appropriate insights about the propagation of thicker low 398
viscosity flows, for example, when the mud becomes channelized or a large quantity of mud is 399
extruded over a short period of time. This is because in thick mud flows the flow regime may change. 400
This should significantly change the way the mud propagates in the low pressure environment as 401
heat will be transported differently within the flow and there is a need for further experimental or 402
theoretical investigation of this problem. 403
An additional limitation is associated with the inability to perform experiments in a reduced gravity 404
environment, mimicking the gravity of Mars (3.7 m s-2). Our experiments were performed under
405
terrestrial gravity (9.8 m s-2), which has an influence on the way the mud propagates. Terrestrial gravity
406
limited the height to which the vibrating mud could levitate as well as the total volume of mud which 407
could be lifted. A similar limitation was encountered in the study of Raack et al. (2017) in which the 408
different gravitational force affects the levitation of the sedimentary pellets propagating over the hot 409
surface. These authors showed that the reduced gravity would allow pellets to levitate for up to 48 times 410
longer on Mars than on Earth and that the lifted pellets could be up to seven times heavier compared to 411
those lifted in their experiments. These calculations suggest that, on Mars, mud would levitate for a 412
longer period of time and to a greater height than observed in our experiments. The lower martian gravity 413
would also affect the distance to which the sand grains and small mud droplets would be ejected. Brož 414
et al. (2014) showed that ballistically emplaced scoria particles can travel about 20 times further on Mars 415
than on Earth due to the lower gravity and lower atmospheric pressure. Therefore, the ejected material 416
would be spread over much wider area than observed in our experiments. This means that on Mars more 417
transported material would be necessary to build a steep-sided rim which in part affects the flow of 418
material over the flat surface. As a consequence, the role of marginal rims to, at least partly, guide the 419
flow direction may be limited on Mars as the rims may be much broader but shallower than those 420
observed in our experiments. Ultimately gravity may also affect the way the flow erodes the subsurface 421
as sand and other particles would be more easily shifted by the gases released from the advancing mud 422
flow. To overcome these limitations, it would be necessary to develop a dedicated numerical model and 423
perform additional analogue experiments which would allow better understanding of the behaviour and 424
rheology of mud under reduced atmospheric pressure. This approach would allow direct comparison of 425
modelled features with real martian landforms. This goal is beyond the scope of our present work. 426
5. Conclusions
427
Our experiments show that a warm (from ~292 K to ~296 K) and unconsolidated surface has a 428
profound effect on the behaviour of flowing low viscosity mud in a low-pressure environment (Fig. 429
9). The resulting boiling occurring during the mass flow, causes transient levitation of the mud above 430
the warm surface as well as the erosion of the unconsolidated sandy substrate. Both mechanisms alte r 431
mud propagation in a low pressure environment. Moreover, we expect that these processes would be 432
even more effective on Mars which has a lower gravitational acceleration than on Earth. On Mars 433
gravity does not change the boiling rate, but the sediments can be more easily entrained (Raack et 434
al., 2017; Herny et al., 2018). The gas release should levitate mud for a longer period of time than 435
observed in our experiments, as also similarly suggested for wet sand (Raack et al., 2017; Herny et 436
al., 2018), hence allowing the mud to propagate over larger distances than modelled within the low 437
pressure chamber. Additionally, as the process of evaporative cooling would remove the latent heat 438
from the mud and from the surface over which it is propagating, at a certain point, the mud would 439
start to freeze. This would cause the formation of a protective icy-muddy crust affecting the way the 440
mud moves (Brož et al., in press) switching from levitation and sliding/creeping to the propagation 441
via mud tubes. The mechanisms of mud propagation on Earth at different pressrure-temperature 442
conditions are well studied. Mud propagation, during this relatively simple process, is controlled by 443
mass gravity flow. In contrast, very little is known about the modes controlling the same events on 444
Mars and other bodies with or without atmospheres where mud eruptions may be present (e.g., 445
Ruesch et al., 2019). Our new data demonstrate that the behaviour of mud and its propagation in a 446
low-pressure environment, is strongly controlled by the surface temperature since freezing or rapid 447
boiling give rise to different transport mechanisms than simple liquid flow. We conclude that mud 448
eruption activity on other celestial bodies may produce profoundly different morphologies compared 449
to those commonly observed on Earth. 450
Acknowledgements
451
The access to the Large Mars Chamber at the Open University was provided by Europlanet 2020 RI 452
which has received funding from the European Union's Horizon 2020 research and innovation program 453
under grant agreement No 654208. OK was supported by Center for Geosphere Dynamics (Faculty of 454
Science at Charles University) project UNCE/SCI/006. AM was funded by the ERC grant agreement 455
308126 (LUSI LAB) and the Research Council of Norway (Centers of Excellence funding scheme, 456
project 223272). We are thankful to Mikhail A. Ivanov and two anonymous reviewers for their 457
constructive comments and to William McKinnon for handling the editorial process. The movies and 458
temperature and pressure data that support the findings of this study are available in Zenodo.org with 459
the identifier 3520947 (https://doi.org/10.5281/zenodo.3520947). 460
6. Figures and tables
461
Figure 1. Examples of putative martian low viscosity mud flows and their meter-sized terrestrial 463
counterparts. Panels a) and b) show two examples of putative kilometre-scaled martian water-dominated 464
mud flows within the Chryse Planitia (Komatsu et al., 2016, Brož et al., 2019). c) and d) show meter-465
sized low viscosity mud flows within the crater of Bakhar mud volcano in Azerbaijan which, during 466
prolongued activity, are capable of building dozens of meter-sized morphological features. e) shows 467
mud volcanos within the area of Salse di Nirano in Italy and f) shows the scale and context of this feature 468
where other similar features are present. Panel a) (centred at 19.16°N, 322.73°E) and panel b) (centred 469
at 20.24°N, 324.01°E) are based on CTX images F05_037598_1988_XN_18N037W and 470
B19_016856_1990_XI_19N035W respectively, image credit NASA/JPL/MSSS. Panel f) based on 471
Google EarthTM .
473
Figure 2. Results of thermal model calculations described in the Section 2.2. Panel a) is the map of the 474
maximum temperature the surface can be expected to attain in an average current martian climate. b) is 475
the total percentage of a Mars Year that the surface is above 273.16 K. c) shows the maximum depth of 476
the layer that experiences temperatures above 273.16 K. d) shows the maximum energy that can be 477
released before the entire surface layer is cooled below 273.16 K. e) shows the time needed to cool the 478
subsurface from the maximum temperature case (a) to below 273.16 K when the substrate top is forced 479
to be at 273.16 K. f) shows the time needed until the heat flow conducted through the surface drops 480
below 550 W/m² under the same conditions as in e). 481
482
Figure 3: Schematic illustration showing the experimental setup with the position of thermocouples, 483
photogrammetric targets and four cameras marked. Data from thermocouples are not discussed within 484
this study, however, they are provided in the Supplementary materials uploaded on Zenodo.org for those 485
who are interested. 486
487
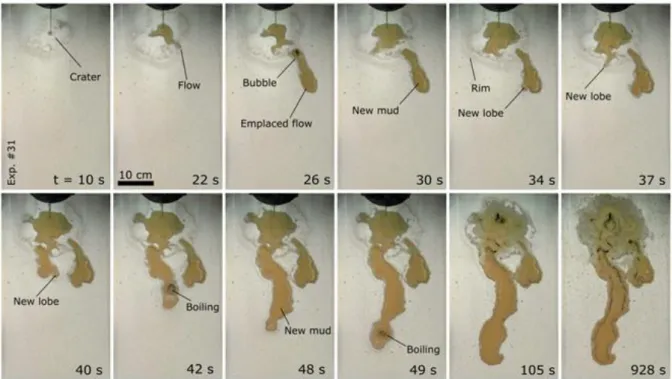
Figure 4: A sequence of images from different time steps (in seconds) capturing the propagation of 488
low viscosity mud over a warm surface inclined by 5° under low pressure mimicking conditions on 489
Mars. The mud was poured on the surface from a hanging container. Once the mud touched the surface, 490
intense boiling occurred, and a central crater-like depression started to form (t=10 s). Soon a surface 491
mud flow developed (t=22 s) and started to propagate downslope a few centimetres at a time in the form 492
of a narrow lobe which was levitating and sliding/creeping over the sand surface (t=26 s). After a while, 493
the flow stopped its propagation (t=30 s) and a new lobe developed (t=34 s). This process repeated as 494
long as mud was being poured onto the surface (t=37 s; t=40 s). The boiling also caused the formation 495
of rims surrounding the lobes. The images were obtained from the video recorded by camera #1 496
observing experiment #31 from above. 497
498
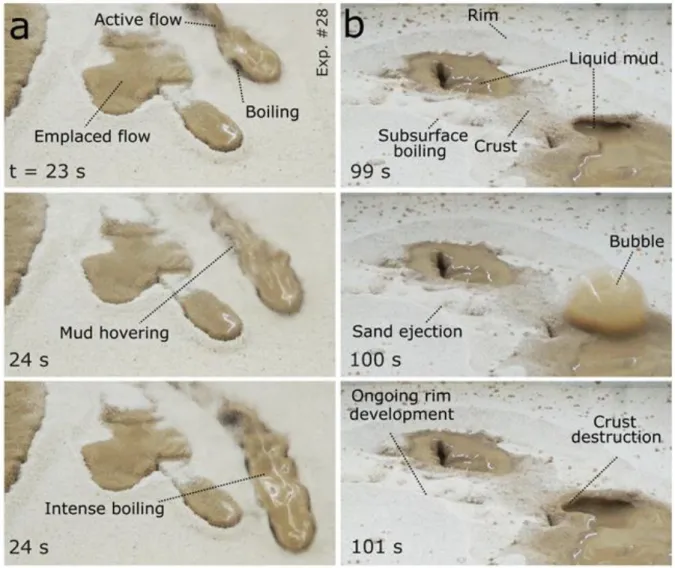
Figure 5: Two-time sequences of images showing (a) the levitating and sliding mud over an 499
unconsolidated surface and (b) the continuous explosions indicating the presence of liquid mud in the 500
subsurface. Note the irregular shape of the propagating active mud flow in the vertical direction in panel 501
(a) revealing intense boiling within the flow and associated release of water vapour from the flow. Such 502
releases caused levitation of the material and rapid propagation of the flow over the surface. The images 503
were obtained from the video recorded by camera #3 observing experiment #28 from front. 504
505
Figure 6: A time series of images (time steps in seconds) capturing the propagation of low viscosity 506
mud over a warm surface inclined by 10° under low pressure, mimicking conditions on Mars. The mud 507
was poured to the surface from a hanging container. Similarly to the results captured in Figure 3, intense 508
boiling occurred (t=8 s) and after a while a narrow mud lobe developed (t=9 s). Due to the higher 509
inclination of the surface the mud lobe travelled faster and further (t=11 s) than in those experiments 510
performed at a slope of 5°. The narrow, long lobes were partly or fully covered by ejecting sandy grains 511
(t=25 s) which caused a seemingly discontinuous appearance of the final morphology. The images were 512
obtained from the video recorded by camera #1 observing experiment #26 from above. 513
514
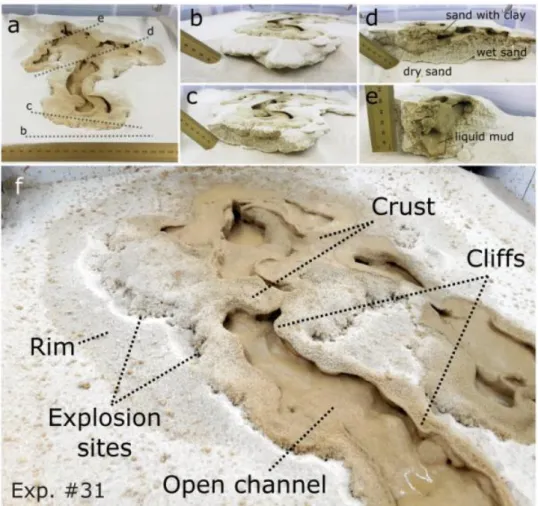
Figure 7: An example of the resulting morphology of a low viscosity mud flow and its inner structure 515
formed by the movement over “warm” sand in a low pressure environment. (a) The edge of the flow is 516
surrounded by set of sandy ridges and several central troughs through which the mud propagated. The 517
dashed line at b marks the position at which the mud flow was exposed by removing the sand (shown in 518
panel b) and the dashed lines c to e mark where the flow was sectioned to reveal the inner structure of 519
the flow (shown in the corresponding panels). The flow was composed of a layer in which clay-particles 520
dominated and by a layer in which the sand was saturated by water (marked on panel d). In some cases, 521
the liquid mud was still present in the subsurface (e). f) Detail of the resulting low viscosity mud flow 522
morphology, which was characterised by a network of open central channels of varying depths 523
surrounded by rims composed of sandy particles ejected from multiple small explosion sites. These 524
explosion sites mark the boundary between the liquid mud and surrounding dry sand. In some places a 525
protective crust developed by gluing together clay and sand particles. The width of the main channel is 526
around 2 cm. Note the cliffs which can be vertical or overhangs can be formed. 527
528
Figure 8: A sequence of images taken at different time steps (t) capturing the propagation of low 529
viscosity mud over a warm surface inclined by 5° under terrestrial ambient pressure conditions. The 530
mud propagates as a tens of centimetres wide and a few mm thick sheet-like mud flow. Images obtained 531
from the clip recorded by camera #1 observing the experiment #14 from above. 532
533
534
Figure 9: Schematic illustration showing the development of a low viscosity mud flow during the 535
movement over the ‘warm’ inclined surface under martian conditions with insets showing the main 536
processes operating during its emplacement. (a) The ascending mud would move downhill from the 537
source area via partly overlapping flow lobes. The instability of water within the mud would cause 538
redeposition of unconsolidated sandy surface as well as fast propagation of the fronts of the active lobes. 539
The different colours mark different states of the mud; brown indicates immobile mud, while orange 540
indicates liquid, and hence mobile, mud. The black dashed rectangles mark the position of small insets 541
in panel b (b) Stage 1 shows mud propagation by levitation over the inclined sand surface. The levitation 542
is caused by boiling water releasing gases from the base of the mixture. Escaping gases are additionally 543
able to trigger ejections of sand grains and hence cause self-burying of the mud flow under the surface. 544
Stage 2 shows the situation when the mud flow lobe stops propagating by levitation and when the water
545
from the mud starts to infiltrate into the subsurface. Stage 3 then shows the input of new liquid mud 546
flows over the older mud flow. Finally, at Stage 4 the new batch of mud overcomes the margins of the 547
older mud flow and hence the mud flow would be again be exposed to a warm surface. This then causes 548
the levitation of the mud flow and repetition of the whole process. 549 Exp # Pressure range* [mbar] Inclination
[°] time** [s] Release Type of surface
exp_31 7.1-8.1 5 52 ~2 cm sand layer
exp_32 6.9-7.6 5 29 ~2 cm sand layer
exp_33 6.9-7.4 5 21 ~2 cm sand layer
exp_51 7.0-7.7 5 45 ~33 cm sand layer
exp_52 6.6-7.1 5 34 ~33 cm sand layer
exp_53 6.6-8.5 5 22 ~33 cm sand layer
exp_12 1000 5 19 ~2 cm sand layer
exp_13 1000 5 20 ~2 cm sand layer
exp_14 1000 5 18 ~2 cm sand layer
exp_26 6.7-7.4 10 36 ~2 cm sand layer
exp_27 7.1-8.1 10 23 ~2 cm sand layer
exp_28 7.1-7.8 10 43 ~2 cm sand layer
exp_46 6.7-7.6 5 34 plastic plate
exp_47 6.9-7.3 5 50 plastic plate
exp_48 6.8-7.4 5 60 plastic plate
exp_43 1000 5 45 plastic plate
exp_44 1000 5 40 plastic plate
exp_45 1000 5 37 plastic plate
* Pressure range during the first two minutes of the experimental run
** Time period over which the mud was poured from the container
550
Table 1: Summary of measured and controlled variables for each experimental run. 551
References
552
Allen, C. C., Oehler, D., Etiope, G., van Rensbergen, P., Baciu, C., Feyzullayev, A., et al., 2013. Fluid 553
expulsion in terrestrial sedimentary basins: A process providing potential analogs for giant 554
polygons and mounds in the Martian lowlands. Icarus, 224(2), 424–432. 555
https://doi.org/10.1016/j.icarus.2012.09.018. 556
Bargery, A. S., Lane, S. J., Barrett, A., Wilson, L., Gilbert, J. S., 2010. The initial responses of hot liquid 557
water released under low atmospheric pressures: Experimental insights. Icarus 210(1), 488–506. 558
https://doi.org/10.1016/j.icarus.2010.06.019. 559
Brož, P., Hauber, E., 2013. Hydrovolcanic tuff rings and cones as indicators for phreatomagmatic 560
explosive eruptions on Mars. Journal of Geophysical Research: Planets 118, 1656–1675. 561
https://doi.org/10.1002/jgre.20120. 562
Brož, P., Čadek, O., Hauber, E., Rossi, A. P., 2014. Shape of scoria cones on Mars: Insights from 563
numerical modeling of ballistic pathways, Earth and Planetary Science Letters 406, 14–23, 564
https://doi.org/10.1016/j.epsl.2014.09.002. 565
Brož, P., Hauber, E., Wray, J. J., Michael, G., 2017. Amazonian volcanism inside Valles Marineris on 566
Mars. Earth and Planetary Science Letters 473, 122–130. 567
https://doi.org/10.1016/j.epsl.2017.06.003. 568
Brož, P., Hauber, E., van de Burgt, I., Špillar, V., Michael, G., 2019. Subsurface sediment mobilization 569
in the southern Chryse Planitia on Mars. Journal of Geophysical Research: Planets 124. 570
https://doi.org/10.1029/2018JE005868. 571
Brož, P., Krýza, O., Wilson, L., Conway, S. J., Hauber, E., Mazzini, A., Raack, J., Balme, M. R., Sylvest, 572
M. E., Patel, M. R. (in press). Experimental evidence for lava-like mud flows under Martian 573
surface conditions. Nature Geoscience. 574
Christensen, P.R., et al., 2001. Mars Global Surveyor Thermal Emission Spectrometerexperiment: 575
Investigation description and surface science results. Journal of Geophysical Research 106, 576
23823–23872. https://doi.org/10.1029/2000JE001370. 577
Clark, B. C., 1978. Implications of abundant hygroscopic minerals in the martian regolith. Icarus 34, 578
645–665. https://doi.org/10.1016/0019-1035(78)90052-0. 579
Conway, S. J., Lamb, M. P., Balme, M. R., Towner, M. C., Murray, J. B., 2011. Enhanced runout and 580
erosion by overland flow at low pressure and subfreezing conditions: experiments and application 581
to Mars. Icarus 211, 443–457. https://doi.org/10.1016/j.icarus.2010.08.026. 582
Corradi, A. B., Manfredini T., Pellacani, G. C., Pozzi, P., 1994. Deflocculation of Concentrated Aqueous 583
Clay Suspensions with Sodium Polymethacrylates, Journal of the American Ceramic Society 77, 584
Issue 2. https://doi.org/10.1111/j.1151-2916.1994.tb07022.x. 585
Costard, F., Forget, F., Mangold, N., Peulvast, J. P., 2002. Formation of recent martian debris flows by 586
melting of near-surface ground ice at high obliquity. Science 295, 110–113. 587
https://doi.org/10.1126/science.1066698. 588
Forget, F., Hourdin, F., Fournier, R., Hourdin, C., Talagrand, O., Collins, M., Lewis, S. R., Read, P. L., 589
Huot, J.-P., 1999. Improved general circulation models of the Martian atmosphere from the 590
surface to above 80 km. Journal of Geophysical Research 104, 24155. 591
https://doi.org/10.1029/1999JE001025. 592
Grott, M., Baratoux, D., Hauber, E., Sautter, V., Mustard, J., Gasnault, O., Ruff, S. W., Karato, S.-I., 593
Debaille, V., Knapmeyer, M., Sohl, F., Van Hoolst, T., Breuer, D., Morschhauser, A., Toplis, M. 594
J., 2013. Long-Term Evolution of the Martian Crust-Mantle System, Space Science Reviews 174, 595
49–111. https://doi.org/10.1007/s11214-012-9948-3. 596
Hecht, M. H., 2002. Metastability of liquid water on Mars, Icarus 156, 373-386. 597
https://doi.org/10.1006/icar.2001.6794. 598
Hecht, M. H., et al., 2009. Detection of perchlorate and the soluble chemistry of martian soil at the 599
Phoenix lander site, Science 325, 64–67. https://doi.org/10.1126/science.1172466. 600
Herny, C., Conway, S.J., Raack, J., Carpy, S., Colleubanse, T., Patel, M.R., 2018. Downslope sediment 601
transport by boiling liquid water under Mars-like conditions: experiments and potential 602
implications for Martian gullies. In: Conway, S.J., Carrivick, J.L., Carling, P.A., De Haas, T. 603
Harrison, T.N. (eds) Martian Gullies and their Earth Analogues. Geological Society, London, 604
Special Publications 467. https://doi.org/10.1144/SP467.10. 605
Hemmi, R., Miyamoto, H., 2018. High resolution topographic analyses of mounds in southern Acidalia 606
Planitia, Mars: Implications for possible mud volcanism in submarine and subaerial 607
environments. Geosciences 8(5), 152. https://doi.org/10.3390/geosciences8050152. 608
Kiefer, H.H., Martin, T.Z., Peterfreund, A.R., Jakosky, B.M., Miner, E.D., Palluconi, F.D., 1977. 609
Thermal and albedo mapping of Mars during the Viking primary mission. Journal of Geophysical 610
Research 82, 4249–4291. https://doi.org/10.1029/JS082i028p04249. 611
Kilburn, C. R. J., 2000. Lava flows and flow fields, in Encyclopedia of Volcanoes, pp. 291 – 305, 612
Elsevier, New York. 613
Komatsu, G., Okubo, C. H., Wray, J. J., Ojha, L., Cardinale, M., Murana, A., Orosei, R., Chan, M. A., 614
Ormö, J., Gallagher, R., 2016. Small edifice features in Chryse Planitia, Mars: assessment of a 615
mud volcano hypothesis, Icarus 268, 56–75. http://dx.doi.org/10.1016/j.icarus.2015.12.032. 616
Kopf, A. J., 2002. Significance of mud volcanism. Review of Geophysics 40, 1–52. 617
https://doi.org/10.1029/2000RG000093. 618
Kumar, P.S, Krishna, N., Prasanna Lakshmi, K.J., Raghukanth, S.T.G., Dhabu, A., Platz, T., 2019. 619
Recent seismicity in Valles Marineris, Mars: Insights from young faults, landslides, boulder falls 620
and possible mud volcanoes. Earth and Planetary Science Letters 505, 51–64. 621
https://doi.org/10.1016/j.epsl.2018.10.008. 622
Laskar J., Correia A. C. M., Gastineau M., Joutel F., Levrard B., Robutel P., 2004. Long term evolution 623
and chaotic diffusion of the insolation quantities of Mars. Icarus 170, 343–364. 624
https://doi.org/10.1016/j.icarus.2004.04.005. 625
Laigle, D., Coussot, P., 1997. Numerical modelling of mudflows. Journal of Hydraulic Engineering 123, 626
617–623. https://doi.org/10.1061/(ASCE)0733-9429(1997)123:7(617). 627
Massé, M., S. J. Conway, J. Gargani, M. R. Patel, K. Pasquon, A. McEwen, S. Carpy, V. Chevrier, M. 628
R. Balme, L. Ojha, et al., 2016. Transport processes induced by metastable boiling water under 629
Martian surface conditions, Nature Geoscience 9, 425–428. http://doi.org/10.1038/ngeo2706. 630
Mazzini, A., Etiope, G., 2017. Mud volcanism: An updated review. Earth‐Science Reviews 168, 81– 631
112. https://doi.org/10.1016/j.earscirev.2017.03.001 632
Miller, S. A., Mazzini, A., 2018. More than ten years of Lusi: A review of facts, coincidences, and past 633
and future studies. Marine and Petroleum Geology 90, 10–25. 634
https://doi.org/10.1016/j.marpetgeo.2017.06.019. 635
Montabone, L., Forget, F., Millour, E., Wilson, R. J., Lewis, S. R., Cantor, B., Kass, D., Kleinböhl, A., 636
Lemmon, M. T., Smith, M. D.,Wolff, M. J., 2015. Eight-year climatology of dust optical depth 637
on Mars. Icarus 251, 65. https://doi.org/10.1016/j.icarus.2014.12.034. 638
Morgan, P., Grott, M., Knapmeyer-Endrun, B., Golombek, M., Delage, P., Lognonné, P., Piqueux, S., 639
Daubar, I., Murdoch, N., Charalambous, C., Pike, W. T., Müller, N., Hagermann, A., Siegler, M., 640
Lichtenheldt, R., Teanby, N., Kedar, S., 2018. A Pre-Landing Assessment of Regolith Properties 641
at the InSight Landing Site. Space Science Reviews 214, 104. https://doi.org/10.1007/s11214-642
018-0537-y. 643
O'Brien, J. S., Julien, P. Y., 1988. Laboratory analysis of mudflow properties, J. Hydraul. Eng. 114, 644
877–887. https://doi.org/10.1061/(ASCE)0733-9429(1988)114:8(877). 645
Oehler, D. Z., Allen, C. C., 2012. Giant polygons and mounds in the lowlands of Mars: Signatures of an 646
Ancient Ocean? Astrobiology 12(6), 601–615. https://doi.org/10.1089/ast.2011.0803. 647
Oehler, D. Z., Etiope, G., 2017. Methane seepage on Mars: where to look and why, Astrobiology 17. 648
https://doi.org/10.1089/ast.2017.1657. 649
Okubo, C. H., 2016. Morphologic evidence of subsurface sediment mobilization and mud volcanism in 650
Candor and Coprates Chasmata, Valles Marineris, Mars, Icarus 269, 23–27. 651
https://doi.org/10.1016/j.icarus.2015.12.051. 652
Plesa, A.‐C., Grott, M., Tosi, N., Breuer, D., Spohn, T., Wieczorek, M. A., 2016. How large are present‐ 653
day heat flux variations across the surface of Mars? J. Geophys. Res. Planets 121, 2386– 2403. 654
https://doi.org/10.1002/2016JE005126. 655
Pondrelli, M., Rossi, A. P., Ori, G. G., van Gasselt, S., Praeg, D., Ceramicola, S., 2011. Mud volcanoes 656
in the geologic record of Mars: The case of Firsoff crater. Earth and Planetary Science Letters 657
304(3-4), 511–519. https://doi.org/10.1016/j.epsl.2011.02.027. 658
Presley, M. A., Christensen, P. R., 1997. Thermal conductivity measurements of particulate materials 2. 659
Results. Journal of Geophysical Research 102, 6551–6566. https://doi.org/10.1029/96JE03303. 660
Putzig, N. E., Mellon, M. T., 2007. Apparent thermal inertia and the surface heterogeneity of Mars. 661
Icarus 191, 68–94. https://doi.org/10.1016/j.icarus.2007.05.013. 662
Raack, J., S. J. Conway, C. Herny, M. R. Balme, S. Carpy, Patel, M. R., 2017. Water-induced sediment 663
levitation enhances downslope transport on Mars, Nature Communications 8, 664
https://doi.org/10.1038/s41467-017-01213-z. 665
Ruesch, O., Genova A., Neumann W., Quick L. C., Castillo-Rogez J. C., Raymond C. A., Russel Ch. 666
T., Zuber, M. T., 2019. Slurry extrusion on Ceres from a convective mud-bearing mantle. Nature 667
Geoscience 12, 505–509. https://doi.org/10.1038/s41561-019-0378-7. 668
Rubin, D.M, Faíren, A., Martínez-Frías, J., Frydenvang, J., Gasnault, O., Galfenbaum, G., Goetz, W., 669
Grotzinger, J.P., Le Moue´lic, S., Mangold, N., Newsom, H., Oehler, D.Z., Rapin, W., Schieber, 670
J., Weins, R.C., 2017. Fluidized-sediment pipes in Gale Crater, Mars, and possible Earth analogs. 671
Geology 45, 7–10. https://doi.org/10.1130/G38339.1. 672
Salvatore, M. R., Christensen, P. R., 2015. On the origin of the Vastitas Borealis formation in Chryse 673
and Acidalia Planitiae, Mars. Journal of Geophysical Research: Planets 119, 2437–2456. 674
https://doi.org/10.1002/2014JE004682. 675
Sinton, W., Strong, J., 1960. Radiometric observations of Mars, Astrophysical Journal 131, 459–469. 676
https://doi.org/10.1086/146852. 677
Skinner, J. A., Tanaka, K. L., 2007. Evidence for and implications of sedimentary diapirism and mud 678
volcanism in the southern Utopia highland-lowland boundary plain, Mars, Icarus 186, 41–59, 679
http://dx.doi.org/10.1016/j.icarus.2006.08.013. 680
Skinner, J. A., Mazzini, A., 2009. Martian mud volcanism: Terrestrial analogs and implications for 681
formational scenarios. Marine and Petroleum Geology 26(9), 1866–1878. 682
https://doi.org/10.1016/j.marpetgeo.2009.02.006. 683
Vaniman, D. T., Bish, D. L., Chipewa, S. J., Fialips, C. I., Carrey, J. W. Feldman, W. C., 2004. 684
Magnesium sulphate salts and the history of water on Mars. Nature 431, 663– 665. 685
https://doi.org/10.1038/nature02973. 686
Ward, W. R., 1973. Large-scale variations in the obliquity of Mars. Science 181, 260–262. 687
https://doi.org/10.1126/science.181.4096.260. 688
Whaetley, D. F., Chan, M. A., Okubo, C. H., 2019. Clastic pipes and mud volcanism across Mars: 689
Terrestrial analog evidence of past martian groundwater and subsurface fluid mobilization. Icarus 690
328, 141-151. https://doi.org/10.1016/j.icarus.2019.02.002. 691
Wilson, L., Head, J.W., 1994. Mars: review and analysis of volcanic eruption theory and relationships 692
to observed landforms. Rev. Geophys. 32, 221–263. https://doi.org/10.1029/94RG01113. 693
Wilson, L., and Mouginis-Mark, P. J., 2014. Dynamics of a fluid flow on Mars: Lava or mud? Icarus 694
233, 268–280. https://doi.org/10.1016/j.icarus.2014.01.041. 695