HAL Id: hal-01160443
https://hal.archives-ouvertes.fr/hal-01160443
Submitted on 5 Jun 2015
HAL is a multi-disciplinary open access
archive for the deposit and dissemination of
sci-entific research documents, whether they are
pub-lished or not. The documents may come from
teaching and research institutions in France or
abroad, or from public or private research centers.
L’archive ouverte pluridisciplinaire HAL, est
destinée au dépôt et à la diffusion de documents
scientifiques de niveau recherche, publiés ou non,
émanant des établissements d’enseignement et de
recherche français ou étrangers, des laboratoires
publics ou privés.
An objective method for High Dynamic Range source
content selection
Manish Narwaria, Claire Mantel, Matthieu Perreira da Silva, Patrick Le
Callet, Søren Forchhammer
To cite this version:
Manish Narwaria, Claire Mantel, Matthieu Perreira da Silva, Patrick Le Callet, Søren
Forchham-mer.
An objective method for High Dynamic Range source content selection.
Sixth
Interna-tional Workshop on Quality of Multimedia Experience (QoMEX), Sep 2014, Singapore, Singapore.
�10.1109/QoMEX.2014.6982279�. �hal-01160443�
AN OBJECTIVE METHOD FOR HIGH DYNAMIC RANGE SOURCE CONTENT
SELECTION
Manish Narwaria
a, Claire Mantel
b, Matthieu Perreira Da Silva
a, Patrick Le Callet
a,
Søren
Forchhammer
ba. LUNAM University - IRCCyN CNRS UMR 6597, 44306, Nantes, France
b. Department of Photonics Engineering, Technical University of Denmark, 2800 Kgs. Lyngby,
Denmark
ABSTRACT
With the aim of improving the immersive experience of the end user, High Dynamic Range (HDR) imaging has been gaining popularity. Therefore, proper validation and performance benchmarking of HDR processing algorithms is a key step towards standardization and commercial deployment. A crucial component of such validation studies is the selection of a challenging and balanced set of source (reference) HDR content. In order to facilitate this, we present an objective method based on the premise that a more challenging HDR scene encapsulates higher contrast, and as a result will show up more visible errors on contrast reduction. This information is subsequently analyzed via fuzzy clustering to enable a probabilistic interpretation. To evaluate the proposed approach, we performed an experimental study on a large set of publicly available HDR images.
Index Terms— High Dynamic Range (HDR), content
selection, clustering
1. INTRODUCTION
Solid validation and benchmarking, both subjectively and objectively, is one of the key aspects in advancing research and development activities in addition to introducing well-accepted standards and recommendations. Such studies, needless to mention, should be carried out carefully in order that the conclusions arrived at are reliable and reproducible. For example, a well-grounded subjective validation will typically consist of several steps: (a) selection of source content, (b) processing technique to be evaluated and its parameters, (c) recruiting a sufficiently large panel of subjects, (d) subject screening, (e) post-processing of the subjective data such as outlier analysis. As the reader will notice, source (reference) content selection is one of the first steps and is therefore crucial to the ultimate outcome of the study. Consider the case of evaluating and validating a video coding method. In this case, it is necessary that the source
content is selected such that it challenges the codec in terms of its ability to cope with both spatial and temporal redundancy. To this end, the ITU-T P.910 [1] provides objective measures of the perceptual spatial and temporal information. Based on such objective indicators more suitable source content can be selected, in terms of challenging the codec. In the light of growing interest in new technologies such as HDR within the multimedia processing community, there is obviously a need for new domain-specific objective indicators to guide the process of source content selection.
2. BACKGROUND AND MOTIVATION
Improving the user's immersive experience is an emerging trend in today's multimedia content delivery systems [2]. In this quest, 3D, High Frame Rate (HFR), Ultra-High Definition (UHD), and more recently HDR, have been under investigation over the past years. Given this trend, there is obviously need for careful and calibrated validation studies to benchmark as well as facilitate the development of related technologies towards more immersive Quality of Experience (QoE). With regards to HDR imaging, its main thrust towards improving the visual experience consists of significantly increasing the visual contrast in comparison to the traditional low dynamic range (LDR) pictures. The interested reader at this point is encouraged to refer to existing works (such as [3]) for an excellent treatment of basics of HDR capture and processing.
With HDR receiving attention both in academia and industry, there has been a recent push to develop and standardize HDR processing tools. Many such efforts essentially seek to extend the scope of several existing standardized tools for LDR signals (eg. video coding standards) by employing range reduction (or tone mapping). With the use of tone mapping operators (TMOs), the HDR signal is first converted to LDR which can be processed (eg. encoded) via standard tools. An additional operation known as inverse tone mapping is then employed to transform the decoded signal to HDR. TMOs also play an important role
in visualizing HDR on LDR displays [3]. It is therefore evident that TMOs will play a crucial role in the design of backwards compatible HDR processing algorithms as well as HDR visualization. However, tone mapping is a non-transparent process and can lead to loss of visual details. Consequently, the artistic intention of HDR signal may be altered [4]. Hence, it is important that the selected source HDR content challenges TMOs (and hence the HDR processing algorithm) and differentiates between them in terms of their impact on the perceptual visual quality of the processed HDR signal. This will be one of the key requirements towards proper evaluation and validation of the existing and future TMO based HDR processing tools. While subjective approach is the most accurate method for HDR source content selection, it suffers from two drawbacks. The first one is the more general and common to nearly all subjective studies: it can be time-consuming and expensive to administer in the absence of appropriate laboratory conditions. The second drawback is unique to HDR and is related to its visualization. The conventional LDR displays do not have the required luminance range to display HDR in its native format. Recently HDR displays (the maximum displayable luminance in these is still limited but much higher than traditional LDR displays) such as those from SIM2 [5] are starting to appear in the market. However, these may not be useful in specific cases where the HDR processing algorithm's output (an HDR signal) will ultimately be displayed on an LDR monitor via tone mapping. Therefore, there is need for an HDR source content selection approach which is objective and reasonably fast (so that subjective studies can be avoided), and does not require an HDR display for its application (to cater to the mentioned scenarios where HDR signal will be displayed directly on LDR devices). To address that, we present a method for HDR source content selection which can be easily implemented in software.
3. PROPOSED OBJECTIVE HDR SOURCE CONTENT SELECTION METHOD
We begin with the observation that HDR differs from LDR primarily in the way it stores scene information. Unlike LDR, HDR pixel values are related to physical luminance. Consequently, dark and bright scene regions are assigned values proportional to the actual scene intensity (this minimizes over and under exposure) instead of being saturated in an ad-hoc manner as is the case with LDR. This enables HDR to capture much higher contrast. In other words, HDR imaging enables capture of more scene details ranging from the ones corresponding to very high luminance (eg. sunlight) to those with low luminance levels (eg. shadows). A visual example is illustrated in Fig. 2 (c). In this
image, 8 regions with different luminance are marked from 1 to 8. We have also indicated the values proportional to the physical luminance corresponding to these regions. The keen reader may notice that the scene shown in Fig. 2 (c) has reasonably high contrast in that it has wide ranging luminance levels pertaining to different scene details. Notice that region 1 (waterfall) is the brightest while the region 3 (around tree trunk) has the lowest luminance. Further, other scene details correspond to varying luminance levels. Such scenes are expected to be more challenging for TMOs in terms of reducing the range and at the same time minimizing adverse impact on the visual quality of the resultant tone mapped scene. On the other hand, a scene with relatively lower overall contrast may be less challenging.
Thus, contrast information in HDR can be exploited as a reasonable strategy to enable objective selection of more challenging HDR content. For instance, in Fig. 2 (c) limiting the maximum luminance level to 10000 will destroy details in region 1 where the luminance value is more than 11000. It follows that further contrast reduction (limiting the maximum luminance) will successively damage scene details. However, while small contrast reduction affects scene details theoretically, it may or may not be perceptually relevant. In fact, the perceptual change in the HDR signal has to be above the visual threshold in order that human eyes detect such contrast changes. Therefore, our approach is based on analyzing the perceptual error due to incremental contrast reduction. Obviously, an HDR scene higher contrast will show up more perceptual error than the one with lower contrast. This information can then be exploited further via data mining tools. We now describe our proposed approach for selecting a more challenging set of source HDR content from a given pool of N HDR images.
i. Obtain a set of k contrast-reduced images for ith HDR image by adjusting the luminance with step size
∆
m.ii. Compare each contrast-reduced image with its
corresponding original HDR image and obtain a 2D perceptual error map. This will yield k perceptual error maps.
iii. Compute difference dm,i between two successive
error map and store it in a k-dimensional vector
{
mi}
i = d ,D (m = 1 to k-1) .
iv. Repeat the above steps for each ith source HDR image (i = 1 to N).
v. Analyze the difference matrix
[
]
N
D D D
M= 1, 2... in
which columns are formed from vector
i
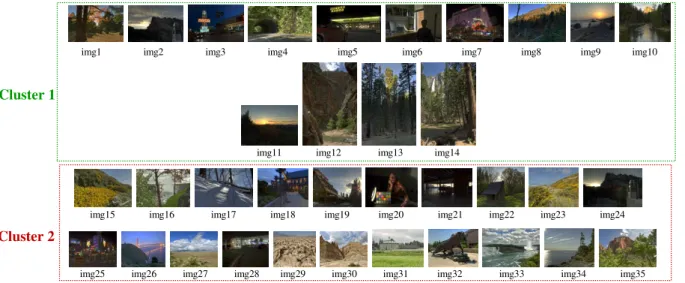
Fig. 1. Source images classified to Cluster 1 and Cluster 2 based on proposed approach. Note that these are tone mapped
versions of the actual HDR scenes. Figure best viewed in color.
4. IMPLEMENTATION DETAILS
In the previous section, we discussed the general idea behind our approach and outlined the steps to be carried out. In this section, we provide more specific details on the implementation of the proposed method (the notations used will be the same as in the previous section).
As mentioned, the first step is to generate a series of contrast-reduced images from the original HDR image. To this end, the simplest way is to limit the maximum luminance of the HDR scene linearly with a small step size ∆m. The next step is the analysis how incremental contrast reduction affects the visibility of details in the resultant HDR image. Towards that, each contrast-reduced image is compared with the original HDR image. We employed the objective method HDR-VDP-2. The HDR Visual Difference Predictor (HDR-VDP-2) [6] algorithm can be used for predicting the visibility of distortions (due to contrast reduction) in HDR images. Specifically, HDR-VDP-2 provides a 2D map containing the probabilities of detection at each pixel point: a higher detection probability suggests a higher distortion level at the specific point. In the third step, we compute the difference between the 2D perceptual error maps corresponding to successive contrast-reduced images. In this paper, we used the Kullback Leibler divergence based distance measure to obtain the difference between the 2D perceptual error maps. KLD is a measure of dissimilarity between two probability distributions and is defined as
( )
( )
( )
x P x P x P d m m m X x i m 1 + ∆ ∆ ∈ ∆∑
= log , where (m = 1 to k-1, i = 1 to N). mP∆ and P∆m+1represent the
2D perceptual error visibility maps at successive luminance levels and x represents the spatial coordinates of the pixel.
When the two error maps are strictly equal, the KLD value is zero. Obviously, the KLD values will be larger for images that are affected more (in terms of perceptual error visibility) due to contrast reduction and this can be used as a rough (approximate) indicator for selecting the more challenging content in terms of contrast. Nevertheless, for better theoretical analysis and obtaining a probabilistic indicator, we further exploited clustering based analysis. Specifically, we analyzed the difference matrix M=
[
D1,D2...DN]
,where{
mi}
i = d ,D , using Fuzzy C-Means clustering (FCM)
algorithm. The FCM algorithm [7] is an iterative clustering method that produces an optimal c partition by minimizing the weighted within group sum of squared error objective function FCM J
∑∑
= = = N y c z z y q zy FCM u dist x v J 1 1 ) , ( ) ( 2 where{
}
p n R x x xX= 1, 2,..., ⊆ is the data set in the p-dimensional vector space, N is the number of data items, c is the number of clusters with 2≤c <N,
zy
u is the degree of
membership of x in the zy th cluster, q is a weighting exponent on each fuzzy membership,v is the prototype of z
the centre of cluster z, dist2(xy,vz)is a distance measure between object
y
x and cluster centre v . z JFCMis minimized
iteratively and the details can be found in [7]. Apart from being a more theoretically grounded separation (clustering) of HDR content into two clusters (more challenging and less challenging HDR images), the FCM provides a membership
function matrix
{
}
zy
u
=
U where 0≤uzy ≤1. This provides
a fuzzy or probabilistic indication of the degree by which an
Cluster 2
Cluster 1
img1 img2 img3 img4 img5 img6 img7 img8 img9 img10
img11 img12 img13 img14
img15 img16 img17 img18 img19 img20 img21 img22 img23 img24
0 1 2 3 4 5 6 7 8 9 0 1 2 3 4 5 6 7 8 KLD values −−−−−> KLD values −−−−−> (a) (b) (c)
Fig. 2. (a) Cluster diagram, (b) and (c) luminance measurements in some regions of the two images1. Figure best viewed in color.
HDR image belongs to one of the two clusters. This is particularly useful in our case as it lends a kind of content selection scalability i.e. images with highest u values can zy
be selected first and depending on the requirements more HDR images can be chosen based on u values. Thus, zy
instead of hard classification of a given HDR image into two clusters, there is a probability value associated for better HDR source content selection.
5. EXPERIMENTAL ANALYSIS
In this section, we validate the proposed method on a set of publicly available HDR images. We also analyze specific cases to gain more insights into the experimental results.
5.1. Source HDR content
The HDR source content has been taken from the High-Dynamic-Range (HDR) Photographic Survey [8], a comprehensive collection of HDR photographs1 (some of which are accompanied by detailed colorimetric/luminance measurements and visual appearance scaling from the original HDR scenes). The images provide a range of content and challenges along with the fundamental data required to evaluate HDR imaging algorithms. The HDR images in this database were generated by multi-exposure fusion i.e. fusion of several LDR pictures at different exposures. We refer the reader to [8] for further details pertaining to this database. We would also like to point out that we chose this database primarily due to the fact that it includes the necessary data to obtain the approximate luminance values. This not only provides more precise scene information but also facilitates software implementation in
1
Available: http://www.cis.rit.edu/fairchild/HDR.html
that we can work directly in the physical luminance domain. A total of 35 source HDR images were used in our experiment and these are shown in Fig. 1. Note that these are tone mapped (using a local tone mapping operator) versions of the actual HDR content. The goal of the experiments was to separate these 35 (N = 35) images into two clusters, thereby identifying the more challenging ones for validating TMO based HDR processing algorithms.
5.2. Test Results
For the results reported in this paper, we set k = 10 i.e. 10 contrast reduced versions of each of the source HDR images were generated. This resulted in a total of 350 images to be employed for the said task. Following the procedure described in Section 3, we obtained the difference matrix M and applied the FCM algorithm.
The resulting cluster diagram is shown in Fig. 2 (a) where one can clearly notice two distinct clusters as well as the overlapping regions between the two. One can also see that there are three data points lying very close to the cluster boundaries (or in the overlapping regions). Note that the cluster diagram shown in Fig. 2 (a) can be obtained by plotting the corresponding data points with highest and second highest KLD values representing the x and y axes values respectively. Cluster 1 (with greater KLD values on both x and y axes) represents content with bigger KLD values and will therefore be relatively more challenging as compared to Cluster 2. Equivalently, the cluster diagram can be interpreted based on membership function values i.e. setting a threshold value of T=0.5 for the membership function values
zy
u . Such thresholding operation essentially
implies hard classification i.e. data points with membership function values
zy
u below T fall into one cluster and the
remaining points comprise the second cluster.
Cluster 2 Cluster 1 img14 img15 567 11100 977 51.3 1090 176 4000 4450 1330 121 2720 2120
The corresponding source HDR images (more accurately their tone mapped versions) in the two clusters are shown in Fig. 1. It is worth pointing out again that the two clusters are formed due to hard classification. As a result, some of the images (eg. img 21) which appear to be relatively more contrasted than other images within the cluster have been assigned to Cluster 2. However, the reader will recall that there is a probabilistic membership value available for each image in that 0≤uzy≤1. Specifically for img 21, we obtained uzy=0.4236 (which is closer to 0.5) and a classification based on lower threshold (eg. T=0.4) would categorize this image to Cluster 1. Therefore, depending on the desired number of source HDR content, more images can be chosen from the second cluster based on higher
zy
u (or equivalently lowering T ). Thus, our proposed
method represents a systematic and scalable objective approach to HDR source content selection.
5.3. Further Analysis
Pertaining to the results obtained based on the cluster diagram in Fig. 2 (a), it will be interesting to specifically analyze data points at extreme ends of the two clusters. We selected image corresponding to farthest data point in Cluster 1 (img14) as an example. As already discussed in Section 3, this HDR image has wide ranging luminance levels pertaining to different scene details (region 1 is the brightest while the region 3 around tree trunk has the lowest luminance). Similarly, we can select img15 which corresponds to one of the farthest data point in Cluster 2. For this image, the measurement values proportional to the physical luminance for few areas are shown in Fig. 2 (b) from which we can see that flowers (region 1) and sky (region 2) have similar luminance. Also notice that flowers and sky cover a large part of this image making it relatively uniform (lesser contrast). Thus, as indicated by the proposed method, these two images are different from each other in terms of contrast richness. Several other images in Cluster 2 also share such attributes (eg. img29 is mostly dazzlingly bright or img33 is misty leading to lesser contrast). Due to space limitations, we have shown small thumbnails of the images in this paper but we encourage the reader to refer to the database website for full resolution pictures.
5.4. Comparison with pixel based dynamic range
Pixel based dynamic range (or orders of magnitude) can be considered the simplest indicator of contrast in HDR content. It is defined as logarithm of the ratio of maximum to minimum luminance level. One problem is that by definition it depends only on the single brightest and darkest luminance values. Consequently, even if one pixel (or a very small region) has very small value, the orders of magnitude can assume high values. Also, in the limiting case, with a
luminance value close to zero the orders of magnitude will tend to infinity thereby making comparisons difficult. Another issue with orders of magnitude based indicator is its susceptibility to noise which can severely increase or decrease the values. On the other hand, the proposed approach takes into account the objective perceptual error in the entire image (based on context) in order to compute the separation (i.e. distance) between given HDR content. To compare the proposed method and the orders of magnitude, we first obtained the orders of magnitude for the 35 source HDR images. Since the hard classification in our approach categorized 14 (out of the 35) images in Cluster 1 (refer to Fig. 1), we selected the first 14 images corresponding to the higher orders of magnitude. We found that three of them had orders of magnitude as infinity (img5, img7 and img28). Further, only 6 images were in common with the proposed method. Thus, the orders of magnitude based indicator left out several content that were more challenging. An example was that of img10 and we have shown three tone mapped LDR versions of this image for comparison in the first row of Fig. 3. It can be seen that the three images appear different and preserve details very differently. For eg. in the first image (Fig. 3 (a)), only the mountain peak in the background is visible while the contrast in the foreground is lost (under exposed). In the second image (Fig. 3 (b)), while there is better contrast in the foreground, the details on the mountain peak are lost (i.e. over exposed in the background). Finally, the third image (Fig. 3 (c)) tends to have a better balance in terms of preserving details in foreground and background. In this example, we are not directly concerned with which tone mapping algorithm is better, rather to demonstrate that such source HDR content provides better differentiation between tone mapping algorithms. The counter example is that of img27 and the three tone mapped versions are shown in the second row of Fig. 3. We note that for this content, all the three tone mapping algorithms can retain similar contrast in all regions. Thus, selecting content such as img27 might lead to the conclusion that different tone mapping algorithms preserve similar amount of details. In contrast to this, selecting content such as img10 (which was not selected based on orders of magnitude indicator) will bring out clearer distinction on the merits and demerits of tone mapping algorithms. Such effects can occur in any TMO based HDR processing algorithm and therefore highlights the importance of selecting challenging source content as it can have significant impact on the eventual conclusions drawn.
6. PERSPECTIVES AND CONCLUDING REMARKS
Appropriate source content selection is a key step in validation studies and HDR imaging is no exception. As discussed and highlighted in the paper, the choice of source
(a) (b) (c)
(d) (e) (f)
Fig. 3. LDR versions of two source HDR images. Top row: Source HDR img10, Bottom row: Source HDR img27. Figure
best viewed in color. HDR content can have an impact on the results and analysis
of the validation study. Thus, the aim of this paper was not only to raise awareness about this issue but also present an automated method to that end. Our approach is based on visibility of perceptual error. A clustering based analysis was then carried out using the distance between the perceptual error maps. The proposed method was applied to a publicly available set of HDR content and the related analysis was presented. Being an objective method, it can be easily implemented in software to aid the process of source HDR content selection. The proposed method also benefits from the flexibility of fuzzy clustering thereby enabling its scalability.
While we demonstrated that our approach is reasonably effective, it is not without its limitations. First, being an objective approach it relies on the accuracy in the computation of perceptual error maps and also the effectiveness of the distance measure. Indeed, some of the source HDR content (eg. img20 and img28) categorized into Cluster 2 might be closer to content in Cluster 1. Second, in the current form, our approach does not include the impact of temporal contrast sensitivity and thus not very suitable for HDR video signal. Having mentioned that, frame-by-frame analysis of the source HDR video is still possible and could still provide valuable clues into the suitability of the HDR
video content.
Finally, we would like to stress that our approach is not meant to entirely replace subjective opinion. Rather it can serve as the first step by conveniently implementing and executing on a software platform allowing the flexibility to test a very large pool of potential source HDR content,
which would otherwise not be feasible
manually/subjectively. The results of clustering can then be analyzed based on pilot subjective study for instance.
7. REFERENCES
[1] ITU-T Recommendation P.910, “Subjective video quality assessment methods for multimedia applications”, 2008.
[2] Qualinet White Paper on Definitions of Quality of Experience (2012). European Network on Quality of Experience in Multimedia Systems and Services (COST Action IC 1003), P. Callet, S. Möller and A. Perkis, eds., Version 1.2, March 2013.
[3] F. Banterle, A. Artusi, K. Debattista, A. Chalmers, Advanced
High Dynamic Range Imaging: Theory and Practice. ISBN: 978-156881-719-4, AK Peters (CRC Press), Natrick, MA, USA. [4] M. Narwaria, M. Silva, P. Callet and R. Pepion “Tone mapping Based High Dynamic Range Compression: Does it Affect Visual Experience?”, Signal Processing: Image Communication, vol. 29, no. 2, pp. 257 -2773, 2014.
[5] SIM2 MULTIMEDIA S.p.A., http://www.sim2.com/HDR/ [6] R. Mantiuk, K. Jim, A. Rempel and W. Heidrich, “HDR-VDP-2: A Calibrated Visual Metric for Visibility and Quality Predictions in All Luminance Conditions”, in ACM Transactions on Graphics, vol. 30, no. 4, pp. Article no. 40, 2011.
[7] M. Yang, “A Survey of Fuzzy Clustering ”, Mathematical and
Computer Modelling, vol. 18, no. 11, pp. 1-16, 1993.
[8] M. Fairchild, “The HDR photographic survey ”, Proc. of