HAL Id: hal-02996919
https://hal.archives-ouvertes.fr/hal-02996919
Submitted on 11 Nov 2020
HAL is a multi-disciplinary open access
archive for the deposit and dissemination of sci-entific research documents, whether they are pub-lished or not. The documents may come from teaching and research institutions in France or abroad, or from public or private research centers.
L’archive ouverte pluridisciplinaire HAL, est destinée au dépôt et à la diffusion de documents scientifiques de niveau recherche, publiés ou non, émanant des établissements d’enseignement et de recherche français ou étrangers, des laboratoires publics ou privés.
Correlation analysis of solvent effects on solvolysis rates:
What can the empirical parameters of solvents actually
say?
Christian Laurence, Sergui Mansour, Daniela Vuluga, Julien Legros
To cite this version:
Christian Laurence, Sergui Mansour, Daniela Vuluga, Julien Legros. Correlation analysis of solvent effects on solvolysis rates: What can the empirical parameters of solvents actually say?. Journal of Physical Organic Chemistry, Wiley, 2020, 33 (9), pp.e4067. �10.1002/poc.4067�. �hal-02996919�
Correlation analysis of solvent effects on solvolysis rates:
what can the empirical parameters of solvents actually
say?
Christian Laurence,a,* Sergui Mansour,b Daniela Vuluga,c and Julien Legrosb,*
a
Université de Nantes, Laboratoire CEISAM, UMR 6230 CNRS, 44322 Nantes, France.
b
Normandie Univ, INSA Rouen, UNIROUEN, CNRS, COBRA, 76000 Rouen, France.
c
Normandie Univ, INSA Rouen, UNIROUEN, CNRS, PBS, 76000 Rouen, France.
Keywords: empirical solvent parameters; kinetics; linear free energy relationships; nucleophilic substitution; solvent effects; solvolysis.
ABSTRACT: The logarithm of heterolysis rates of 4-methoxyneophyl tosylate, Et3CBr, tert-BuCl, and tert-BuBr in a set of 12 to 28 hydrogen-bond (HB) and non-HB donor solvents are correlated to four sets of solvent parameters: (i) ET(30), (ii) π*, α , β, (iii) SP, SdP, SA, SB, and (iv) DI, ES, α1, β1. Disjointed results are found for Et3CBr because of an insufficient diversity of solvents. For the other solvolyses, the determination coefficients r2 are good to excellent, the gas-phase values are fairly predicted, and the contributions of various intermolecular forces to the global solvent effect agree satisfactorily within the four solvent sets. However, the most complete description of the solvent effect is given by the four-parameter sets because their parameters refer to a single intermolecular force, whereas ET(30) and π*correspond to a fixed blend of solute/solvent interactions. For the application of the DI, ES, α1, and β1 set to correlate tert-BuCl solvolysis, r2 = 0.976, lg k (gas) = −18.6 (experimental −19.3), and the contributions of HB donation (α1), electrostatic forces (ES), and dispersion-induction (DI) to the solvent effect amounts to 59%, 21%, and 14%, respectively. The dependence of rates on the solvent HB basicity is nearly zero. The inclusion of the solvent cohesive energy density parameter into the correlation equations does not improve these correlations.
Introduction
The influence of solvents on reaction rates is often dramatical 1,2 . Such is the case of the solvolysis/dehydrohalogenation reaction of halogenoalkanes 3,4. For example, the rate of heterolysis of tert-BuCl (2-chloro-2-methylpropane) is 1018 times faster in water than in the gas phase 5. The principal reason for this rate difference is the strong solvation of the transition structure. This solvation originates from intermolecular forces between the solute and the solvent. These forces are generally divided into non-specific long-range (dispersion, induction, and electrostatic) and short-range (exchange-repulsion and charge transfer) ones 6,7. Dispersion (London) forces occur between instantaneous dipoles (multipoles), induction forces
between permanent and induced dipoles (multipoles), and electrostatic forces between permanent dipoles (multipoles). Lewis acid/base interactions are specific interactions with a particular combination of these forces 8. Among them hydrogen bonding (HB) between a hydrogen-bond donor (HBD) and a hydrogen-bond acceptor (HBA) is the most prominent for organic solvents 9.
Empirical solvent parameters allow quantitative descriptions of these intermolecular forces and correlation analysis of the solvent effect on reaction rates can be performed 10. Among the host of solvent parameters proposed to chemists along the years 1, 11, the most popular is the Reichardt (R) parameter ET(30)
1,12, the most used are the Kamlet-Abboud-Taft (KAT) parameters π*, α, and β
13, and the most recent are the Catalán (C) parameters SP, SdP, SA, and SB 14, and the Laurence et al.(L) parameters DI, ES, α1, and β1 15. It has been shown that ET(30) is a fixed combination of only electrostatic forces and hydrogen-bond donation 16,17, whereas π* is a blend of dispersion, induction, and electrostatic forces 18. On the contrary, SdP and ES register only electrostatic forces 14,15. Dispersion and induction forces cannot be unravelled in the parameters SP and DI
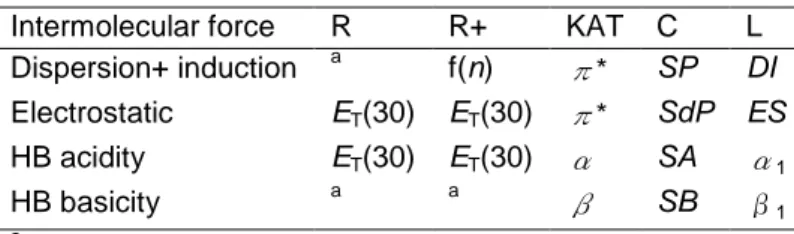
since both depend on the same solvent property, polarizability 6, 7,14,15. Lastly, parameters α, SA, and α1 measure the hydrogen-bond donation to solutes by HBD solvents (i.e. the hydrogen-bond acidity of solvents) 14,17,19, and β, SB, and β1 the solute HBD/solvent HBA interactions, that is the hydrogen-bond basicity of solvents 14, 20, 21. This interpretation of empirical solvent parameters in the language of intermolecular forces is summarized in Table 1.
Table 1. Registration of solute-solvent interactions by various sets of solvent parameters. Intermolecular force R R+ KAT C L
Dispersion+ induction a f(n) π* SP DI Electrostatic ET(30) ET(30) π* SdP ES HB acidity ET(30) ET(30) α SA α1 HB basicity a a β SB β1 a Not registered.
The molecular interaction energy is often decomposed into additive contributions of these fundamental interactions 22,23. In the same vein, the empirical solvent parameters are used additively through so-called linear solvation energy relationships (LSERs) 1,24,25. These LSERs take the form of eqs (1)-(5), when applied to Gibbs energies of activation (as lg k, where k is the rate constant). (1) lg k = a1ET(30) + lg k0
(2) lg k = a1ET(30) + a2 f(n) + lg k0 (3) lg k = s* + aα + bβ + lg k0
(4) lg k = diSP + eSdP + aSA + bSB + lg k0 (5) lg k = diDI + e ES + aα1 + bβ1 + lg k0
In eq (2), the Onsager function of the solvent refractive index, f(n) = (n2 −1)/( 2n2 + 1), is added to ET(30) to take into account the dispersion and induction forces not described by this parameter 16, 26-28. In the following, eqs (1)-(5) will be respectively referred as R, R+, KAT, C, and L equations. They will be solved through the multiple linear regression (MLR) method. The obtained regression coefficients measure the sensitivities of the rate constant to the various intermolecular forces. For example, the regression coefficients di, e, a, and b of eqs (4)-(5) indicate how the rate constant is sensitive to dispersion-induction, electrostatic, solute HBA/solvent HBD, and solute HBD/solvent HBA interactions, respectively. The intercept log k0 in eqs (1)-(5) can be attributed to the gas-phase value (the intrinsic reactivity) in so far as the solvent parameters all equal zero for the gas phase, as is the case for C and L equations. For KAT and R equations, we have to take into account the gas-phase values π*= −1.23 18 and ET(30) = 28 kcal.mol−129.
To these terms measuring solute-solvent interactions, a last term, h , measuring solvent-solvent interactions should be included to take into account a possible variation of the activation volume and/or solvent electrostriction 30. It measures solvent-solvent interactions through the solvent cohesive energy density
1,9 . Thus, for example, the KAT equation becomes: (3’) lg k = s* + aα + bβ + h + lg k0
The application of LSERs to the field of kinetic rates is difficult (compared to its application to spectroscopic properties or equilibrium constants for example) for two reasons. Firstly, it is more difficult to acquire kinetic data than spectroscopic data, so the number of solvents studied is often limited, and may be insufficient to conclude safely to the significance of each parameter in the multi-parameter eqs (1)-(5), and even more (1’)-(5’)(the apostrophe corresponds to the inclusion of the h term). Secondly, the structure of the transition state is often ill-known and may vary within a particular reaction mechanism; also, compared to equilibria where the structure of products is well-determined, it is less easy to interpret the magnitude and even the sign of the regression coefficients of eqs (1’)-(5’).
The interpretation of the results of correlation analysis of the solvent effect on solvolysis /dehydrohalogenation rates is characteristic of these difficulties 31, 32. For the same or similar substrates, some authors find a statistically significant cavity term 30, with a positive regression coefficient h, that they interpret by the electrostriction of solvent molecules around the cavity of the highly dipolar transition structure, whereas others do not 33. The regression coefficient b of the hydrogen-bond basicity term is found either not significant (interpreted by the absence of a nucleophilic assistance) 34, or significantly positive (nucleophilic assistance) 35, or significantly negative 3. Very recently, Moreira et al. have found that the regression coefficient e of the electrostatic term (SdP) in the application of the C equation to the solvolysis/dehydrohalogenation rates of tert-BuCl, tert-BuBr (2-bromo-2-methylpropane), and Et3CBr (3-bromo-3-ethylpentane) was not statistically
significant in a set of 21 HB and non-HB donating solvents 36. This result is unexpected, since the highly dipolar transition structures of these heterolytic reactions is more stabilized than their corresponding weakly dipolar substrates, and the rate should increase with increasing dipolarity (increasing SdP values) of the solvent. By extending the Moreira data set to 26 solvents by the addition of five dipolar non-HBD solvents, C and R were able to recover statistical significance for the regression coefficient of the SdP parameter in the solvolysis of tert-BuCl and tert -BuBr 37. These examples show that, in the correlation analysis of solvolysis rates with empirical solvent parameters, the statistical significance of regression coefficients is dangerously sensitive to the diversity of the solvent data set.
In this paper, we intend to apply our recently defined solvent parameters DI,
ES, α1, and β1 15 to solvolyses of the three halogenoalkanes studied by Moreira et al. 36. Their methods of definition are quite new compared to the solvatochromic methods of R and C, and to the averaging method of KAT. DI is a physical parameter (based on the refractive index of solvents), ES and α1 are PCM-DFT parameters for hydrogen-bond donor solvents 17, and β1 is a solvatomagnetic parameter 21. We do not hope that these new parameters will yield new mechanistic findings. We simply want to extract a consensus from the results of the five equations by applying all five eqs (1’)-(5’), i.e. without omitting the newly defined eq (5), to the same substrates, in the (quasi) same set of solvents, and with the same downward multi-step regression analysis (vide infra). We also want to show the limits, and the successes, of each set of solvent parameters. In this way, we hope to help the chemist correlating kinetic data to empirical solvent parameters to choose the most appropriate solvent scales among the host of literature scales and to interpret safely, i.e. without over- and/or mis-interpretation, the equations obtained. We first begin our analysis with the solvolysis of 4-methoxyneophyl tosylate 38. It is of particular significance because the mechanism is generally accepted. So it will serve to illustrate the approach subsequently used for the three halogenoalkanes.
Determination of new solvent parameters, statistical calculations,
and data choice
Determination of the L solvent parameters of four diols
One interest of our parameters is to be routinely determined for solvents not yet parameterized. Indeed they were obtained from reference processes: the measurement of the solvent refractive index for DI 15, a 19F solvatomagnetic comparison method for β1 21, the wavelength measurement of the solvatochromic band of the dye B30 (2,6-diphenyl-4-(2,4,6-triphenylpyridinium-1-yl)phenolate) for the
ES parameter of non-HBD solvents 16, and a theoretical solvatochromic comparison method for the ES and α1 parameters of HBD solvents 17. For this work, we extend the DI, ES, α1, and β1 scales to four diols, propane-1,2-diol, butane-1,2-diol, butane-1,3-diol, and butane-2,3-diol.
For β1,19F NMR measurements were performed as previously described 21 with chemicals (4-fluorophenol, 4-fluoroanisole, and the four diols) purified by standard methods.
The determination of ES and α1 requires PCM-DFT calculations of the S0 S1 molar electronic transition energy ET(30) of the dye B30. These calculations are not straightforward for non-theoreticians. So, we have devised a simpler method based on the McRae formulation of solvatochromic shifts 39 to partition ET(30) into an electrostatic and a HBD part. This simpler method, a semi-empirical solvatochromic comparison method, will be presented in a future work. The results of our determinations are presented in Table 2.
Table 2. Refractive index n, dispersion-induction parameter DI, electrostatic parameter ES, HB acidity parameter α1, and HB basicity parameter β1 for four diols.
Diol n DI ES α1 β1 Propane-1,2-diol 1.432 0.79 0.67 0.93 0.53 Butane-1,2-diol 1.438 0.79 0.65 0.85 0.58 Butane-1,3-diol 1.441 0.80 0.67 0.84 0.53 Butane-2,3-diol 1.431 0.79 0.64 0.80 0.56 Statistical calculations
They were performed by a least-squares MLR method. The experimentally observed lg ks are related to solvent parameters according to eqs (1’)-(5’) by means of a downward stepwise procedure. Solvent parameters are accepted or rejected one by one by means of a Student two-sided t-test on each regression coefficient at the usual 95% confidence level (CL) (i.e. there is 95% of chance that the regression coefficient does not equal zero), i.e. p ≤ 0.05 for the p-value corresponding to the t -value. The quality of prediction is judged by means of the determination coefficient r2
(since 100 x r2 yields the percent of variance of lg k explained by the solvent parameters). Prior to the stepwise procedure, pairwise correlation coefficients between the solvent parameters are calculated to check the absence of a significant collinearity for the studied solvent data set.
Solvent parameters may not have the same unit (ET(30) is in energy unit and
in energy/volume unit) and are often on different scales (from the gas phase to dimethyl sulfoxide f(n) ranges from 0 to 0.22, * from −1.23 to 1, ES and SdP from 0 to 1). Moreover, they do not vary by the same amounts for a given data set (in the data set of 28 solvents, the standard deviations of DI, ES, α1, and β1 are 0.067, 0.175, 0.510, and 0.151, respectively). Thus, it is not possible to determine the relative contributions of each solvent parameter to the explained variation in lg k
simply by examining the values of di, e, a, and b (for the example of eq (5)) obtained by the MLR method. However, this may be achieved by calculating the standardized regression coefficients which are defined in the statistics of MLR by the equation: (6) e’ = e x (σES / σlg k)
for the example of the coefficient e of the ES parameter in eq (5), where the apostrophe means “standardized”, the bars denote absolute magnitude, σES
represents the standard deviation of ES, and σlg k the standard deviation of lg k. This
procedure gives one standardized regression coefficients which can be compared to one another since they are on the same scale.
For convenience di’, e’, a’, and b’ are normalized in the way proposed by
Krygowski and Fawcett 40, 41, shown in eq (7) for the example of the coefficient e’:
(7) %ES = 100 e’ /( di’ + e’ + a’ + b’ )
Thus, %DI, %ES, % α1, and % β1 may be regarded as estimates of the percentage contributions from dispersion-induction, electrostatic, HBD, and HBA interactions, respectively, to the observed solvent effect.
Statistical calculations for the application of eqs (5)-(7) to correlate the logarithm of the 4-methoxyneophyl tosylate solvolysis rates are shown in detail in the supplementary material.
Kinetic data
For 4-methoxyneophyl tosylate, 15 rate constants have been compiled by Reichardt
1. Unfortunately, there is no ET(30) values , and consequently no ES and α1 values, for formic acid and acetic acid which protonates the probe, the dye B30, and acetic anhydride which reacts with B30. Consequently, we have limited the correlation analysis to 12 solvents: water, 2 alcohols, 3 weak CH HBDs, and 6 non-HBDs.
For tert-BuCl and tert-BuBr, the rate constants were those selected from the literature by Moreira et al. 36 and supplemented by their own kinetic measurements. We have added the data for two solvents, 1-pentanol and diethyleneglycol, measured by Gonçalves et al. 42. This enables to work with 28 solvents: water, 16 alcohols (among which the strong HBDs 2,2,2-trifluoroethanol and 1,1,1,3,3,3-hexafluoro-2-propanol), formamide (a NH HBD), nitromethane, acetonitrile, and acetone (weak CH HBDs), and 7 non-HBDs. Here, we assume (with most authors) that dehydrohalogenation in non-hydroxylic solvents and solvolysis in hydroxylic solvents have the same rate determining step (formation of a contact ion pair), so that hydroxylic and non-hydroxylic solvents are included in one correlation.
Experimental values in the gas phase for tert-BuCl (lg k = −19.3) and tert-BuBr (lg k = −16.7) at 25°C 43 are not included in the correlations for two reasons. Firstly, as the result of a long extrapolation from high temperatures they should be considered cautiously, and secondly, these minimal values might exert a leverage effect on the dispersion-induction term (for example DI=0 for the gas phase, and the standard deviation of DI values around an average of 0.73 is only 0.067). Nevertheless, these values might be usefully compared to the intercept lg k0 of correlation equations (1)-(5).
For Et3CBr, we have the rate constants newly measured by Moreira et al. 36 for 21 solvents: compared to the two previous ones, this solvent set is less well-balanced between HBD and non-HBD solvents since only 3 non-HBD solvents are
present, whereas the class of OH HBD solvents is over-represented by water and 14 alcohols.
In the supporting information, Table SI-1 collects the rate constants for the solvolyses of the four substrates studied.
Solvent parameters
ET(30) values (historically in kcal.mol−1) have been measured in Nantes (except those of 4 diols from Reichardt 1) and published as a database 16. The correct
measured value of 1,1,1,3,3,3-hexafluoro-2-propanol is 65.3 16 and not the literature calculated value of 62.1 kcal.mol−11.
It is difficult to trace the origin of the KAT parameters π*, α, and β, since they are arrived at by averaging solvent effects on diverse properties of many types of indicators 1,9. Moreover, because of the difficulty in “settling down” the averages, the values have changed along the years, sometimes dramatically. We have selected the values reviewed by Marcus 9. The π* scale measures a combination of dispersion, induction and electrostatic forces 18. The addition to π* of an indicator variable δ44 assigned to the class of aromatics (δ = 1) and polychloro-substituted solvents (δ = 0.5) permits to improve the quality of correlations, but does not prevent the regression coefficient s of the parameter π* in the KAT eq (3) to be sensitive to a combination of intermolecular forces, and, consequently, difficult to interpret.
On the contrary, the C parameters SP, SdP, SA, and SB, determined for 163 solvents 14 and the L parameters DI, ES, α1, and β1, determined for about 300 solvents 15 are based on clear definition processes and register a single intermolecular force (vide supra Table 1) except SP or DI for which dispersion and induction cannot be unravelled because both depend on the solvent polarizability. In this way, the regression coefficients (or better, the standardized regression coefficients) di, e, a, and b of eqs (4)-(5) yield the sensitivity of the rate constants to a single intermolecular force, and not to a combination of intermolecular forces, as done by ET(30) or π*.
The solvent cohesive energy density (divided by 103 to make it the same order of magnitude as the other solvent parameters) is taken from Marcus 9. The values of /103 (in J.cm−3) for the solvents of our data sets are generally between 0.3 and 1.0, being higher for self-associated alcohols. By far the largest value (2.3) is for water.
In the supporting information, Table SI-2 collects the solvent parameters used in this correlation analysis.
Results and discussion
Solvolysis of 4-methoxyneophyl tosylate
The reaction proceeds according to the accepted mechanism of Scheme 11. The observed rate of solvolysis is determined by the rate of ionization. Therefore, the
Gibbs energy of activation, as lg k1 (rate constant in s−1, at 75°C), has been used to characterize the “ionizing power” of solvents 38.
Scheme1. Mechanism of solvolysis of 4-methoxyneophyl tosylate
We have already shown 15 that this ionizing power originates from a combination of HB donation (50%, p ≤ 0.0001), electrostatic interactions (37%, p < 0.0001), and dispersion-induction (13%, p = 0.0003) (eq 8).
(8) lg k1 = 3.93(±0.66) DI + 4.04(±0.20) ES + 2.31(±0.11) α1 – 10.91(±0.46)
r2 = 0.996 n = 12
Neither the cohesive energy density (p = 0.56) nor the HB basicity (p = 0.11) is statistically significant.
The same non-significance is found for the parameters SB (p = 0.53) and (p = 0.31) in the C equation that yields:
(9) lg k1 = 4.75(±0.63) SdP + 3.03(±0.37) SA – 8.86(±0.51)
r2 = 0.955 n = 12
with a 52% contribution of HB donation and 48% of electrostatic forces. The dispersion-induction parameter SP is significant only at the 90% CL and has been rejected according to our required 95% level of significance.
The KAT equation (10) agrees with the previous analyses (no significant and β terms, and 54% of HB donation explaining the variance of lg k1)
(10) lg k1 = 3.83(±0.50) π* + 2.50 (±0.28) α – 7.73(±0.36)
r2 = 0.952 n = 12
However, the regression coefficient of the π* parameter provides less information than the three-parameter L eq (8) which allows the partition of dispersion-induction and electrostatic forces.
The single-parameter R equation is less predictive than the three previous ones, since the determination coefficient r2 falls to 0.926. However, if we add the f(n) parameter measuring dispersion-induction forces not taken into account by ET(30), we obtain the second better correlation with eq (11):
(11) lg k1 = 21.2(±4.2) f(n) + 0.21(±0.01) ET(30) – 18.04(±1.07)
r2 = 0.981 n = 12
with a good significance for the f(n) parameter (p = 0.0007), whereas is clearly again not significant ( p = 0.34). Interestingly, the contribution of dispersion-induction is found to be 19%, in fair agreement with the 13% contribution obtained with the L equation.
The intercept lg k0 in eqs (8) and (9) can be attributed to the gas-phase value. For eqs (10) and (11), the gas-phase values are calculated from lg k0 and π*(gas) and ET(30)(gas) . The results −10.9 (±0.5)(L), −8.9(±0.5)(C), −12.4(±1.0)(KAT), and −12.1(±1.4) (R+) are in fair agreement and show the decrease of reactivity going from the less solvating solvent Et2O (lg k1 = −7.3) to the gas phase.
In summary, correlation analysis with empirical solvent parameters permits an excellent prediction of the solvent effect on the rate of ionization of 4-methoxyneophyl tosylate (r2 = 0.996) and the estimation of a gas-phase value that can serve as a point of comparison to the theoretician. It shows that HB basicity and cohesive energy density do not play a significant role. The significant solute-solvent interactions governing the rate acceleration are HB donation (50%), electrostatic interactions (37%), and dispersion-induction forces (13%). These results are consistent with a ion pair transition structure stabilised by (i) hydrogen bonding to the tosylate anion, (ii) electrostatic interaction between the high dipole moment of the ion pair and permanent dipole moment of the solvent molecules, and, not to be forgotten, (iii) interaction between the permanent dipole moment of the ion pair and the dipole moment induced in the polarizable solvent molecules.
Solvolysis of Et3CBr
The solvolysis/dehydrohalogenation reaction possibly proceeds according to Scheme 2 1.
Scheme 2. Transition structure for the solvolysis of Et3CBr(R=Et and X=Br)
The Gibbs energy of activation, as lg k2 (rate constant in s−1, at 25°C), is weakly correlated to ET(30) (r2 = 0.799 for 21 data points). The addition of f (n) does not yield a significant regression coefficient (p = 0.91) and so does not improve the determination coefficient. The addition of the parameter provides a better correlation (r2 = 0.853) with a significant positive regression coefficient h (p = 0.020) and the contribution of the h term amounts to 25%. However, the exclusion of the datum for water raises the p-value of the h coefficient to 0.340, so that the CL on the
h coefficient falls from 98% to 66%. We conclude to a leverage effect of water by virtue of its maximal δH2 value and to the absence of significance of the h coefficient. In the KAT eq (3’) all regression coefficients are significant in a first step: h (p
= 0.004), s (p < 0.0001), a (p < 0.0001), and b (p = 0.001). Excluding water, the p -value of the h coefficient increases to 0.423, so there may be a leverage effect of water. Thus the KAT equation becomes for all 21 data points:
(12) lg k2 = 5.10(±0.51) π* + 2.38 (±0.21) α − 0.98 (±0.39) β – 8.38(±0.60)
We remark the rate-decelerating effect (negative b coefficient, p = 0.022) of the solvent HB basicity, with a contribution of 11% to the solvent effect. On the contrary, HB donation (α) and dispersion, induction and electrostatic interactions (π*) are rate-accelerating, and contribute respectively to 47% and 42%.
For the C equation, the first rejected parameter in the downward stepwise regression is SdP (p = 0.662) (this confirms the previous calculation by Moreira et al
36), and the second one is (p = 0.370). The final equation is:
(13) lg k2 = 4.27(±1.24) SP + 3.79(±0.36) SA – 2.64(±0.39) SB – 6.76(±0.95)
r2 = 0.945 n = 21
Again, a significant and negative regression coefficient b is found for the parameter
SB describing the HB basicity of solvents. From the standardized regression coefficients a’, b’, and di’, we calculate contributions to the solvent effect of 53% for
the HB donation, 32% for the HB basicity, and 15% for dispersion-induction interactions.
With the L set of solvent parameters, the first rejected parameter is DI (p = 0.181), then β1 (p = 0.125), and lastly (p = 0.099). The final equation is: (14) lg k2 = 7.29(±1.20) ES + 3.16(±0.27) α1 – 11.76(±1.05)
r2 = 0.890 n = 21
with contributions of 66% for HB donation and 34% for electrostatic forces.
Table 3 summarizes the results of the correlation analyses through eqs (2’)-(5’).
Table 3. Contributions of intermolecular forces to the solvent effect on the solvolysis/dehydrobromination of Et3CBr and calculated lg k gas-phase value.
Set Dispersion-Induction Electrostatic HB donation HB basicity Cohesive energy density Gas phase R b 100% b c −9.2 KAT 42% 47% 11% c −14.7 C 15% a 53% 32% a −6.8 L a 34% 66% a a −11.8 a
Not significant b Not registered c H2O leverage. Term excluded from the correlations.
No consensus emerges from these four sets of solvent parameters, except the rate-accelerating contribution (between 47 and 66%) of the solvent HB donation. Also, the calculated gas-phase lg k2 values are found in a large range, so they would be hardly useful to the theoretician. The most deceiving result, because without any possible chemical interpretation, is the conclusion of the C analysis that electrostatic forces (SdP parameter) do not influence the rate. C and R have attributed this result to an inadequate solvent sampling in the Et3CBr set, and not to an inadequecy of the C solvent parameters 37. The following correlation analysis of the solvolysis/dehydrohalogenation of tert-BuCl and tert-BuBr bearing on a more numerous and better-balanced (between HBD and non-HBD solvents) solvent sample should permit to test this explanation.
Solvolysis of tert-BuCl
The Scheme 2 (R=Me and X=Cl) remains valid for this solvolysis. The results of the multi-step MLR of lg k3 (rate constant in s−1, at 25°C) into the various sets of solvent parameters are: (15) lg k3 = 0.33(±0.01) ET(30) – 23.51(±0.68) r2 = 0.957 n = 28 (16) lg k3 =0.34(±0.01) ET(30) + 17.73(±5.17) f(n) – 27.50(±1.30) r2 = 0.971 n = 28 (17) lg k3 = 6.71(±0.35) * + 4.01(±0.15) α + 0.81(±0.30) β− 14.61(±0.34) r2 = 0.981 n = 28 (18) lg k3 = 5.45(±1.65) SP + 3.70(±0.67) SdP + 7.28(±0.40) SA – 16.49(±1.10)
r2 = 0.963 n = 27 (no parameters for diethyleneglycol)
(19) lg k3 = 8.15(±1.55) DI + 4.71(±0.50) ES + 4.46(±0.19) α1 – 1.44(±0.67) β1 – 18.62(±1.06)
r2 = 0.976 n = 28
In eq (19) the negative regression coefficient of the hydrogen-bond basicity term (β1) is hardly significant (p = 0.044) and the b β1 contributes very slightly (6%) to the variance of lg k3. Figure 1 illustrates the excellent correlation (19) with the L parameters and the good correlation (15) with ET(30).
Figure 1. Logarithm of solvolysis rate constants k (s−1) for tert-BuCl against L parameters (left) and
ET(30) (right). Red, orange, yellow, green, and white circles correspond respectively to OH HBD, NH
HBD, CH HBD, non-HBD solvents, and gas phase.
Table 4 compares the intermolecular forces at play as well as the gas-phase values furnished by each model.
Table 4. Contributions of intermolecular forces to the solvent effect on the solvolysis/dehydrochlorination of tert-BuCl and calculated lg k gas-phase values.
Set Dispersion-induction Electrostatic HB donation HB basicity Cohesive energy density Gas phase R+ 11% 89% a c −17.9 KAT 39% 55% 5% c −22.9
C 12% 20% 68% b b −16.5
L 14% 21% 59% 6% c −18.6
a
Not registered b Not significant c H2O leverage. Term excluded from the correlation.
To sum up, there is a good agreement between the contributions of intermolecular forces. It is satisfactory that the sum of electrostatic and hydrogen-bond donation found in the C and L models (80 to 88%) agrees with the 89% of the R+ model, and that the sum of dispersion-induction and electrostatic forces yield by the C and L models (32 to 35%) is in line with the 39% of the KAT model. The L gas-phase value (−18.6) compares well to the experimental lg k3 = −19.3 42. Last but not least, the SdP parameter becomes significant in the C equation. It appears that a more numerous and better-balanced set of solvents than the one available for Et3CBr permits each set of solvent parameters to yield results in chemical agreement with a transition structure more solvated than the reactants by three interactions: (i) HB donation to the leaving chloride anion (55 to 68%), (ii) electrostatic interaction between the solvent dipole moment and the highly dipolar transition structure (20 to 21%), and (iii) induction interaction caused by the dipole moment induced in the polarisable solvent by the transition structure (12 to 14%).
Solvolysis of tert-BuBr
The correlation analysis of the logarithm of the solvolysis rates k4 (in s−1, at 25°C) of
tert-BuBr (Scheme 2 with R=Me and X=Br) with the R+, KAT, C, and L parameters for 28 solvents is summarized in eqs (20)-(23) and Table 5.
(20) lg k4 =0.28(±0.02) ET(30) + 17.94(±7.17) f(n) – 22.26(±1.80)
r2 = 0.918 n = 28
(21) lg k4 = 6.41(±0.40) * + 2.90(±0.17) α – 11.18(±0.30)
r2 = 0.961 n = 28
(22) lg k4 = 5.00(±1.52) SP + 4.54(±0.61) SdP + 5.36(±0.37) SA – 14.13(±1.01)
r2 = 0.954 n = 27 (no parameters for diethyleneglycol)
(23) lg k4 = 6.87(±1.78) DI + 5.41(±0.57) ES + 3.22(±0.22) α1 – 1.70(±0.77) β1 – 15.26(±1.22)
r2 = 0.955 n = 28
Table 5. Contributions of intermolecular forces to the solvent effect on the solvolysis/dehydrobromination of tert-BuBr and calculated lg k gas-phase values.
Set Dispersion-induction Electrostatic HB donation HB basicity Cohesive energy density Gas phase R+ 13% 87% a c −14.5 KAT 48% 52% b c −19.1 C 13% 29% 59% b b −14.1 L 14% 29% 50% 8% c −15.3 a
Not registered b Not significant c H2O leverage. Term excluded from the correlation.
In the L model, we find again a negative regression coefficient for the hydrogen-bond basicity with a low level of significance (p = 0.039) compared to the
other parameters (p < 0.0002) and a low contribution (8%) to the solvent effect. With the exception of this peculiarity, all models agree well. The prediction of rates is excellent with the KAT, L, and C models (r2> 0.95), and the L model provides the gas-phase value (−15.3) closest to the experimental lg k = −16.7 43 .
The comparison of tert-BuCl (Table 4) and tert-BuBr (Table 5) shows that the response of lg k to HB donation is more important for the chloroalkane for all models. This is the consequence of a larger HB basicity of the chloride anion than of the bromide anion. Indeed, on the pKBHX scale of HB basicity 8, 45, the ion pairs NBu4+Cl− and NBu4+Br− have pKBHX values of 4.30 and 3.57 respectively. On the contrary, the response to electrostatic interactions is more important for the bromoalkane, indicating a more dipolar transition structure for this substrate.
Conclusions
Eighty-nine solvolysis rate constants of four substrates have been correlated to the newly defined DI, ES, α1, and β1 solvent parameters for the first time. The rate constants calculated in the absence of solvent are close to the experimental gas-phase values for tert-BuCl and tert-BuBr. The quality of prediction of rate constants is excellent (r2 > 0.95) for three solvolyses out of four. For the solvolysis of Et3CBr the value of r2 is only 0.890, compared to r2 = 0.945 with the C parameters. However the C equation leads to a result chemically incorrect (no contribution of electrostatic interaction to the solvent effect), whereas the L parameters yield a significant electrostatic contribution (34%) to the solvent effect, as chemically expected.
The contribution of intermolecular forces to the solvent effect is found in the order: HB donation > electrostatic forces > dispersion-induction. HB donation contributes to more than 50% of the solvent effect. The advantage of the four-parameter L equation over the three-four-parameter KAT equation is to disentangle the dispersion-induction from the electrostatic forces. So, one finds a significant contribution (12 to 14%) of the DI parameter to the variance of lg k. Therefore, the adage that solvolyses with more dipolar transition structures than the reactants are accelerated by dipolar solvents should be supplemented as follows: the rate is accelerated by dipolar and polarizable solvents 46.
The advantage of the L equation over the R or R+ equations is to partition
ET(30) into an electrostatic parameter ES and a HBD parameter α1 for HBD solvents. The success of the single-solvent parameter ET(30) (e.g. r2 = 0.957 for the solvolysis of tert-BuCl, whereas r2 = 0.946 with the four-parameter C equation) is circumstantial. Application of ET(30) that depends on HB donation and electrostatic forces to solvolysis rates that also depend mainly on these two interactions will give a good correlation. However, ET(30) may fail in other circumstances. For example, it does not give a significant correlation (r2 = 0.431, n = 14) with the solvent-dependent alkylation rate of the betaine dye B30 47,48. On the contrary, the L equation yields
Consequently, ET(30), that describes electrostatic forces of non-HBD solvents, cannot be useful when electrostatic forces play no role in the solvent effect.
The search for a statistically significant positive b regression coefficient in the equations (3)-(5) was generally unsuccessful with all three solvent hydrogen-bond basicity parameters β1, β and SB. This suggests the absence of a nucleophilic assistance in the solvolyses of the three halogenoalkanes studied, but only if HB basicity is related to carbocation basicity. We have assembled a set of methyl cation affinities (MCA) 49-51 in order to study this relationship. For 16 bases, the determination coefficient between MCA and β1 is only 0.128 and for 8 oxygen bases, r2 = 0.206. We conclude that β1 is not a descriptor of the carbocation basicity (see also Table 5 of reference 31) and so cannot be useful in the debate on the existence of nucleophilic assistance. A negative dependence on β1 exists for solvolyses of tert-BuCl and tert-BuBr. Its contribution to the solvent effect is small (6% and 8%) and the mechanistic explanation (if any) will not be discussed.
The inclusion of a h term to eqs (1)-(5) applied to the four substrates is not statistically significant (taking into account, for a few correlations, the leverage effect of water which has by far the largest value). We conclude that the solvent cohesion does not influence the rates of the four solvolyses studied.
In further correlation analyses of the solvent effect on solvolysis rates, and more generally on chemical reactivity, we finally suggest that it is now appropriate to go beyond the ET(30) and KAT solvent parameters. The four-parameter sets SP,
SdP, SA, SB, and DI, ES, α1, β1 are proposed as a third choice. Their main advantage is to describe a single intermolecular force (see Table 1) and consequently to yield quantitative contributions of each molecular interaction to the global solvent effect.
Acknowledgements
JL and SM are grateful to La Fondation Dassault Systèmes for a grant in the frame of the project 3DECON. The authors from Normandie Université also thank the Labex SYNORG (ANR-11-LABX-0029) and the Région Normandie for financial support.
Supporting Information
Table SI-1: Solvolysis rate constants for 4-methoxyneophyl tosylate, Et3CBr, tert -BuCl, and tert-BuBr. Table SI-2: R, KAT, C, and L solvent parameters. Table SI-3: Example of statistical calculations.
1 C. Reichardt, T. Welton, Solvents and Solvent Effects in Organic Chemistry, 4th edn, Wiley-VCH, Weinheim, 2011.
2 E. Buncel, R. A. Stairs, Solvent effects in Chemistry, 2th edn, Wiley,Hoboken, USA, 2016.
3 G. F. Dvorko, E. A. Ponomareva, M. E. Ponomarev, J. Phys. Org. Chem. 2004,
17, 825.
4 G. F. Dvorko, E. A. Ponomareva, M. E. Ponomarev, V. V. Zaliznyi, I.V. Koschchii,
Russ. J. Gen. Chem. 2007, 77, 1535.
5 M. H. Abraham, R. W. Taft, M. J. Kamlet, J. Org. Chem. 1981, 46, 3053.
6 A. D. Buckingham, P. W. Fowler, J. M. Huston, Chem. Rev.1988, 88, 963.
7 A. J. Stone, The Theory of Intermolecular Forces, Clarendon Press, Oxford, U. K.,
1996.
8 C. Laurence, J. F. Gal, Lewis Basicity and Affinity Scales. Data and Measurement, Wiley, Chichester, U. K., 2010.
9 Y. Marcus, The Properties of Solvents, Wiley, Chichester, U. K., 1998.
10 J. Shorter, Correlation Analysis of Organic Reactivity, Research Studies Press, Wiley, Chichester, U. K., 1982.
11 A. R. Katritzky, D. C. Fara, H. Yang, K. Tämm, T. Tamm, M. Karelson, Chem. Rev. 2004, 104, 175.
12 C. Reichardt, Pure Appl. Chem. 2008, 80, 1415.
13 M.J. Kamlet, J. L. M. Abboud, M. H. Abraham, J. Org. Chem. 1983, 48, 2877.
14 J. Catalán, J. Phys. Chem. B2009, 113, 5951.
15 C. Laurence, J. Legros, A. Chantzis, A. Planchat, D. Jacquemin, J. Phys. Chem. B 2015, 119, 3174.
16 J. P. Cerón-Carrasco, D. Jacquemin, C. Laurence, A. Planchat, C. Reichardt, K. Sraïdi, J. Phys. Org. Chem.2014, 27, 512.
17 J. P. Cerón-Carrasco, D. Jacquemin, C. Laurence, A. Planchat, C. Reichardt, K. Sraïdi, J. Phys. Chem. B 2014, 118, 4605.
18 C. Laurence, P. Nicolet, T. Dalati, J. L. M. Abboud, R. Notario, J. Phys. Chem.
1994, 98, 5807.
19 R. W. Taft, M. J. Kamlet, J. Am. Chem. Soc. 1976, 98, 2886.
20 R. W. Taft, M. J. Kamlet, J. Am. Chem. Soc. 1976, 98, 377.
21 C. Laurence, J. Legros, P. Nicolet, D. Vuluga, A. Chantzis, D. Jacquemin, J. Phys. Chem. B2014, 118, 7594.
22 K. Kitaura, K. Morokuma, Int. J. Quantum Chem.1976, 10, 325.
23 I. C. Hayes, A. J. Stone, Mol. Phys.1984, 53, 83.
24 M. J. Kamlet, R. W. Taft, Acta Chem. Scand. Part B1985, 39, 611.
25 M. J. Kamlet, R. M. Doherty, G. R. Famini, R. W. Taft, Acta Chem. Scand. Part B1987, 41, 589.
26 C. Laurence, P. Nicolet, C. Reichardt, Bull. Soc. Chim. Fr.1987, 125.
27 C. Laurence, P. Nicolet, M. Luçon, C. Reichardt, Bull. Soc. Chim. Fr. 1987, 1001.
28 C. Laurence, P. Nicolet, M. Luçon, C. Reichardt, J. Chem. Soc. Perkin Trans. 2
1989, 873.
29 S. Budzák, T. Jaunet-Lahary, A. D. Laurent, C. Laurence, M. Medved’, D. Jacquemin, Chem. Eur. J.2017, 23, 4108.
30 M. H. Abraham, R. M. Doherty, M. J. Kamlet, J. M. Harris, R. W. Taft, J. Chem. Soc. Perkin Trans. 21987, 913.
31 T. W. Bentley, M. S. Garley, J. Phys. Org. Chem.2006, 19, 341.
32 J.J. Gajewski, J. Am. Chem. Soc. 2001, 123, 10877.
33 S. P. McManus, S. Somani, J. M. Harris, R. A. McGill, J. Org. Chem. 2004, 69, 8865.
34 M. H. Abraham, R. W. Taft, M. J. Kamlet, J. Org. Chem. 1981, 46, 3053.
35 J. Catalán, C. Diaz, F. Garçía-Blanco, J. Org. Chem.1999, 64, 6512.
36 L. Moreira, M. Reis, R. Elvas-Leitão, M. H. Abraham, F. Martins, J. Mol. Liquids
2019, 291, 111244.
37 J. Catalán, C. Reichardt, J. Mol. Liquids2020, 298, 111922.
38 S. G. Smith, A. H. Fainberg, S. Winstein, J. Am. Chem. Soc.1961, 83, 618.
39 E. G. McRae, J. Phys. Chem.1957, 61, 562.
40 W. R. Fawcett, J. Phys. Chem.1993, 97, 9540.
41 T. M. Krygowski, W. R. Fawcett, J. Am. Chem. Soc. 1975, 97, 2143.
42 R. M. C. Gonçalves, A. M. N. Simões, L. M. P. C. Albuquerque, J. Chem. Soc. Perkin Trans. 21991, 825.
43 A. Maccoll, Chem. Rev.1969, 69, 33.
44 R. W. Taft, J. L. M. Abboud, M. J. Kamlet, J. Am. Chem. Soc.1981, 103, 1080.
45 C. Laurence, K. A. Brameld, J. Graton, J. Y. Le Questel, E. Renault, J. Med. Chem. 2009, 52, 4073.
46 For example, ethyl benzoate (DI = 0.87) should more accelerate the solvolysis rate of tert-BuCl than ethyl acetate (DI = 0.71): the calculated lg k3 is −9.9 (from eq 19) as compared to the experimental value of −11.5 for ethyl acetate (the rate becomes 40 times higher).
47 C. Reichardt, R. Müller, Liebigs Ann. Chem.1976, 11, 1953.
48 W. Linert, B. Strauss, E. Herlinger, C. Reichardt, J. Phys. Org. Chem. 1992, 5, 275.
49 Cation basicity (Gibbs energy) is related to cation affinity (enthalpy of basicity) (see ref. 8).
50 J. F. Gal, Thermodynamic Treatments of Lewis Basicity, in E. Vedejs, S. E. Denmark (Eds): Lewis Base Catalysis in Organic Syntheses. Wiley-VCH, Weinheim, Germany, Vol.1, Chapter 3, p. 55-84.