(Accepted on January 20, 2016 by Academic Medicine) IS SCIENCE BUILT ON THE SHOULDERS OF WOMEN?
Macaluso, Benoit MS; Larivière, Vincent PhD; Sugimoto, Thomas MPA; Sugimoto, Cassidy R. PhD
Author Information
Benoit Macaluso is researcher, Observatoire des sciences et des technologies, Université du
Québec à Montréal; Montréal, Québec, Canada.
Vincent Larivière is Canada Research Chair on the Transformations of Scholarly
Communication, Université de Montréal; scientific director, Érudit journal platform; and
associate scientific director, Observatoire des sciences et des technologies, Université du Québec à Montréal; Montréal, Québec, Canada.
Thomas Sugimoto is researcher, Center for Education and Evaluation Policy, Indiana University
Bloomington; Bloomington, Indiana, USA.
Cassidy R. Sugimoto is associate professor, School of Informatics and Computing, Indiana
University Bloomington; Bloomington, Indiana, USA.
Correspondence should be addressed to Cassidy R. Sugimoto, School of Informatics and Computing, Indiana University Bloomington, 919 E. 10th Street, Bloomington, IN 47408; telephone : (812) 856-2323; e-mail : sugimoto@indiana.edu
ABSTRACT
Purpose: Women remain underrepresented in the production of scientific literature and
relatively little is known regarding the labor roles played by women in the production of
knowledge. This research examines these labor roles, using contributorship data from science
and medical journals published by the Public Library of Science (PLOS). PLOS journals require
each author to indicate their contribution to one or more of the following tasks: (1) Analyzed the
data; (2) Conceived and designed the experiments; (3) Contributes reagents/materials/analysis
tools; (4) Performed the experiments; and (5) Wrote the paper.
Method: We analyzed contribution data from more than 85,000 articles published between 2008
and 2013 in PLOS journals with respect to gender using both descriptive and regression
analyses.
Results: Gender is a significant variable in determining the likelihood of performing a certain
task associated with authorship. Women are significantly more likely to be associated with
performing experiments and men are more likely to be associated with all other authorship roles.
This holds true controlling for age: although experimentation is associated with academically
younger scholars, the gap between male and female contribution to this task remains constant
across academic age. Inequalities are observed in the distribution of scientific labor roles.
Conclusions: These disparities have implications for the production of science, the evaluation of
scholars, and the ethical conduct of science. Adopting the practice of identifying contributorship
rather than authorship in scientific journal will allow for greater transparency, accountability, and
Introduction
What constitutes women’s work in science? The rhetoric of the “unique” and “special” talents of
women relegated them to roles as amateurs and technical assistants in the production of
knowledge in the early 20th century.1 This secondary role was sustained by the relative
underproduction and subsequent attrition of women in the labor market and the hierarchical
nature of scientific inquiry promoted in the Big Science era. In contemporary science and
medicine, women are matriculating at a greater rate than men, but still remain underrepresented
in the production of science.2 Furthermore, very little is known about the labor roles played by
women and whether sex segregation in scientific production persists, despite claims for
universalism in science.3
The inability to conduct large-scale analyses on this question has been largely a function
of the idiosyncratic authorship practices of the 20th century, which provided authors on a byline
(ordered in various ways, by disciplinary practice), without an acknowledgment of actual
contributions.4 These practices have led to several concerns—most notably the lack of public
accountability of authors when issues of fraudulent research arise and the prevalence of ghost
and honorific authorship. To counter this, medical journal editors have been proactive in arguing
for greater specificity around authorship roles: for example, the International Committee on
Medical Journals Editors (ICMJE) Recommendation includes explicit criteria for what
constitutes authorship on a paper.5
However, practices of ghost and honorific authorship continue6-7 as these standards fail to
capture the precise roles played by each author on the paper—an issue that is further complicated
by rising rates of hyperauthorship.8 The notion of replacing authorship with contributorship was
be listed by their roles, rather than in a ranked order. Fifteen years later, a few journals have
begun to include contributor information, without abandoning the byline. Some have done this
systematically (e.g., JAMA), but most collect data idiosyncratically—either in the form of
acknowledgements or by providing an open field for specifying contributions (e.g., the BMC
Medical Education journal). The lack of systematic data collection limits large-scale data mining.
The Public Library of Science (PLOS) is one early adopter of the practice of identifying
author contributions. PLOS, a nonprofit open access publisher of seven high-impact journals,
provides criteria for authorship and requests that the contribution of each author on the byline be
identified in the following ways: (1) Analyzed the data; (2) Conceived and designed the
experiments; (3) Contributes reagents/materials/analysis tools; (4) Performed the experiments;
and (5) Wrote the paper. Each author can be assigned to one or more of these roles (other roles
have been present historically; however, those enumerated represent the five main categories).
In this study, we analyze the contribution data found in 85,260 articles published between
2008 and 2013 in PLOS journals with respect to gender (controlling for variables such as
discipline, authorship status, academic age, discipline, team composition, and country of author).
Specifically, we seek to address whether there are gendered differences in scientific labor roles.
This allows us to reveal, for the first time, a large-scale analysis of the differing roles played by
the sexes in contemporary knowledge production.
Methods
Two sources of data are used: Thomson Reuters’ Web of Science (WoS) and all articles
published by PLOS, available on the PLOS website in XML format. As of 2014, WoS covered
more than 50 million articles published in almost 20,000 journals. PLOS has published 8
peer-reviewed scientific journals, largely in the biomedical area: PLOS Biology (founded in 2003),
PLOS Medicine (2004), PLOS Genetics (2005), PLOS Computational Biology (2005), PLOS Pathogens ( 2005), PLOS ONE (2006), and PLOS Neglected Tropical Diseases (2007). PLOS Clinical Trials was published in 2006 and 2007 only. Nearly 95% of the articles used in this study were classed as biomedical (41.8%), clinical medicine (44.9%), or biology (7.9%).
The document object identifies (DOIs) for PLOS articles are provided in Article-Level
Metrics, which was used to match each PLOS article with the corresponding record in WoS. (For
a full description of this matching process, see the supplemental document.)
The dataset of PLOS articles, including authors’ contributions as well as all WoS
metadata, served as the sampling frame for the study. From this, any document types that were
not standard articles and review articles were excluded. Furthermore, only articles published
between 2008 and 2013 were included, as WoS only provided full first names from this time
period. The journal PLOS Clinical Trials was excluded from the analysis, as it did not publish
any articles during the period covered. Also excluded were articles lacking contributorship data
(n=962) as well as those for which a match could not be established between PLOS and WoS
(n=369). Four duplicates were also excluded. The final dataset included 85,260 articles published
in seven PLOS journals between 2008 and 2013, for which we managed to establish a link
between the PLOS and the WoS record.
The data underwent several rounds of processing before analysis. First, the contributions field
had to be parsed to extract contribution type. There are several formats in which this could
appear, so specialized code had to be developed for this. One of the unique features is that
authors are listed by initials, rather than names, so the initial had to be matched back to author
names (see online-only supplemental document). Academic age and gender were assigned to the
authors, based on full name data. The gender of authors was given based on the gender
assignation tables develop in Larivière et al.2 This list uses given names and country
combinations to assign gender to authors of articles. On the whole, this conversion list managed
to assign a gender to 88.1% of authorships (i.e., author-paper combinations) of which 32.5%
were female and 55.7% were male. Initials and unisex names accounted for 0.2% and 2.7%
respectively, while the unknown rate was 8.9% (similar to what was found in Larivière et al.2 for
all WoS (i.e., 8.4%).
Academic age of authors was estimated using their year of first publication, as recorded
in WoS. In order to obtain such age, authors found in the WoS were disambiguated automatically
by the Center for Science and Technology Studies (CWTS, Leiden University) using the
algorithm developed by Caron and van Eck.10 Given that the majority of authors had less than 30
years of publication experience, the analyses for this paper focuses on those who have between
zero (i.e., the first year in which a contributor was listed on a paper) to 30 years. It should be
noted that, throughout the paper, when the term “academic age” is used, it refers to years since
first publication.
Analysis
Descriptive analyses were run on the entire dataset. An analytic sample was constructed for the
academic age, number of authors, percent of female authors, country, and discipline): 270,103
observations were used of 589,906 possible observations. Differences between the regression
and descriptive samples can be found in the supplemental materials. The most significant
difference is the near total exclusion of 2013 data from the regression, given that age data was
unavailable for this year. Given this, regressions should be interpreted as describing 2008-2012,
whereas the descriptive figures (excluding those with age data), describe the 2008-2013 data.
The regression analyses were conducted using SAS9.4.
Results
Hierarchy of science
Although not explicit, ranked authorship carries implicit assumptions of roles in certain
disciplines. For example, in the biomedical sciences, the corresponding author is often the
project investigator and senior researcher while the first author is the one who took a lead role in
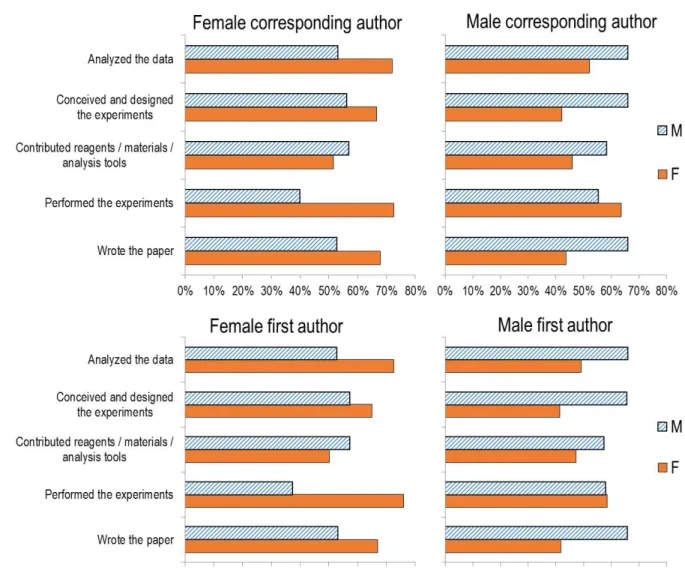
conducting the research. Figure 1 presents the proportion of men and women associated with
certain labor roles, by the gender of the dominant author. When there is a female first or
corresponding author, women are more likely to be associated with all tasks except contributing
materials. In the case of male corresponding or first author, men are more likely to be associated
with all tasks except experimentation. The largest gaps can be seen in terms of experimentation
with female dominant authors—women are significantly more likely to be associated with
experimentation in the case of dominant female authors.
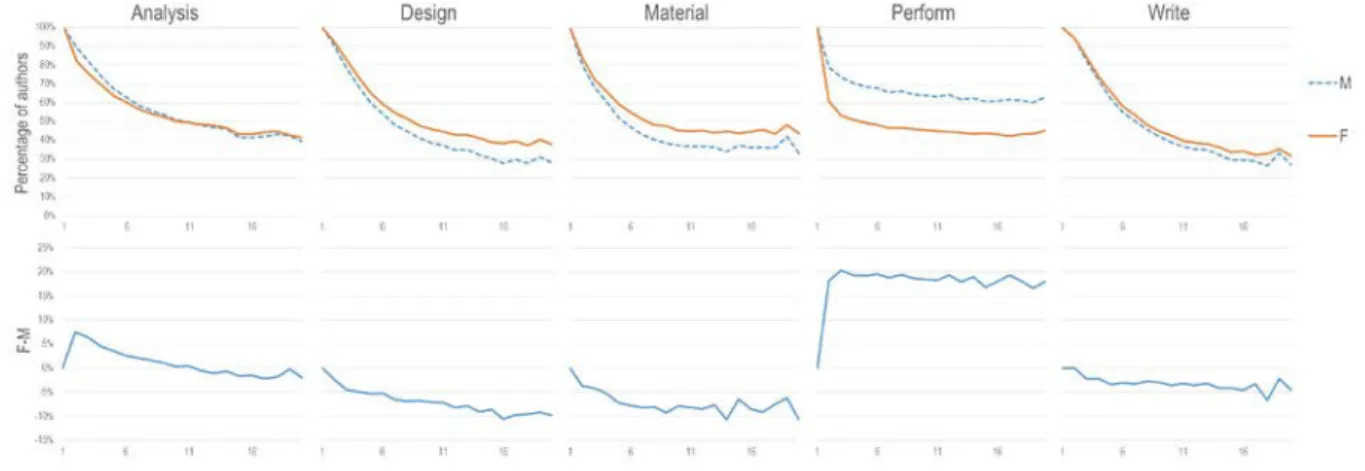
Academic age roles
Women are, on average, academically younger than men in our sample and academic age has an
gender associated with a particular role. For example, nearly 80% of women and 60% of men in
their first year of publishing are associated with performing experiments and that proportion
decreases over time (i.e., more experienced researchers are less likely to perform experiments).
However, there remains a clear gap in the contributions of experimentation, regardless of
academic age, with women consistently doing proportionally more of this task.
The bottom of Figure 2 demonstrates the difference between female and male
contributorships, by academic age. The gap between male and female contributions in
conception, contributing materials, and writing the paper equalizes as the contributors age
academically. Analyzing data, however, shifts from a male dominated activity in early years to a
female dominated activity in later years.
Many hands make light work
The old adage might be expected to apply in scientific collaborations: as the number of authors
increases, the proportion participating in any role should decrease. We see such a trend in most
categories—with proportional contributions decreasing at nearly equal rates for men and women
(Figure 3). Performing experiments, however, demonstrates a stable gap between men and
women and very little change in proportional representation as the team size increases. A similar
pattern can be observed in contributing material, with male dominance in this area. This
demonstrates that an increase in team size does not lead to a more gender-balanced distribution
of labor.
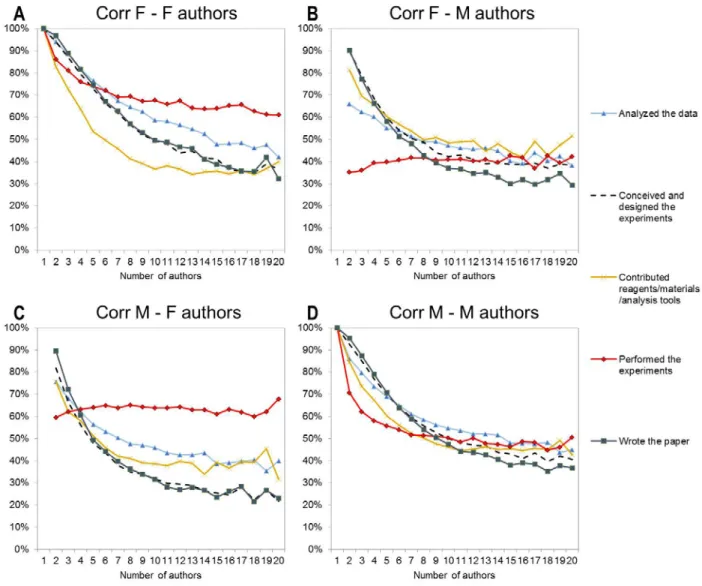
The relationship between the gender of the corresponding author and the gender of the
contributors moderates the results. For example, when there is a male corresponding author, the
proportion of women contributing to experimentation remains stable as the team size increases
proportion decreases as team size increases. Men are proportionally less likely to conduct
experiments when there is a female corresponding author.
Irrespective of team size, women were more likely than men to be associated with one or
two types of contribution per paper (and only slightly more likely to be associated with all five
contribution types). Men were more likely than women to be associated with three or four
contribution types per paper.
Gender roles
Given the differences observed in academic age, dominant author, and team size, a series of
logistic regressions were conducted to control for these variables. The results of the logistic
regressions demonstrate a significant (p<0.0001) relationship between gender and
contributorship type, when controlling for all other variables. The odds of a female author being
listed as performing the experiment were 1.52 times the odds of male author (Fig. 5). The odds
for all other tasks were more likely to be a male author.
Regressions were conducted using the various types of contributorship (i.e., analysis,
design, performing experiments) as the dependent variable and controlling for gender, authorship
status, corresponding authorship status, academic age, number of authors, country, field, and
publication year (Appendix A). In each case, gender remained a significant variable in
determining likelihood of performing a specific role.
Limitations
This research has provided the first large-scale window into the gendered nature of
contemporary science production. The results are limited, however, by the small range of time
and the singular publisher from which data were gathered. The use of the first publication date as
complicated by the lack of 2013 data). Furthermore, given the newness of contribution
statements, we require additional studies verifying the degree to which the stated contributions
accurately reflect the work in the lab.
Discussion and Conclusions
There exists in the production of science inequalities in the distribution of scientific labor, with
women more likely to be associated with the “physical” labor (i.e., performing experiments),
whereas men are more likely to be associated with resource contributions and “conceptual” labor
(i.e., conceiving and designing experiments and writing the paper). Gendered labor roles remain
significant after controlling for academic age, discipline, country, authorship position, and
proportion of male and female authors. These differences in labor roles may explain some of the
disparities in the rates of scientific production between men and women2, particularly in
prestigious first and last author positions.11
It has been established that women are underrepresented among senior author positions
generally11 and in prominent medical journals specifically.12 The present study extends previous
research by demonstrating that the gender of the senior author is related to the roles played by
other scientists on the team. Furthermore, the study has shown that the relationship between team
size and proportional contribution to various tasks differs by gender of the corresponding author.
The data suggests that, in the case of male corresponding authors, the proportion of authors
contributing to a single task decreases as the team size increases. The same trend is not observed
for female corresponding authors. The normative value of either model is arguable. On the one
hand, there is evidence that specialization in scientific roles leads to higher quality science.13-14
representation of men in fraud cases)15 suggests that the growing distance of authors from
substantial aspects of authorship may have negative consequences.
Research on contributorship can reveal critical information on the mechanisms of science
including, but not limited to, the role of gender and other variables in the effective functioning of
the scientific workforce. However, this is dependent upon the collection of high quality
contributorship data, a practice not widely employed by journals nor made available in
machine-readable ways. In the field of medical education, there are very few journals that do this. The
BMC Medical Education journal provides a designated section for author contributions. Other journals, such as Medical Education, Medical Teacher, and Advances in Health Sciences
Education provide no indication regarding contributorship.
Future research depends on the availability of high quality data on contributorship, which
will take a concerted effort on the part of journal editors, science policy makers, and scholars to
advocate for and implement this reporting into the scholarly communication system. This is also
an imperative for training—educating the next generation of scholars on equitable systems for
distribution of labor and allocation of credit in scientific work. Replacing authorship with
contributorship not only illuminates potential disparities in the scientific workforce, but may also
mitigate scientific malpractice as scientists would be required to be more explicit about their
roles, potentially lessening the opportunities for misappropriation of credit in scientific work.
This is an important intervention point for those educating people in academic medicine. As
authorship has changed, so too must our training, metrics, and documentation standards.
Funding/Support: The authors acknowledge funding from the Social Science and Humanities
Research Council of Canada as well as from the Canada Research Chairs program. Other disclosures: None.
Ethical approval: Not applicable. Disclaimers: None.
Previous presentations: None.
CITED REFERENCES
[1] Rossiter, M.W. (1982). Women scientists in America: Struggles and strategies to 1940.
Baltimore: The Johns Hopkins University Press.
[2] Larivière, V., Ni, C., Gingras, Y., Cronin, B., & Sugimoto, C.R. (2013). Global gender
disparities in science. Nature, 504(7479), 211-213.
[3] Merton, R.K. (1973). The sociology of science: Theoretical and empirical investigations.
Chicago: The University of Chicago Press.
[4] Biagoli, M, & Galison, P. (2002). Scientific authorship: Credit and intellectual property
in science. New York: Routledge.
[5] ICMJE, 1993. Uniform requirements for manuscripts submitted to biomedical journals.
JAMA--Journal of the American Medical Association, 269(17), 2282-2286.
doi:10.1001/jama.1993.03500170112052.
[6] Mowatt, G., Shirran, L., Grimshaw, J.M., Rennie, D., Flanagin, A., Yank, V.,
MacLennan, G., Gotzsche, P.C., & Bero, L.A. (2002). Prevalence of honorary and ghost
authorship in Cochrane reviews. JAMA--Journal of the American Medical Association,
[7] Bates, T., Marusic, M., & Marusic, A. (2004). Authorship criteria and disclosure of
contributions: Comparison of 3 general medical journals with different author
contribution forms. JAMA--Journal of the American Medical Association, 292(1), 86-88.
[8] Cronin, B. (2001). Hyperauthorship: A postmodern perversion or evidence of a structural
shift in scholarly communication practices? Journal of the American Society for
Information Science & Technology, 52(7), 558-569.
[9] Rennie, D., Yank, V., Emanuel, L. (1997). When authorship fails: A proposal to make
contributors accountable. JAMA--Journal of the American Medical Association, 278(7),
579-585.
[10] Caron, E., & van Eck, N. J. (2014). Large scale author name disambiguation using
rule-based scoring and clustering. In 19th International Conference on Science and
Technology Indicators. “Context counts: Pathways to master big data and little data” (pp.
79-86). CWTS-Leiden University Leiden.
[11] West, J.D., Jacquet, J., King, M.M., Correll, S.J., & Bergstrom, C.T. (2013). The
role of gender in scholarly authorship. PLOS ONE, 8(7), e66212. doi:
10.1371/journal.pone.0066212
[12] Jagsi, R., Guancial, E.A., Worobey, C.C., Henault, L.E., Chang, Y., Staff, R.,
Tarbell, N.J., & Hylek, E.M. (2006). The “Gender Gap” in authorship of academic
literature—a 35-year perspective. New England Journal of Medicine, 355, 281-287.
[13] Wuchty, S., Jones, B., & Uzzi, B. 2007. The increasing dominance of teams in the
production of knowledge. Science, 316(5827), 1036-1039.
[14] Jones, B. 2009. The burden of knowledge and the “death of the renaissance man”:
[15] Fang, F.C., Bennett, J.W., Casadevall, A. (2013). Males are overrepresented
among life science researchers committing scientific misconduct. mBio, 4, 1-3.
FIGURE LEGENDS
Figure 1. Proportion of male and female authors contributing to each labor role, by gender of corresponding author (top) and gender of first author (bottom)
Figure 2. (Top) Proportion of male and female authorships (y-axis) associated with contributorship by career age (x-axis). (Bottom) Difference in female to male contributorship (y-axis) by career age (x-axis)
Figure 3. (Top) Proportional representation of female and male authors (y-axis) by number of authors on the paper (x-axis); (Bottom) Difference between female and male
contributions (y-axis) by number of authors on the paper (x-axis)
Fig. 4. Proportion of male and female contribution to authorship as a function of the total number of authors, by gender of corresponding author.
Figure 5. Odds of females identified as contributor for each type of contribution relative to males
Appendix A. Regression results.
Dependent variable: Analysis
B Se p odds intercept 0.4069 0.6275 0.5167 female -0.1072 0.0104 <.0001 0.898346 Unknown gender -0.0924 0.0143 <.0001 0.91174 first author 2.3825 0.0555 <.0001 10.83195 last author 0.7962 0.0125 <.0001 2.2171 corresponding author 0.3042 0.3042 <.0001 1.35554 academic age -0.0121 0.000452 <.0001 0.987973 number of authors -0.0302 0.000694 <.0001 0.970251 percent authors 0.1262 0.0222 <.0001 1.134509
female
Country <.0001
Field <.0001
publication year <.0001
Cox & Snell’s pseudo- R2: 0.1640
Dependent variable: Design
B se p odds intercept 2.0272 0.8175 0.0131 female -0.1729 0.0113 <.0001 0.841222 unknown -0.1737 0.0154 <.0001 0.840549 first author 1.683 0.0535 <.0001 5.381677 last author 2.3855 0.0171 <.0001 10.86449 corresponding author 0.7458 0.7458 <.0001 2.108127 academic age 0.0431 0.000489 <.0001 1.044042 number of authors -0.0393 0.000811 <.0001 0.961462 percent authors female 0.0699 0.0241 0.0037 1.072401 country <.0001 field <.0001 publication year <.0001
Dependent variable: Materials B Se p odds intercept -1.4909 0.7699 0.0528 female -0.1728 0.0102 <.0001 0.841306 unknown -0.0895 0.0138 <.0001 0.914388 first author -0.1049 0.0451 <.0001 0.900415 last author -0.1649 0.0124 <.0001 0.847978 corresponding author 0.0858 0.0858 0.0551 1.089588 academic age 0.0291 0.000445 <.0001 1.029528 number of authors -0.00174 0.000558 0.0018 0.998262 percent authors female -0.1381 0.0214 0.0037 0.871012 country <.0001 field <.0001 publication year <.0001
Cox & Snell’s pseudo- R2: 0.0269
Dependent variable: perform experiment
B se p odds
female 0.4205 0.0108 <.0001 1.522723 unknown 0.212 0.0148 <.0001 1.236148 first author 2.0301 0.0605 <.0001 7.614848 last author -0.6188 0.0143 <.0001 0.53859 corresponding author -0.3874 0.0598 <.0001 0.67882 academic age -0.0825 0.000525 <.0001 0.920811 number of authors -0.0127 0.000629 <.0001 0.98738 percent authors female 0.0826 0.0234 0.0004 1.086107 country <.0001 field <.0001 publication year <.0001
Cox & Snell’s pseudo- R2: 0.2359
Dependent variable: write
B se p odds intercept 2.8428 1.0728 0.0081 female -0.078 0.0117 <.0001 0.924964 unknown -0.1794 0.0161 <.0001 0.835772 first author 2.5613 0.0593 <.0001 12.95264 last author 2.3059 0.016 <.0001 10.0332 corresponding 0.706 0.0594 <.0001 2.025872
author academic age 0.0321 0.000496 <.0001 1.032621 number of authors -0.044 0.00087 <.0001 0.956954 percent authors female -0.2813 0.0249 <.0001 0.754802 country <.0001 field <.0001 publication year <.0001
Supplementary material Methods
Data sources
Two sources of data are used: Thomson Reuters’ Web of Science (WoS) and all articles published by the Public Library of Science (PLOS), available on the PLOS website in XML format.
The WoS database includes the Science Citation Index Expanded (SCIe), the Social Science Citation Index (SSCI), and the Art & Humanities Citation Index (AHCI). As of 2014, the WoS covers more than 50 million articles published in almost 20,000 journals.
The Public Library of Science (PLOS) publishes 8 peer-reviewed scientific journals. PLOS Biology (2003) and PLOS Medicine (2004) were the two first journals founded, followed by PLOS Genetics, PLOS
Computationnal Biology and PLOS Pathogens in 2005, by PLOS ONE in 2006 and PLOS Neglected Tropical Diseases in 2007. PLOS Clinical Trials was published between 2006 and 2007.
Between 2003 and 2014, 127,911 articles were published in PLOS journals (eTable 1). PLOS ONE is the most prolific, with 106,460 documents published between 2006 and October 9th 2014. Other documents
(n=21,451) were published across the seven other journals. eTable 1. Number of documents per journal, 2003–2014
Data processing
Download and extraction
In order to create the corpus on the contributions of each of the authors, we used the data compiled by PLOS within the framework of the Article-Level Metrics1. Available in an Excel file2, these data provide
various citation and usage indicators but, more importantly for this project, the DOI of each of the articles, which was used to 1) download the full text of each PLOS article and 2) match each PLOS article with its record in the WoS.
In addition to full-text, PLOS journals make available PDF, RIS, BibTex and XML versions of the articles. In order to build the URLs of each of these articles, PLOS uses a standard format, which includes the journal URL, DOI, and type of format. For example, the link
1 See : http://article-level-metrics.PLOS.org/alm-info/
2 Available at : http://article-level-metrics.PLOS.org/PLOS-alm-data/.
Journal 2003 2004 2005 2006 2007 2008 2009 2010 2011 2012 2013 2014 All
PLOS Biology 98 456 431 423 321 327 264 304 276 230 292 196 3,618
PLOS Computational Biology 72 168 251 287 376 414 418 521 553 423 3,483
PLOS Clinical Trials 40 28 68
PLOS Genetics 77 208 230 352 473 471 565 721 874 552 4,523
PLOS Medicine 68 434 487 346 250 199 193 206 208 219 128 2,738
PLOS Neglected Tropical Diseases 42 179 224 350 445 525 623 533 2,921
PLOS ONE 137 1,230 2,716 4,405 6,750 13,797 23,464 31,524 22,437 106,460
PLOS Pathogens 41 123 198 286 459 534 556 640 739 524 4,100
[http://www.PLOSone.org/article/fetchObjectAttachment.action?uri=info%3Adoi%2F10.1371%2Fjourna l.pone.0004048&representation=XML] retrieves the XML format of the article “The Effects of Aging on Researchers' Publication and Citation Patterns”.
Using this structure, we built a code for automatically downloading the XML format of each PLOS paper. Using the DOIs found in the Article-Level-Metrics table, the URL of the XML format of each of the documents was built and queried using the SQL Server Integration Services (SSIS) as well as a Visual C# code (see eAppendix 1). This uploads automatically the XML format of each article to the user’s computer (see eAppendix 2).
Given that the metadata of each PLOS paper is available on WoS, only two elements are needed from the PLOS articles’ XML structure: the DOI and list of authors’ contributions. DOIs are kept in order to match articles with the WoS. In order to isolate and retrieve the author’s contribution from the full text of the articles, another Visual C# script integrated to SSIS was written. Articles’ DOIs were obtained through their URLs.
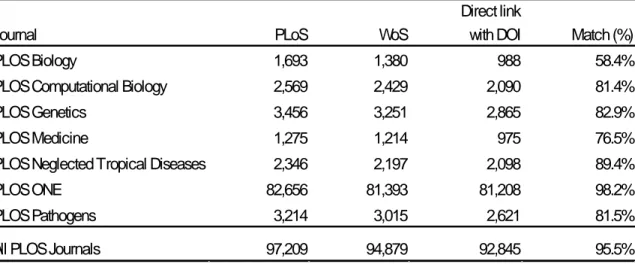
Table 3 provides the number of PLOS articles retrieved and the number of PLOS articles in WoS, as well as the proportion of PLOS articles that were matched with the WoS. As shown, 97.6 % (n=94,879) of all PLOS articles were indexed in the WoS. However, given that not all PLOS articles were assigned a DOI in the WoS, there is a small fraction of PLOS articles that could not be matched to the WoS. On the whole, more than 95.5% of PLOS articles published between 2008 and 2013 were matched to the WoS (92,845). Most of the articles are published in the journal PLOS ONE (more than 85%), and the large majority of these could be matched with the WoS (98.2%). The journal PLOS Clinical Trials, which was only published between 2006 and 2007, was excluded from the analysis, as it did not published any articles during the period covered (eTable 2).
eTable 2. Number and percentage of papers published in PLOS journals indexed in the WoS, 2008 - 2013
Selection of the corpus
The dataset of PLOS articles, including authors’ contributions as well as all WoS metadata, served as the sampling frame for the study. From this, any document types that were not standard articles and review articles were excluded, given that these are more likely to represent original contributions to knowledge (Moed, 2006). Furthermore, only articles published between 2008 and 2013 were included, as WoS only provided full first names and links to institutional addresses for this period (this was fundamental in the
Journal PLoS WoS
Direct link
with DOI Match (%)
PLOS Biology 1,693 1,380 988 58.4%
PLOS Computational Biology 2,569 2,429 2,090 81.4%
PLOS Genetics 3,456 3,251 2,865 82.9%
PLOS Medicine 1,275 1,214 975 76.5%
PLOS Neglected Tropical Diseases 2,346 2,197 2,098 89.4%
PLOS ONE 82,656 81,393 81,208 98.2%
PLOS Pathogens 3,214 3,015 2,621 81.5%
gender-name assignment procedure). This reduced the total number of articles to 88,067. Also excluded were articles lacking author contribute data (n=962) as well as those for which a match could not be established between PLOS and WoS (n=369). Four duplicates were also excluded. The final dataset included 87,002 articles published in the seven PLOS journals between 2008 and 2013.
Parsing the contributions field
For each article, each PLOS journal provides a list of each author’s contribution to predetermined categories of contributions. The most common contributions are:
• Analyzed the data
• Performed the experiments
• Conceived and designed the experiments • Wrote the paper
• Contributed reagents/materials/analysis tools
However, these statements of contributorship can take several forms. The most common form is this one:
Conceived and designed the experiments: SD RK. Performed the experiments: SD MM MJH. Analyzed the data: SD MM. Contributed reagents/materials/analysis tools: MJH. Wrote the paper: SD RK.
In this case, the name of the contribution is followed with a colon, a space, and then the initials of each of the authors who have performed this task. Each author is separated by a space. There are, however, other forms which are more difficult to parse. In the following example, all authors’ initials are
separated by a comma, and are followed by the specific contribution.
MS, CS, NC, CT, FGB, DR, NSF, MCP, HF, MPF, FB, PVA, PEC, SO, AG, FAS, PD, AM, MLA, and OS conceived, designed or performed the experiments. MS, CS, NC, CT, FGB, DR, NSF, KLR, MCP, HF, FB, PVA, PEC, SO, AG, IS, FAR, FAS, PD, AM, MLA, and OS analyzed the data or corrected the paper. BV, AZ, and AS contributed reagents/materials/analysis tools. MS, MLA, and OS wrote the paper.
This one, on the other hand, has the names of the authors written at length.
Conceived and designed the experiments: Ohad Yogev, Orli Yogev, Eitan Shaulian, Michal
Goldberg, Thomas D. Fox, Ophry Pines. Performed the experiments: Ohad Yogev, Orli Yogev, Esti Singer, Thomas D. Fox. Analyzed the data: Ohad Yogev, Orli Yogev, Eitan Shaulian, Michal Goldberg, Thomas D. Fox, Ophry Pines. Contributed reagents/materials/analysis tools: Michal Goldberg, Thomas D. Fox, Ophry Pines. Wrote the paper: Ohad Yogev, Michal Goldberg, Ophry Pines.
Extraction of authors’ contributions
The first step in extracting author contributions was to identify the most common form of contribution statements. In order to do so, we have limited the first step to the 86,725 statements that start by seven characters (without a space) or by the following words: wrote, final, first, icmje, model, this, the, took,
idea, for, gave, data, built, study. The name of the contribution was then isolated, as well as the initials
To reduce the problems associated with the various forms of author contributions, we have divided our dataset into two categories. The first group comprises all contribution statements where there are equal numbers of colon and end points (n=82,031) while the second group consists of those for which the number of colons and end points is not identical (n=4,694). This allows distinguishing the contributions where end points are used for functions other than the end of a phrase or where points are missing and, would, thus, compromise the parsing of initials in subsequent treatments.
For the first group, we start by dividing the text using the end point found at the end of each contribution. For example, the following statement:
Conceived and designed the experiments: SD RK. Performed the experiments: SD MM MJH. Analyzed the data: SD MM. Contributed reagents/materials/analysis tools: MJH. Wrote the paper: SD RK.
Is divided into the following sentences:
1. Conceived and designed the experiments: SD RK 2. Performed the experiments: SD MM MJH 3. Analyzed the data: SD MM
4. Contributed reagents/materials/analysis tools: MJH 5. Wrote the paper: SD RK
These contribution statements are then separated into two sections using the colon: the left part, which contains the contribution, and the right part, which contains the initials of the authors who have
performed the task. Each initial is also extracted and placed into a specific field.
For the other group of contribution statements where the number of colons and end points is not identical, we cannot use the point as the marker of the end of a contribution. For example, this contribution statement contains a point following one of the authors’ initials (Thomas D. Fox):
Conceived and designed the experiments: Ohad Yogev, Orli Yogev, Eitan Shaulian, Michal
Goldberg, Thomas D. Fox, Ophry Pines. Performed the experiments: Ohad Yogev, Orli Yogev, Esti Singer, Thomas D. Fox. Analyzed the data: Ohad Yogev, Orli Yogev, Eitan Shaulian, Michal Goldberg, Thomas D. Fox, Ophry Pines. Contributed reagents/materials/analysis tools: Michal Goldberg, Thomas D. Fox, Ophry Pines. Wrote the paper: Ohad Yogev, Michal Goldberg, Ophry Pines.
Hence, for this type of contribution, we need to find an additional way of separating the various contributions. We thus introduced another marker in each of the statements to parse each of the contributions. A vertical bar ‘ | ’ was thus inserted at the beginning of each contribution to replace the point as a marker of contributions. The colon was then used to isolate the initials from the rest of the contribution field, and then, using the vertical bar, we isolated the contribution label. Here’s an example of this treatment:
|conceived and designed the experiments: ohad yogev, orli yogev, eitan shaulian, michal goldberg, thomas d. fox, ophry pines. |performed the experiments: ohad yogev, orli yogev, esti singer, thomas d. fox. |analyzed the data: ohad yogev, orli yogev, eitan shaulian, michal
goldberg, thomas d. fox, ophry pines. |contributed reagents/materials/analysis tools: michal goldberg, thomas d. fox, ophry pines. |wrote the paper: ohad yogev, michal goldberg, ophry pines.
Then, in a manner similar to the first group, we have isolated each contributing author using the space or comma. After a few treatments on the contribution statements that did not follow exactly the form typically used, we obtained collaboration statements for all 87,002 articles. On the whole, we obtained 20,667 distinct contribution labels, associated with 40,356 initials (contributors), for more than 1.5 million records. After the cleaning of contribution statements with typos, as well as the grouping of contribution statements having the same signification (for example, ‘writing the paper’ and ‘writing the manuscript’), we obtained a list of the most common contributions, as well as the number of articles and of author-article combinations that feature this contribution (eTable 3).
eTable 3. Number and percentage of articles and of article-initial pairs, by contribution label
Establishing a link between the WoS and the PLOS database
As mentioned previously, the DOI was used to match PLOS contributions and bibliographic information found in the WoS. Another link also has to be established between the two data sources, as the initials of the authors from the PLOS database have to be linked with the names of the authors found in the WoS record, in order to obtain each authors’ gender. Each authors’ name from the WoS was thus transformed into an ‘initials’ format to match the PLOS contributions using a SQL script. For more than 98% of articles (n=85,260), all authors were assigned to their contribution (eTable 4). Those that were not matched were due to mistakes in the spelling of the names in WoS, or their absence in the authors’ list.
eTable 4. Number and percentage of articles and of article-initial pairs matched with the WoS, by contribution label
Author-initial combinations Articles
Contribution N % N %
Analyzed the data 320,080 50.6% 85,900 98.7%
Performed the experiments 311,679 49.3% 82,811 95.2%
Conceived and designed the experiments 288,765 45.6% 85,406 98.2%
Wrote the paper 287,796 45.5% 86,517 99.4%
Contributed reagents/materials/analysis tools 220,331 34.8% 64,444 74.1%
Other (20 243) 79,978 12.6% 15,900 18.3%
-Gender and age assignation
The gender of authors has been attributed using gender assignation tables developed in Larivière et al. (2013). This list uses given names and country combinations to assign gender to authors of articles. On the whole, this conversion list managed to assign a gender to 88.1% of authorships – i.e., author-paper combinations – found in the paper, of which 32.5% were female and 55.7% were male. Initials and unisex names accounted for 0.2% and 2.7% respectively, while unknown was 8.9%. This unknown rate is slightly above that obtained by Larivière et al. (2013) for all WoS (8.4%).
Academic age of authors was estimated using their year of first publication, as recorded in the Web of Science. In order to obtain such age, authors found in the WoS were disambiguated automatically by the Center for Science and Technology Studies (CWTS, Leiden University) using the algorithm developed by Caron& van Eck (2014). The distribution of ages for male and female contributorships is presented in eFigure 1. Given that the majority (95%) of authors were (academically) younger than 30 years—and that ages above 30 are overestimated because the first “possible” publication year in our dataset is 1980, the analyses for this paper focus on those whose academic age is between 0 and 30 years.
eFigure 1. Number of female and male contributorships by academic age.
Regression analysis
Articles not matched with WoS Articles matched with WoS Percent difference
Contribution
N
article-initial pairs N articles
N article-initial
pairs N articles
N
article-initial pairs N articles
Analyzed the data 320,080 85,900 306,592 84,221 4.2% 2.0%
Performed the experiments 311,679 82,811 297,893 81,183 4.4% 2.0%
Conceived and designed the experiments 288,765 85,406 277,302 83,734 4.0% 2.0%
Wrote the paper 287,796 86,517 274,615 84,789 4.6% 2.0%
Contributed reagents/materials/analysis tools 220,331 64,444 208,794 63,049 5.2% 2.2%
Other* 79,978 15,900 67,929 15,416 15.1% 3.0%
N. distinct papers 632,799 87,002 589,892 85,260 6.8% 2.0%
*Including the original wording of "Other" contributions as well as all other categories that did not correspond with these five main categories
0 5,000 10,000 15,000 20,000 25,000 30,000 35,000 0 2 4 6 8 10 12 14 16 18 20 22 24 26 28 30 32 34 M F
An analytic sample was constructed for the regression using those observations that contained all necessary variables (i.e., author position, academic age, number of authors, percent of female authors, country, and discipline): 270,103 observations were used of 589,906 possible observations. eTable 5 and 6 detail the differences between these samples. Regressions were run on the entire dataset and using each contributorship type as a dependent variable. The unit of analysis was author-publication combinations.
eTable 5. Differences between the whole and the regression samples Whole sample Regression
sample n 589,906 270,103 Gender Females 32.5 32.4 Males 55.7 56.5 Unknown 11.9 11.1 First author 14.5 14.6 Last author 14.5 14.4 Corresponding author 14.4 14.6 Field Arts .0 .0 Biology 5.6 5.0 Biomedical Research 43.2 46.5 Chemistry .3 .2 Clinical Medicine 47.8 45.8
Earth and Space .6 .4
Engineering and Tech .3 .2
Health .5 .4 Humanities .0 .0 Mathematics .1 .1 Physics .3 .3 Professional Fields .1 .1 Psychology 1.0 .9 Social Sciences .2 .2 Unknown .0 .0 Contributions analysis 52.0 52.8 design 47.0 47.0 material 35.4 35.0 perform 50.5 50.5 write 46.6 46.3 Publication year 2008 3.1 5.9 2009 2.8 5.2 2010 9.6 18.1 2011 17.9 33.9 2012 29.4 34.9 2013 37.3 2.0 Academic agea 11.0 (10.3) 11.0 (10.3) Number of authorsa 6.9 (4.2) 7.0 (4.4)
Percent femalea 35.6 (24.9)
35.3 (24.6) Notes: Values in table show percentage of observations
aDescriptive analysis at document level. Numbers in corresponding rows are mean and standard
deviation in parentheses. n=85,260 in whole sample and 49,290 in regression sample
eTable 6. Difference between whole and regression samples for countries with more than 0.5% of whole sample Whole sample Regression sample n 589,906 270,103 number of countries 189 178 missing 1.2 0 AUSTRALIA 2.8 2.8 AUSTRIA .7 .6 BELGIUM 1.0 1.1 BRAZIL 1.7 1.5 CANADA 3.1 3.2 DENMARK .9 .9 ENGLAND 5.1 5.7 FINLAND .7 .7 FRANCE 5.3 5.9 GERMANY 6.3 6.5 INDIA 1.3 1.2 ISRAEL .7 .8 ITALY 3.5 3.4 JAPAN 4.6 4.2 NETHERLANDS 2.5 2.6 NORWAY .6 .6 PEOPLES-R-CHINA 12.4 9.1 PORTUGAL .5 .5 SCOTLAND .8 .8 SINGAPORE .6 .6 SOUTH-KOREA 1.4 1.1 SPAIN 2.7 2.8 SWEDEN 1.7 1.8 SWITZERLAND 1.6 1.7 TAIWAN 1.8 1.4 USA 27.5 31.2
Caron, E., & van Eck, N. J. (2014). Large scale author name disambiguation using rule-based scoring and clustering. In 19th International Conference on Science and Technology Indicators.“Context counts: Pathways to master big data and little data” (pp. 79-86). CWTS-Leiden University Leiden.
Larivière, V., Ni, C., Gingras, Y., Cronin, B., & Sugimoto, C.R. (2013). Global gender disparities in science. Nature, 504(7479), 211-213.
eAppendix 1. SQL code for the creation of the URL of each PLOS paper
SELECTDISTINCT idPLOS,SUBSTRING(DOI,CHARINDEX('/',doi)+ 1,LEN(DOI))ASdoi,
SUBSTRING(URL, 1,CHARINDEX('.org',url)+ 4)+
'article/fetchObjectAttachment.action?uri=info%3Adoi%2F10.1371%2F'+
SUBSTRING(DOI,CHARINDEX('/',doi)+ 1,LEN(DOI))+'&representation=XML'ASurl
FROMdbo.PLOS
WHEREidPLOS= ? /*parameter*/
eAppendix 2. C# code for the download of each paper (through Microsoft SQL server Integration Services) using System; using System.IO; using System.Xml; using System.Data; using Microsoft.SqlServer.Dts.Pipeline.Wrapper; using Microsoft.SqlServer.Dts.Runtime.Wrapper; [Microsoft.SqlServer.Dts.Pipeline.SSISScriptComponentEntryPointAttribute]
publicclass ScriptMain : UserComponent {
string fichiersource = string.Empty; string JournalTitle = string.Empty; string fntype = string.Empty; string contribution = string.Empty;
publicoverridevoid CreateNewOutputRows() {
fichiersource = Variables.destination;
XmlTextReader xmt = new XmlTextReader(fichiersource);
while (xmt.Read()) {
if ((xmt.Name == "fn") && (xmt.HasAttributes)) {
xmt.MoveToAttribute("fn-type"); fntype = xmt.GetAttribute("fn-type"); if (fntype == "conflict")
{
xmt.MoveToAttribute("fn-type"); fntype = xmt.GetAttribute("fn-type"); if (fntype == "con")
{
xmt.ReadToFollowing("p");
contribution = xmt.ReadInnerXml(); this.Output0Buffer.AddRow();
this.Output0Buffer.NomFichier = Variables.NomFichier; this.Output0Buffer.DOI = "";
this.Output0Buffer.Contribution = contribution; xmt.Close();
} }
elseif (fntype == "con") {
xmt.ReadToFollowing("p");
contribution = xmt.ReadInnerXml(); this.Output0Buffer.AddRow();
this.Output0Buffer.NomFichier = Variables.NomFichier; this.Output0Buffer.DOI = "";
this.Output0Buffer.Contribution = contribution; xmt.Close(); } } this.Output0Buffer.EndOfRowset(); } } }
Appendix 3. C# code for extraction author’s contribution in PLOS articles
using System; using System.IO; using System.Xml; using System.Data; using Microsoft.SqlServer.Dts.Pipeline.Wrapper; using Microsoft.SqlServer.Dts.Runtime.Wrapper;
[Microsoft.SqlServer.Dts.Pipeline.SSISScriptComponentEntryPointAttribute]
publicclass ScriptMain : UserComponent {
string fichiersource = string.Empty; string JournalTitle = string.Empty; string fntype = string.Empty; string contribution = string.Empty;
publicoverridevoid CreateNewOutputRows() {
fichiersource = Variables.destination;
XmlTextReader xmt = new XmlTextReader(fichiersource);
while (xmt.Read()) {
if ((xmt.Name == "fn") && (xmt.HasAttributes)) {
xmt.MoveToAttribute("fn-type"); fntype = xmt.GetAttribute("fn-type"); if (fntype == "conflict")
{
xmt.MoveToAttribute("fn-type"); fntype = xmt.GetAttribute("fn-type"); if (fntype == "con")
{
xmt.ReadToFollowing("p");
contribution = xmt.ReadInnerXml(); this.Output0Buffer.AddRow();
this.Output0Buffer.NomFichier = Variables.NomFichier; this.Output0Buffer.DOI = DOI;
this.Output0Buffer.Contribution = contribution; xmt.Close();
} } }
elseif (fntype == "con") {
xmt.ReadToFollowing("p");
this.Output0Buffer.AddRow();
this.Output0Buffer.NomFichier = Variables.NomFichier; this.Output0Buffer.DOI = DOI;
this.Output0Buffer.Contribution = contribution; xmt.Close(); } this.Output0Buffer.EndOfRowset(); } } }