HAL Id: hal-02368143
https://hal.archives-ouvertes.fr/hal-02368143
Submitted on 2 Mar 2021HAL is a multi-disciplinary open access archive for the deposit and dissemination of sci-entific research documents, whether they are pub-lished or not. The documents may come from teaching and research institutions in France or abroad, or from public or private research centers.
L’archive ouverte pluridisciplinaire HAL, est destinée au dépôt et à la diffusion de documents scientifiques de niveau recherche, publiés ou non, émanant des établissements d’enseignement et de recherche français ou étrangers, des laboratoires publics ou privés.
Fluid flow characteristics of a multi-scale fluidic network
Cyril Pistoresi, Yilin Fan, Julien Aubril, Lingai Luo
To cite this version:
Cyril Pistoresi, Yilin Fan, Julien Aubril, Lingai Luo. Fluid flow characteristics of a multi-scale flu-idic network. Chemical Engineering and Processing - Process Intensification, 2018, 123, pp.67-81. �10.1016/j.cep.2017.10.014�. �hal-02368143�
Fluid flow Characteristics of a Multi-Scale Fluidic Network
Cyril PISTORESIa, Yilin FANa, Julien AUBRILa, Lingai LUOa*
a Laboratoire de Thermique et Energie de Nantes, CNRS UMR 6607, Université de Nantes, La Chantrerie, Rue
Christian Pauc, BP 50609, 44306 Nantes Cedex 03, France
ABSTRACT
This paper presents an original study on the fluid flow characteristics of a multi-scale fluidic network consisting of a number of elementary ladders. Computational Fluid Dynamics (CFD) simulations were performed to characterize local fluid flow patterns and flow distribution properties in such a complex geometry. In parallel, flow visualizations using fast camera and tracers were carried out in a transparent prototype. A special effort was made to improve the flow distribution uniformity among the 90 parallel mini-channels by inserting the geometrically optimized perforated baffles. The global pressure losses of the multi-scale network with or without baffles were also measured experimentally so as to be compared with the numerical results.
For the multi-scale fluid network, non-uniform flow distribution was observed even under very low flow-rate conditions (e.g., mean Rech=10). For higher flow-rate conditions, significant flow non-uniformity seems inevitable. The insertion of optimized perforated baffles could provide a remarkable improvement on flow distribution uniformity, even under high flow-rate conditions (mean Rech up to 2000). Good agreements between numerical and experimental results are observed.
KEYWORDS:
Flow distribution; Multi-scale; Fluidic network; Parallel channels; Process Intensification
2
1. INTRODUCTION
Facing the challenges of climate change and energy shortage issues, Process Intensification that leads to smaller, less costly, cleaner, safer, higher productivity and more energy efficient technologies has now become a widely accepted concept in chemical and process engineering. Particularly, the innovative designs of high yield processes or compact equipments through integration and miniaturization are effective ways to realize process intensification [1-3].
Researches in the field of miniaturization, thanks to the advances in fabrication and observation tools, target at miniaturized structures (e.g., micro or mini-channels) because of their enhanced heat and mass transfer properties and improved controllability. Miniaturized process and energy equipments include heat exchangers [e.g., 4-7], chemical mixers or reactors [e.g., 8-11], catalytic monoliths or fuel cells [e.g., 12-14] and integrated multifunctional systems [e.g., 15-19] with the purpose of realizing a
lab-on-a-chip. Nevertheless, to obtain a high throughput or production rate, a large number of
micro/mini-channels should be installed in parallel. This so-called scaling-up by numbering-up process is far from trivial but is a key issue involving how to design and develop globally macro-sized, locally micro-structured process equipment by using multi-scale fluidic networks [20-21].
One typical geometry commonly used to form multi-scale fluidic networks is the elementary Z-ladder structure, which consists of an inlet fluid distributor, an outlet fluid collector and a number of perpendicular parallel cross-channels (as shown in left part of Fig. 1). Abundant literature is available on the hydrodynamic, heat transfer or reaction characteristics of such structure. These studies distinguish themselves by the presence of analytical [e.g., 22-25], numerical [e.g., 26-29] or experimental results [e.g., 30-32], by the continuous [e.g., 33-34] or discrete [e.g., 35-39] description of the network, and by different aimed applications. Relatively fewer studies were devoted to the construction of a more complex multi-scale fluidic network through parallel arrangement of elementary Z-ladders by introducing intermediate connections, as shown in the right part of Fig. 1 for example. Noteworthy is the group of Falk and Commenge who first performed hydrodynamic modeling of the multi-scale network under isothermal and laminar flow conditions, so as to provide design charts for rapid and flexible numbering-up of parallel micro-reactors [40-41]. In their later works, the heat transfer characteristics [42] and the selectivity of consecutive catalytic reactions [43] of such multi-scale networks have also been investigated. A few other studies focused on the global flow resistance minimization [44-47] or thermal performance [48] of similar multi-scale geometries. Nevertheless, most of these works are pure analytical while detailed numerical and experimental results on the fluid flow characteristics are still lacking.
One of the key issues for parallel multi-channel devices is the fluid flow maldistribution that deteriorates their global performances. Extensive efforts have been made on the uniformization of fluid distribution among parallel channels of an elementary Z-ladder. Some studies focused on determining the optimal ratio between hydraulic resistances of the distributor, the collector and the cross-channel
[e.g., 35]. Others worked on triangular or trapezoidal-shaped distributor and collector instead of the basic rectangular (or cylinder) shape [e.g., 26, 49]. Still others introduced more degrees of freedom and proposed stairway-type [e.g., 22, 25, 50-52] or curvature-shaped [e.g., 53-55] obeying some scaling-relations or subjected to geometric optimization. More detailed description of these approaches may be
3
found in recent review papers [56-57]. With these methods, a relatively uniform flow distribution is achievable at the price of lower compactness. Moreover, it seems very difficult to prevent the flow distribution non-uniformity under higher flow-rate conditions (e.g., mean Rech>500) [40, 51]. For multi-scale fluidic networks comprising of a number of elementary ladders, only some preliminary thoughts
[40, 44, 46] were reported, but without further supplementary numerical or experimental data to the best of our knowledge.
Recently, an innovative method based on the insertion of a geometrically optimized perforated baffle in the distributing manifold is proposed by Luo et al. [58-59]. This method, associated with an evolutionary algorithm to determine the optimal sizes of orifices, is in similar relation to the study of Tong et al. [60] and that of Liu and Yu [61] which adjust the dimension of the inlet/outlet opening of every mini-channel as a supplemental hydraulic resistance. Numerical and experimental results [62-64]
confirmed that this method is practical, easy to implement, effective and robust in realizing different target (both uniform and non-uniform) flow distributions among parallel channels. For complex multi-scale fluidic networks such as shown in Fig. 1, it could be a promising option but hasn’t yet been applied nor fully tested.
The main objective of this study is to investigate the fluid flow characteristics of a multi-scale fluidic network consisting of a number of elementary Z-ladders. Both Computational Fluid Dynamics (CFD) simulations and local flow visualization using fast camera and tracers were performed. A special attempt is made to improve the flow distribution uniformity among the parallel mini-channels, by the insertion of geometrically optimized perforated baffles. Note that neither the local fluid flow patterns nor the flow distribution properties in such multi-scale fluidic networks have been reported in the literature before; these are also the main originalities of this paper.
The rest of the paper is organized as follows. Section 2 introduces the geometry, the detailed dimensions and a transparent prototype of the multi-scale fluidic network tested in this study. Section 3 presents the used methodologies including the CFD simulation parameters, the experimental set-up and the procedure on the sizing and optimization of perforated baffles. Numerical and experimental results on the hydrodynamic characteristics of the basic network (without baffles) and the optimized network (with insertion of baffles) are compared and discussed in section 4. Finally in section 5, main findings of this study as well as the future research directions are summarized.
2. GEOMETRY AND DEVICE
2.1 Geometry of the multi-scale fluidic network
Figure 1 shows the geometry and dimensions of the multi-scale fluidic network. The basic component of this network is a Z-ladder circuit. Ten mini-channels having a square cross-section of 1 mm × 1 mm and a length of 50 mm are arranged in parallel, spaced one from each other by 4 mm. These parallel channels are connected together by an inlet fluid distributor and an outlet fluid collector to form an elementary 2-scale circuit. Both the elementary distributor and the collector have a rectangular-shape manifold, connected to an inlet/outlet port of 5 mm in length and 5 mm in width. The
4
length of the collecting manifold is 46 mm and the width is 7 mm whereas for the distributing manifold, the length is 46 mm and the width is 9 mm. A groove of 1 mm in thickness is reserved for the insertion of an elementary perforated baffle, situated in the distributing manifold with 2 mm distance away from the entrance of mini-channels. Note that regarding the convenience of prototype fabrication, the channel depth is identical (1 mm) for the elementary circuit and for the entire multi-scale network.
Figure 1. Geometry and dimensions of the multi-scale fluidic network [10, 3, 3] (unit: mm).
Three elementary Z-ladders are then arranged in parallel connected by a distributor and a collector to form a 3-scale circuit. The dimensions of the intermediate distributor and collector are listed in Table 1. A groove is located at 2 mm distance away from the inlet port of elementary distributors, permitting the insertion an intermediate perforated baffle of 1 mm in thickness. Likewise, three 3-scale circuits are arranged in parallel to form a 4-scale fluidic network, connected by a principal distributor (with groove reserved for 1 mm thickness principal baffle) and a principal collector. Their detailed dimensions are also listed in Table 1.
Table 1. Detailed dimensions for the multi-scale fluidic network.
Table 1. Detailed dimensions for the multi-scale fluidic network.
Parameter Value
Number of mini-channel 90
5
Channel depth of the whole network 1 mm
Mini-channel length 50 mm
Distance between two mini-channels 4 mm Manifold of the elementary distributor [length × width] 46 × 10
Manifold of the elementary collector [length × width] 46 × 7 Inlet/outlet port of the 2-scale ladder [length × width] 5 × 5 Manifold of the intermediate distributor [length × width] 148 × 15
Manifold of the intermediate collector [length × width] 148 × 12 Inlet/outlet port of the 3-scale circuit [length × width] 5 × 5
Manifold of the principle distributor [length × width] 148 × 15 Manifold of the principle collector [length × width] 148 × 12 Inlet/outlet port of the 4-scale network [length × width] 5 × 5
Following the above-mentioned scaling-up measure, a 4-scale fluidic network with a topology [10, 3, 3] has been built. Here “10” is the number of parallel mini-channels in an elementary ladder, the middle “3” is the number of 2-scale ladders and the second “3” is the number of 3-scale circuits. The total number of parallel mini-channels equals to 90. For the convenience of description, 9 elementary Z-ladders are indexed from A to I from top-left to bottom-right, as shown in Fig. 1. For each elementary ladder, 10 mini-channels are indexed by j from 1 to 10 from left to right.
2.2 Prototype fabrication
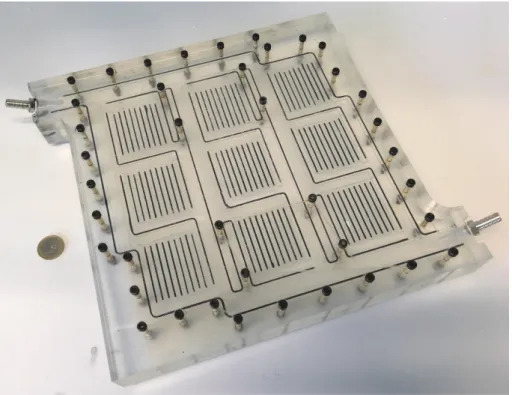
The prototype was fabricated in the laboratory LTEN, France by digitally-assisted carving of the multi-scale fluidic network (shown in Fig. 1) on the surface of a PMMA rectangular parallelepiped. Another PMMA rectangular parallelepiped was used as the cover. Numerous grooves were reserved around the whole fluidic network or between neighboring parallel mini-channels, and filled with rubber strips to prevent the water leakage. Moreover, a number of bolts were used for further sealing. The overall dimension of prototype is 285 mm in length, 260 mm in width and 35 mm in thickness. The photo view of the multi-scale fluidic network prototype after assembling is shown in Fig. 2.
6
Figure 2. Photo view of the transparent prototype of the multi-scale fluidic network.
2.3 Parameter definition
In this study, the flow distribution uniformity is quantified by two parameters: the relative flow-rate deviation (σi,j) and the maldistribution factor (MF). The relative flow-rate deviation is defined as:
𝜎𝜎
𝑖𝑖,𝑗𝑗=
𝑚𝑚𝑖𝑖,𝑗𝑗𝑚𝑚�−𝑚𝑚𝑖𝑖,𝑗𝑗�𝑖𝑖,𝑗𝑗(1)
where mi,j is the mass flow-rate in the mini-channel i,j with i varying from A to I and j varying from 1 to 10. 𝑚𝑚�𝑖𝑖,𝑗𝑗 represents the average mass flow-rate among all 90 parallel channels:
𝑚𝑚�
𝑖𝑖,𝑗𝑗=
∑ ∑ 𝑚𝑚𝑖𝑖,𝑗𝑗 10 𝑗𝑗=1 𝐼𝐼 𝑖𝑖=𝐴𝐴 90(2)
Maldistribution factor is also introduced, for each elementary Z-ladder (MFA to MFI) and for the whole fluidic network (MFnetwork):
MF
i= �
19∑
�
𝑚𝑚𝑖𝑖,𝑗𝑗𝑚𝑚�−𝑚𝑚�𝑖𝑖,𝑗𝑗 𝑖𝑖,𝑗𝑗�
2 10 𝑗𝑗=1(i = A…I)
(3)
MF
network= �
891∑
∑
�
𝑚𝑚𝑖𝑖,𝑗𝑗𝑚𝑚�−𝑚𝑚𝑖𝑖,𝑗𝑗�𝑖𝑖,𝑗𝑗�
2 10 𝑗𝑗=1 𝐼𝐼 𝑖𝑖=𝐴𝐴(4)
7
3. METHODOLOGIES
In this section, simulation parameters and the experimental set-up are described. In particular, the detailed procedure on the sizing and optimization of perforated baffles for the multi-scale network is presented.
3.1 CFD Simulation parameters
The geometry of the basic and optimized networks and the corresponding meshes were generated using different modules of ANSYS Workbench 16.1. Note that due to symmetrical character of the network in the direction of the depth, half of the real object was adopted in the simulation, the gravity effect being neglected. Pure water at constant temperature of 293 K was chosen as working fluid (density ρ=998.3 kg·m-3 and viscosity µ=1.003×10⁻³ kg·m-1·s-1). The operational pressure was fixed at 101325 Pa. In this study, simulations were performed under steady state, incompressible and isothermal condition without heat transfer. For simplification, viscous heating was also neglected.
Fluent code V.16.1 was used to solve the Navier-Stokes equations. Constant mass flow-rate normal to the inlet surface of the principal distributor was given. Eight mass flow inlet (min) were tested: 4.5×10 -4 kg·s-1; 9×10⁻⁴ kg·s-1; 1.8×10⁻³ kg·s-1; 4.5×10⁻³ kg·s-1; 9×10⁻³ kg·s-1; 1.8×10⁻² kg·s-1; 4.5×10⁻² kg·s-1; 9×10⁻² kg·s-1, corresponding to a value of mean channel Reynolds number (Rech) of 10; 20; 40; 100; 200; 400; 1000; 2000, respectively. The boundary condition of outlet was set as pressure-outlet with zero static pressure. Non-slip wall condition was applied.
Laminar flow model was used under very low velocity conditions while the k-ε RNG model was
used for higher velocity conditions because micro turbulences and local vortex may exist. For the pressure-velocity coupling, standard SIMPLE method was used. For discretization, standard method was chosen for pressure and first-order upwind differentiation for momentum. The solution was considered to be converged when the flow-rate at each channel and the inlet static pressure were constant from one iteration to the next (less than 0.5% variation) and the normalized residuals of all monitoring parameters were lower than the order of magnitude of 10-6.
A grid independence study was performed using three structured meshes with different densities: coarse mesh (10 segments per millimeter; 0.64 million elements in total); medium mesh (20 segments per millimeter; 2.8 million elements in total) and refined mesh (30 segments per millimeter; 7.21 million elements in total). Simulation results with an inlet velocity of 9×10⁻² kg.s-1 (mean Rech=2000) indicated a difference of 5.4% on the inlet pressure between the coarse mesh and the refined mesh, and of 1.1% between medium mesh and refined mesh. Mass flow-rates in each mini-channel were also compared, showing a maximum difference of 2.2% between the coarse mesh and the refined mesh, and of 1.4% between the medium mesh and the refined mesh. Hence, the medium mesh was selected as a compromise between the calculation time and the precision.
3.2 Experimental set-up and measuring procedure
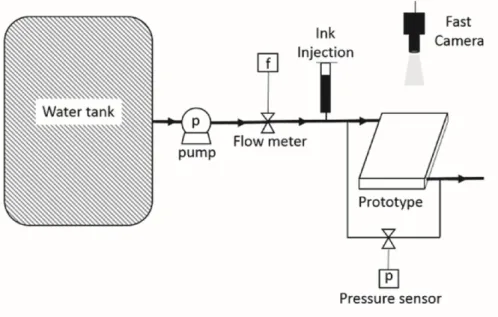
Fluid flow visualization was performed on the transparent prototype using fast camera and tracers so as to compare with the CFD results. Figure 3 shows the experimental set-up built in laboratory LTEN
8
for this purpose. Pure water was pumped from a 200 liters water tank to pass through the prototype from its inlet to its outlet. A precision pump (VWR, REGLO-Z) with a range from 32 to 3200 mL·min -1 was used and the flow-rate was measured by a flow meter (KOBOLD, DPL-1P15GL443) with a precision of ±2.5% full-scale. A pressure sensor Huba Control 692 with a measuring range from 0 to 1.6 bar (±0.4% full-scale) was installed to measure the global pressure loss between the inlet and the outlet of the prototype. The flow meter and the pressure sensor were powered by a 24 V Calex 52024 and linked to an Agilent card 34901a for data recording.
Black ink was used as a tracer. The injection was done once the fluid flow was stabilized using a syringe. A fast camera AVT Prosilica GE (40 pictures per second) was used to film and record the ink progression through the multi-scale fluidic network. An acquisition program has been developed under the LabVIEW software to pilot the fast camera. The size of the acquisition window was set on 640 × 480 pixels. The contrast, the exposure, the gain and the white balance were also adjusted in order to have a white background and to clearly visualize the ink flow patterns through the multi-scale network.
Figure 3. Experimental set-up for the visualization of the ink progression through the multi-scale fluidic network.
Air bubbles, being observed mainly in stagnant zones of the network but also in parallel mini-channels, could unfortunately disturb the flow patterns. Their presence was frequently encountered at the beginning of liquid circulation and might keep blocking the mini-channels if they had not been successfully removed. To avoid the presence of air bubbles, the prototype was assembled in water environment and the inlet/outlet pipes were also connected to the prototype under water. The tightness was checked before each recording to prevent the water leakage.
For convenience of comparison, all the tests were carried out at room temperature (about 25 °C). For each measurement, it took about several minutes for the stabilization of fluid flow. The acquisition time was set as 10 seconds and it launched simultaneously when ink was injected. Same procedure was
9
performed for both the basic network (without baffles) and the optimized network (with baffles). Local ink flow patterns were captured and analyzed image by image in order to make a comparison with the CFD simulation. Serval tests were performed for the same inlet flow-rate condition and good reproductivity was observed.
3.3 Sizing and optimization of perforated baffles
The basic idea is to install a perforated baffle in the distributing manifold and to optimize the size of orifices by an evolutionary algorithm in order to reach the target flow distribution. This method has been proposed and tested in our earlier studies [58, 62-63] for the purpose of achieving target flow distribution among parallel channels of a two-scale elementary ladder, but is applied in the first time to a multi-scale fluidic network.
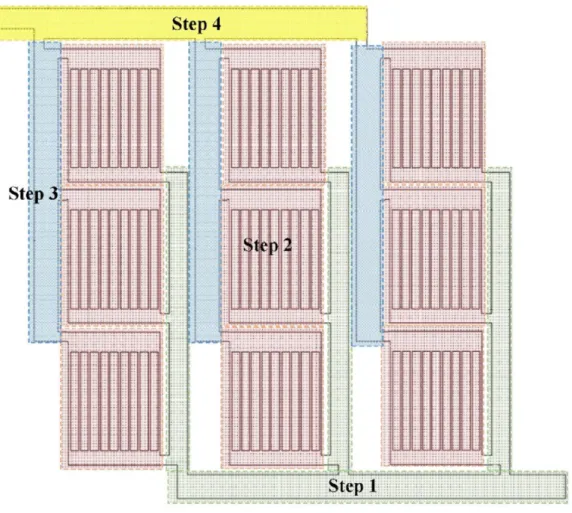
Regarding the complex multi-scale geometry, the simultaneous optimization of 13 baffles (9 for elementary distributors, 3 for intermediate distributors and 1 for principal distributor) is a highly challenging task, even prohibitive due to the difficulty in generating adapted meshes, complicated fluid-structure interactions and high requirement on computing facilities. In this study, the optimization process is divided into four steps with reasonable simplifications and assumptions.
• Step 1: Simulation on the intermediate collectors and the principal collector part (green color in Fig. 4) in order to evaluate the outlet pressure of each elementary ladder.
• Step 2: Sizing and optimizing the elementary perforated baffle in the distributor (red color in Fig. 4) of the elementary ladder and evaluating the pressure loss.
• Step 3: Sizing and optimizing the intermediate perforated baffle in each intermediate distributing manifold (blue color in Fig. 4) and evaluating the inlet pressure of intermediate distributors.
• Step 4: Sizing and optimizing the principal baffle in the principal distributor (yellow color in Fig. 4).
10
Figure 4. Division of optimization process in 4 steps.
- Step 1: Outlet pressure at each elementary ladder
Figure 5 shows the simulation domain for step 1 including three intermediate collectors and the principal collector. The aim of this step is to evaluate the pressure at each inlet which corresponds to the outlet pressure (Pout, i) of each elementary ladder. For 9 inlets of the simulation domain in Fig. 6 which represent the outlets of 9 elementary ladders, constant and equal mass flow-rate m is set as inlet
boundary condition. Different values of m ranging from 5.0×10⁻⁵ kg·s-1 to 1.0×10⁻² kg·s-1 were tested corresponding to the mean Rech number ranging from 10 to 2000. The boundary condition of outlet is set as pressure-outlet with zero static pressure.
11
Figure 5. Simulation geometry for step 1.
Figure 6 shows that the static pressure at each inlet of the simulation domain increases rapidly when mean Rech increases. At a certain mean Rech, the pressure at inlet A is always the highest while that at inlet I is the lowest. This is mainly due to the distance difference between each inlet to the common outlet. The calculated pressure data were used in the following steps.
Figure 6. Static pressure at the outlet of each elementary ladder as a function of mean Rech.
- Step 2: Elementary baffle
The results obtained in step 1 indicate that the outlet pressure of elementary ladder varies with the position, but it will not influence the flow field and the pressure drop (∆pelementary) when inlet mass flow-rate is identical for all ladders. So one elementary ladder (e.g., A) is studied here and the elementary baffle, once optimized, is applicable for all elementary ladders.
12
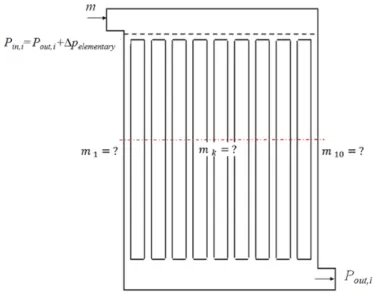
Figure 7. Simulation geometry of step 2.
The studied geometry in this step is then shown in Fig. 7. Constant velocity normal to the boundary of inlet surface is given (inlet mass flow-rate=m) and the boundary condition of outlet is set as
pressure-outlet with the static pressure value (Pout, i) calculated in step 1. The initial baffle has 18 orifices of uniform width (0.6 mm) and a global porosity of 0.23. Its geometry optimization follows the evolution algorithm developed in [62]. Optimized dimensions of the orifices under different mean Rech conditions are reported in the supplementary material of this paper.
- Step 3: Intermediate baffle
The aim of this step is to optimize the intermediate baffles. The studied geometry as shown in Fig. 8 is the intermediate distributor having one inlet and three outlets that correspond to the inlets of elementary ladders. It was observed that the pressure differences among three outlets are identical for three intermediate distributors (A-C; D-F; G-I). So the intermediate baffle, once optimized, is identical for all three intermediate distributors.
Constant velocity normal to the boundary of inlet surface is given (mass flow-rate=3m) and the
boundary condition for three outlets is set as pressure-outlet (Pin, A; Pin, B and Pin, C). The initial intermediate baffle has 6 orifices of uniform width (0.4 mm) and a global porosity of 0.02. Optimized dimensions of the orifices under different mean Rech conditions are given in the supplementary material of this paper.
13
Figure 8. Simulation geometry of step 3.
- Step 4: Principal baffle
The studied geometry is basically the same as before, but this time it concerns the principal distributor having one inlet and three outlets corresponding to the inlets of intermediate distributors, as shown in Fig. 9. Constant velocity normal to the boundary of inlet surface is given (mass flow-rate=9m) and the boundary condition for three outlets is set as pressure-outlet with the static pressure
values as Pin, A-C; Pin, D-F and Pin, G-I, respectively. The initial principal baffle has 9 orifices of identical width (0.4 mm) and a global porosity of 0.02. The optimized dimensions of the orifices are the same
14
when mean Rech increases from 10 to 2000. That is to say, there is no need to change the principal baffle under the tested conditions.
Figure 9.Simulation geometry of step 4.
4. RESULTS AND DISCUSSION
In this section, the numerical results on the flow field in different parts of the multi-scale network will be presented, together with the experimental visualization of the ink invasion for comparison. Then the flow distribution properties among parallel mini-channels in the basic and optimized fluidic networks will be compared and discussed. Finally the total pressure drop of the prototype obtained by CFD simulation and by experimental measurement will also be presented.
4.1 Flow field
4.1.1 CFD simulation results
Figure 10 shows the contours of velocity magnitude on the mid-depth surface (symmetry) of the basic multi-scale fluidic network under different mass flow inlet conditions. Recall that optimized baffles corresponding to a certain inlet mass flow-rate (mean Rech) are inserted at distributing manifolds of different scales and results obtained are shown in Fig. 10.
At low inlet flow-rate (min=4.5×10⁻⁴ kg·s-1; mean Rech=10), the velocity profiles in the distributors and in the collectors of different scales are regular and symmetric, implying that the flow patterns are rather laminar. It seems that the converging or diverging bifurcations do not much disturb the flow profiles and the impact of singular losses is not significant. The flow distribution among parallel mini-channels is relatively uniform for both basic and optimized networks, which will be further discussed in later sub-section.
When the inlet flow-rate is increased by a factor of 10 (min=4.5×10⁻³ kg·s-1; mean Rech=100), the velocity profiles in the distributor and in the corresponding collector of different scales are no longer symmetrical without baffles insertion (left side of Fig. 10b). A noticeable difference on the velocity profiles at the distributors or collectors of the same scale (elementary or intermediate) can also be observed. Some stagnant flow zones appear, particularly in the right corner of the elementary distributing manifolds and in the principal collector. This is mainly due to the stronger inertial force at
15
the higher velocity which has been discussed in detail in our previous work on the elementary ladder
[51]. On the contrary, regular and symmetric velocity profiles can still be observed for the optimized network. In fact, the contours of velocity magnitude seem rather similar under mean Rech=10 and mean
Rech=100 conditions, as shown in the right side of Figs. 10a and 10b.
With a further increase of inlet flow-rate by a factor of 10 (min=4.5×10⁻² kg·s-1; mean Rech=1000), the inertial force becomes still stronger. Together with the effects of singular losses at numerous converging/diverging bifurcations, stagnant flow zones, local vortex and micro-turbulences are easily observable at the left side of Fig. 10c. In the optimized network, symmetrical velocity profiles can no longer be maintained in the distributor and in the corresponding collector of different scales. Stagnant flow zones and local vortex can also be clearly observed at the right side of Fig. 10c, but the velocity profiles in 9 elementary distributors are similar in general. The resulted difference on flow distribution uniformity among 90 mini-channels due to the insertion of optimized baffles will be discussed in detail in later sub-section.
Figure 10. Contours of velocity magnitude in the multi-scale fluidic network under different inlet flow-rate conditions. Left side: basic network without baffles; right side: optimized network with baffles. (a) mean
16
4.1.2 Ink flow pattern visualization
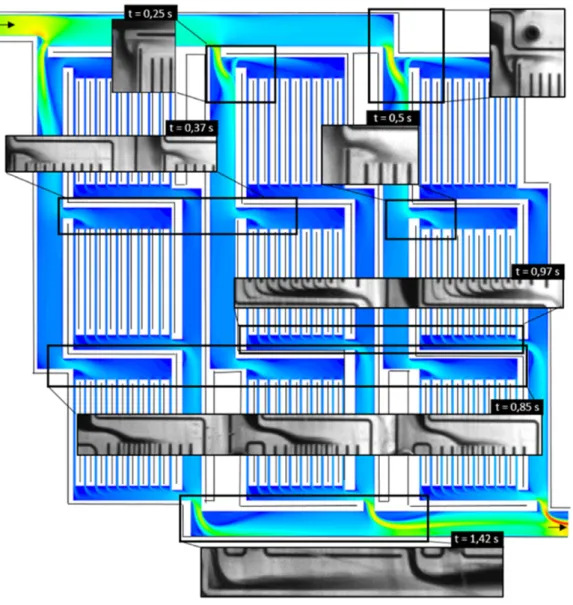
Figure 11 presents the images recorded by the fast camera, showing the ink invasion process through the multi-scale fluidic network with or without baffles insertion, at inlet mass flow-rate of 4.5×10⁻³ kg·s-1 (mean Rech=100). Note that the time t=0 s represents the moment when ink front arrives at the inlet port of the fluidic network.
At t=0.175 s, only two elementary ladders A and D next to the global inlet begin to be irrigated by the tracer. The ink front arrives at the elementary distributing manifold of ladders A and D while their parallel mini-channels have not been irrigated yet. At t=0.375 s, ink progresses towards the global outlet and more elementary ladders are involved. At that moment, ink front has arrived at the distributing manifold of elementary ladder C in optimized network (right side of Fig. 11) while that of basic network is still free of tracers. This tendency becomes clearly observable at figures of t=0.575 s, which show that parallel mini-channels of elementary ladder C in optimized network (right side) have already ink-invaded while those in the basic network are still untouched. The tracer remixing and redistribution at the downstream of elementary baffles next to the inlets of mini-channels can also be observed. Finally at t=0.775 s, ladder C in the optimized network has been entirely irrigated by tracers and the ink front arrives at the principal collecting manifold, which is not the case in the basic network.
In brief, differences on the ink progression and development behaviors between the basic and optimized fluidic networks may be clearly observed. The insertion of baffles tends to modify the flow profiles in distributors of different scales, leading to the redistribution of the fluid flow among different elementary ladders as well as among parallel mini-channels. Moreover, the additional hydraulic resistance by the insertion of baffles tends to guide the fluid flow towards the bottom-left corner of the network, which is initially the most difficult to be irrigated due to the inertial forces of the fluid flow.
The transit time for ink front from the global inlet to the global outlet is measured at 1.67 s for the optimized network and 1.92 s for the basic one. It seems that the residence time distribution is narrower in the optimized network compared to that in the basic one, but difficult to be credibly measured in the current test-rig. The connection between the residence time distribution and the flow distribution uniformity among parallel channels has been discussed in detail in our earlier study [65].
17
Figure 11. Visualization of the ink progression and development through the multi-scale fluidic network for mean Rech =100 (left: Basic network without baffles; right: optimized network with baffles).
4.1.3 Comparison between CFD results and visualization
Figure 12 presents a comparison between local flow behaviors simulated by CFD and those recorded by fast camera for the basic network under mean Rech=100. Recall that ink progression experimentally visualized indicates the transient fluid flow behaviors in the multi-scale network whereas the contours of velocity magnitude simulated show the steady-state flow patterns. For a
18
reasonable comparison, representative images showing details of local fluid flow have been captured at different moments of the video recorded by the fast camera. These local snapshots have then been placed next to the corresponding positions of the CFD flow field for comparison. Note that darker color represents higher flow velocity (more ink molecules) while light color means low flow velocity (fewer ink molecules). The gray scale is somewhat proportional to the velocity magnitude but cannot be quantitatively correlated.
Similar flow patterns may be observed on Fig. 12 between CFD results and visualization images at various locations of the multi-scale fluidic network, i.e., at the distributors and collectors of different scales. The micro-turbulences, the segregation of velocity vectors at bifurcations and the stagnant zones can be clearly identified, indicating the complex characteristics of fluid flow due to the complex multi-scale structure.
Figure 12. Comparison of local flow behaviors between CFD results and experimental results in the basic network under mean Rech=100.
19
The good agreement on the local flow profiles shown in Fig. 12 may serve as a qualitative experimental validation of the CFD results. Nevertheless, detailed information on the flow-rate or velocity magnitude in parallel mini-channels cannot be extracted from the recorded visualization images due to the small size of the mini-channels (1 mm in width) and inadequate resolution of the fast camera (640 × 480 pixels). As a result, only CFD results on the flow distribution uniformity among parallel mini-channels are presented and discussed in the following Figs 13-15.
4.2 Flow distribution uniformity
In this sub-section, CFD results on the relative flow-rate deviation σ (Eq. 1) and the
maldistribution factors MF (Eqs. 3, 4) will be reported, so as to quantify the fluid flow distribution uniformity among the parallel mini-channels.
4.2.1 Standard deviation
Figure 13 shows the flow-rate deviation of an individual mini-channel (i,j) compared to the mean value of all 90 mini-channels under mean Rech=10, 100 and 1000 conditions. Note that the hollow square curve (□) shows the σ values for the basic network while the solid square curve (■) represents those for the optimized network.
Under low inlet flow-rate condition (min=4.5×10⁻⁴ kg.s-1; mean Rech=10), the flow distribution curve for each elementary ladder of the basic fluidic network appears a somewhat different shape, as shown in Fig. 13a. The values of flow-rate are relatively high in channels close to the elementary outlet (e.g., CH8, 9, 10) while relatively low flow-rates may be observed in the first channel (CH1) and the middle channels (e.g., CH4, 5). The values of σi,j range from -31% (E5) to 50% (I10), indicating that the flow distribution among 90 parallel mini-channels is already non-uniform at mean Rech=10 . Regarding the flow distribution among different elementary ladders, C, G, I are relatively overfed whereas B, D, E are underfed. For the optimized fluidic network, small fluctuation of σi,j values (±9%) may be observed, implying that much more uniform flow distribution may be achieved owing to the insertion of optimized baffles.
When the inlet flow-rate is increased by a factor of 10 (min=4.5×10⁻³ kg.s-1; mean Rech=100), non-uniform flow distribution becomes clearly observable among 10 parallel mini-channels of each elementary ladder as well as among 9 elementary ladders of the basic network. Ladders A, D and G of the first row are relatively under-fed while ladders H, F, I close to the principal outlet are over-supplied. This is mainly due to the inertial effect so that the fluids tend to skip the nearest ladders they pass by. For each elementary ladder, the flow distribution curve generally appears an increasing shape form CH1 to CH10 with some exceptional local salients (e.g., CH3 in ladders B, E, H). This is because of the entrance effect so that fluids tend to develop in the elementary distributing manifold and skip the first two mini-channels next to the inlet, as can be seen in Fig. 10. Regarding the optimized network equipped with baffles, a smaller variation of flow-rate among parallel channels may be achieved, as indicated by the σi,j values ranging from -22% to 29%, (with respect to -54% to 88% for the basic network). The additional hydraulic resistances by the insertion of baffles alleviate the impact of inertial effect and regularize the flow profiles in the distributing manifolds of different scales, as also shown in Fig. 10.
20
(a)
21
(c)
Figure 13. Fluid flow distribution among parallel mini-channels of the multi-scale fluidic network. (a) mean
Rech=10; (b) mean Rech=100; (c) mean Rech=1000.
Under high inlet flow-rate condition (min=4.5×10⁻² kg.s-1; mean Rech=1000), the shapes of the flow distribution curve for different elementary ladders of the basic network are irregular with big rises and falls. For example, the value of σI,j of ladder I varies from -86% to 173%, with a big flow-rate jump from CH2 to CH3. Similar behaviors may also be observed in ladders F and H. Flow distribution non-uniformity is also clearly visible among elementary ladders: those close to the principal collector (F, H, I) are largely overfed while those close to the principal distributor (A, D, G) are underfed, again mainly due to the stronger inertial effect under higher velocity condition. The insertion of optimized baffles in the multi-scale network could smooth the troughs and crests of the flow-rate, leading to much smaller fluctuation of flow distribution curve in each elementary ladder. The values of σi,j range between -26% to +35% for the optimized network compared to -99% to 173% for the basic network.
4.2.2 Maldistribution Factor
The value of relative deviation σi,j indicates the departure on the flow-rate of individual channel to the mean value of all 90 channels whereas the value of maldistribution factor (MF) represents the flow maldistribution of a fluidic network at a global level [17, 66]. Figure 14 shows the evolution of MFi for each elementary ladder of the multi-scale network as a function of mean Rech.
22
For a mean Rech ranging from 10 to 2000, the values of MFi for all elementary ladders of the optimized network are smaller than 0.27, showing relatively uniform flow distribution. For the basic network however, MFi values generally increase rapidly with increasing mean Rech, and their internal gap is also getting bigger. Again, ladder I of the basic network always gets the highest MFi values, mainly due to the impact of inertial forces evoked above.
Figure 14. MFi values of each elementary ladder as a function of mean Rech (blue symbols for optimized
network; red symbols for basic network).
Figure 15 shows the evolution of the MFnetwork for a whole multi-scale network as a function of mean Rech. The benefit of the insertion of optimized perforated baffles on the improvement of distribution uniformity can be highlighted. Generally, the MFnetwork value for the basic network increases exponentially from 0.195 to 0.747 when the mean Rech increases from 10 to 2000. For the optimized network, the MFnetwork value is only 0.043 at mean Rech=10, and can be maintained under 0.19 for mean Rech up to 2000.
23
Figure 15. Evolution of MFnetwork values for the multi-scale fluidic network as a function of mean Rech with
or without perforated baffles.
The noticeable augmentation in MFnetwork values for the optimized fluidic network under high mean Rech condition is mainly due to three reasons. Firstly, the CFD results are less accurate due to the influences of local turbulent flows and vortex. Hence the size optimization of baffles’ orifices depending strongly on the CFD results is less performant. Secondly, the smallest size of orifices is limited at 0.2 mm considering the fabrication uncertainty. The subtle size variation of orifices is not adequate facing high flow velocity. Finally, constant velocity profile normal to the inlet surface of elementary ladder is assumed during optimization, which is obviously not realistic at high mean Rech.
4.3 Pressure losses
Figure 16 shows the evolution of the pressure drop of the multi-scale network (∆pnetwork) as a function of the mean Rech. Both CFD results and experimental results are presented for comparison. It can be observed that the ∆pnetwork values for both basic and optimized networks increase exponentially with the increasing mean Rech. The CFD results are generally in good agreement with the experimental results. The slightly higher data experimentally measured compared to those simulated results are mainly due to the fact that the connection pipes between the measurement points and the inlet or outlet of the network are not taken into account in the simulation.
Noticeable augmentation on the pressure drop is caused by different baffles equipped. At mean
Rech=100, ∆pnetwork increases by 58 % from 5.5 kPa (basic network) to 8.7 kPa (optimized network). More significant augmentation is also observed at mean Rech=1000: ∆pnetwork increases by a factor of 2.3 from 333 kPa (basic network) to 777 kPa (optimized network). More pumping power should be consumed to overcome the stronger inertial forces of fluid flow at high flow-rate, in order to homogenize the initial non-uniform distribution into uniform among the 90 parallel mini-channels.
24
Figure 16. Pressure drop for the multi-scale fluidic network as a function of mean Rech with or without
perforated baffles.
5. CONCLUSIONS AND PERSPECTIVES
This study investigates the fluid flow characteristics of a multi-scales network having 90 mini-channels in parallel. In order to improve the flow distribution uniformity in the multi-scale network, geometrically optimized perforated baffles are inserted in the distributing manifolds of different scales. The main results on the distribution uniformity and on the global pressure drop for both basic and optimized networks are summarized in Table 2.
Table 2. Summary of distribution uniformity and pressure drop in the basic network and in the optimized network.
Mean
Rech σ
i,j MFnetwork ∆pnetwork
Basic
network Optimized network network Basic Optimized network network Basic Optimized network
10 -31%~50% ±9% 0.195 0.043 - -
100 -54%~88% -22%~29% 0.351 0.138 5.5 kPa 8.7 kPa
1000 -86%~173% -26%~35% 0.737 0.172 333 kPa 777 kPa
Based on the results presented above, the following conclusions may be reached.
• For the basic fluidic network, fluid flow distribution is non-uniform even at very small mean Rech (e.g., 10). The distribution non-uniformity increases rapidly with increasing flow-rate.
25
• For the optimized fluidic network equipped with perforated baffles, relatively uniform distribution could be maintained even at high mean Rech. But higher pressure drop of the network will be induced.
• Local flow profiles simulated by CFD are in good agreement with the visualization results obtained by fast camera and tracers.
Our current work is focused on the investigation of heat transfer characteristics of such multi-scale fluidic network used as a heat sink to evacuate the heat generated in a surface. The development and implementation of adequate characterization techniques for quantitative analyses of fluid low and heat transfer is one of our on-going work. Moreover, alternately stacking a number of multi-scale structured plates to construct a novel plate heat exchanger as proposed by Luo and Fan [67] is also interesting. The characterization of its hydrodynamic and thermal performances and the comparison with a commercially available standard plate heat exchanger will also be carried out to illustrate the improvements achieved by multi-scale conception and by optimized fluid distribution.
ACKNOWLEDGEMENT
This work is financed by the “Région Pays de la Loire” within the project “Nouvelle équipe de recherche”. Authors are grateful to Mr. Gwenaël BIOTTEAU for the fabrication of the prototypes and to Dr. Min WEI for his help on the CFD-based evolutionary algorithm.
NOMENCLATURE
dk diameter of orifices [m]
mi,j mass flow-rate in mini-channel i,j [kg·s-1] 𝑚𝑚 mean flow-rate among 90 mini-channels [kg·s-1] MF Maldistribution factor [-]
min inlet mass flow-rate [kg·s-1]
P pressure [Pa]
Rech Reynolds number in micro-channel [-]
t time step [-]
Greek symbols
∆p pressure loss [Pa]
µ viscosity [kg·m-1·s-1]
ρ density of the fluid [kg·m-3]
26 Subscripts ch mini-channel in inlet k channel index out outlet
REFERENCES
[1] L. Luo, Heat and Mass Transfer Intensification and Shape Optimization: A Multi-Scale Approach, Springer-Verlag, London, 2013.
[2] J.M. Commenge, L. Falk, Methodological framework for choice of intensified equipment and development of innovative technologies,Chem. Eng. Process.84 (2014) 109–127.
[3] T. Van Gerven, A. Stankiewicz, Structure, Energy, Synergy, Time - The Fundamentals of Process Intensification. Ind. Eng. Chem. Res. 48(2009) 2465–2474.
[4] Y. Fan, L. Luo, Recent Applications of Advances in Microchannel Heat Exchangers and Multi-Scale Design Optimization, Heat Transfer Eng. 29 (2008) 461–474.
[5] M.G. Khan, A.A. Fartaj, A review on microchannel heat exchangers and potential applications, Int. J. Energy Res. 35 (2011) 553–582.
[6] B.S. Tilley, On microchannel shapes in liquid-cooled electronics applications, Int. J. Heat Mass Transfer 62 (2013) 163–173.
[7] T. Dixit, I. Ghosh, Review of micro- and mini-channel heat sinks and heat exchangers for single phase fluids, Renewable Sustainable Energy Rev. 41 (2015) 1298–1311.
[8] V. Hessel, H. Löwe, F. Schönfeld, Micromixers - A review on passive and active mixing principles, Chem. Eng. Sci. 60 (2005) 2479–2501.
[9] L. Falk, J.M. Commenge, Performance comparison of micromixers, Chem. Eng. Sci. 65 (2010) 405–411. [10] G.S., Sturm, M.D., Verweij, A. Stankiewicz, G.D., Stefanidis, Microwaves and microreactors: Design
challenges and remedies, Chem. Eng. J. 243 (2014) 147–158
[11] P. Plouffe, D.M. Roberge, A. Macchi, Liquid-liquid flow regimes and mass transfer in various micro-reactors, Chem. Eng. J. 300 (2016) 9–19.
[12] J.P. Meyers, H.L. Maynard, Design considerations for miniaturized PEM fuel cells, J. Power Sources. 109 (2002) 76–88.
[13] A. Stankiewicz, Process intensification in in-line monolithic reactor. Chem. Eng. Sci. 56 (2001) 359–364. [14] P.O. Lopez-Montesinos, A.V. Desai, P.J.A. Kenis, A three-dimensional numerical model of a micro laminar
flow fuel cell with a bridge-shaped microchannel cross-section, J. Power Sources. 269 (2014) 542–549. [15] E.V. Rebrov, S.A. Duinkerke, M.H.J.M. de Croon, J.C. Schouten, Optimization of heat transfer
characteristics, flow distribution, and reaction processing for a microstructured reactor/heat-exchanger for optimal performance in platinum catalyzed ammonia oxidation, Chem. Eng. J. 93 (2003) 201–216.
27
[16] J. Dreimann, P. Lutze, M. Zagajewski, A. Behr, A. Gorak, A.J. Vorholt, Highly integrated reactor separator systems for the recycling of homogeneous catalysts, Chem. Eng. Process. 99 (2016), 124–131. [17] Z. Anxionnaz, M. Cabassud, C. Gourdon, P. Tochon, Heat exchanger/reactors (HEX reactors): Concepts,
technologies: State-of-the-art, Chem. Eng. Process. 47 (2008) 2029–2050.
[18] X. Guo, Y. Fan, L. Luo, Multi-channel heat exchanger-reactor using arborescent distributors: A characterization study of fluid distribution, heat exchange performance and exothermic reaction, Energy 69 (2014) 728–741.
[19] S. Schwolow, A. Neumüller, L. Abahmane, N. Kockmann, T. Röder, Design and application of a millistructured heat exchanger reactor for an energy-efficient process. Chem. Eng. Process. 108 (2016) 109– 116.
[20] M. Matlosz1, L. Falk, J.M. Commenge, Structured multi-scale process systems design and engineering - the role of microreactor technology in chemical process design, in V. Hessel et al. (Eds.), Micro process engineering: a comprehensive handbook, Wiley-VCH Verlag GmbH & Co. 2009.
[21] L. Hohmann, K. Kössl, N. Kockmann, G. Schembecker, C. Bramsiepe, Modules in process industry-A life cycle definition, Chem. Eng. Process. 111 (2017) 115–126.
[22] J.M. Commenge, L. Falk, J.P. Corriou, M. Matlosz, Optimal design for flow uniformity in microchannel reactors. AIChE J. 48 (2002) 345–358.
[23] R.J. Kee, P. Korada, K. Walters, M. Pavol, A generalized model of the flow distribution in channel networks of planar fuel cells. J. Power Sources 109 (2002) 148–159.
[24] M. Pan, X. Wei, D. Zeng, Y. Tang, Trend prediction in velocity distribution among microchannels based on the analysis of frictional resistances, Chem. Eng. J. 164 (2010) 238–245.
[25] S.A. Solovitz, J. Mainka, Manifold design for micro-Channel cooling with uniform flow distribution, J. Fluids Eng. 133 (2011) 051103 (2011).
[26] S. Kim, E. Choi, Y. I. Cho, The effect of header shapes on the flow distribution in a manifold for electronic packaging applications, Int. Commun. Heat Mass Transfer 22 (1995) 329–341.
[27] O. Tonomura, S. Tanaka, M. Noda, M. Kano, S. Hasebe, I. Hashimoto, CFD-based optimal design of manifold in plate-fin microdevices, Chem. Eng. J. 101 (2004) 397–402.
[28] M. Pan, D. Zeng, Y. Tang, D. Chen, CFD-based study of velocity distribution among multiple parallel microchannels, J. Comput. 4 (2009) 1133–1138.
[29] D. Zeng, M. Pan, Y. Tang, Qualitative investigation on effects of manifold shape on methanol steam reforming for hydrogen production, Renewable Energy 39 (2012) 313-322.
[30] C.M. Huang, S.S. Shy, C.H. Lee, On flow uniformity in various interconnects and its influence to cell performance of planar SOFC, J. Power Sources 183 (2008) 205–213.
[31] E.S. Cho, J.W. Choi, J.S. Yoon, M.S. Kim, Experimental study on microchannel heat sinks considering mass flow distribution with non-uniform heat flux conditions, Int. J. Heat Mass Transfer 53 (2010) 2159– 2168.
[32] R. Manikanda Kumaran, G. Kumaraguruparan, T. Sornakumar, Experimental and numerical studies of header design and inlet/outlet configurations on flow mal-distribution in parallel micro-channels, Appl. Therm. Eng. 58 (2013) 205–216.
[33] J. Wang, Pressure drop and flow distribution in parallel-channel configurations of fuel cells: Z-type arrangement. Int. J. Hydrogen Energy 35 (2010) 5498–5509.
28
[34] J. Wang, Theory of flow distribution in manifolds, Chem. Eng. J. 168 (2011) 1331–1345.
[35] D. Tondeur, Y. Fan, J.M. Commenge, L. Luo, Flow and pressure distribution in linear discrete “ladder-type” fluidic circuits: An analytical approach, Chem. Eng. Sci. 66 (2011) 2568–2586.
[36] N. Midoux, D. Tondeur, The theory of parallel channels manifolds (Ladder networks) revisited part 1: Discrete mesoscopic modelling, Can. J. Chem. Eng. 92 (2014) 1798–1821.
[37] N. Midoux, D. Tondeur, The theory of parallel channels manifolds (ladder networks) revisited part 2: Design for uniform cross-flow distribution, Can. J. Chem. Eng. 93 (2015) 121–140.
[38] J. Wang, H. Wang, Discrete approach for flow field designs of parallel channel configurations in fuel cells, Int. J. Hydrogen Energy 37 (2012) 10881–10897.
[39] J. Wang, H. Wang, Discrete method for design of flow distribution in manifolds, Appl. Therm. Eng. 89 (2015) 927–945.
[40] M. Saber, J.M. Commenge, L. Falk, Rapid design of channel multi-scale networks with minimum flow maldistribution, Chem. Eng. Process. 48 (2009) 723–733.
[41] J.M. Commenge, M. Saber, L. Falk, Methodology for multi-scale design of isothermal laminar flow networks, Chem. Eng. J. 173 (2011) 334–340.
[42] M. Saber, J.M. Commenge, L. Falk, Heat-transfer characteristics in multi-scale flow networks with parallel channels, Chem. Eng. Process. 49 (2010) 732–739.
[43] M. Saber, J.M. Commenge, L. Falk, Microreactor numbering-up in multi-scale networks for industrial-scale applications: Impact of flow maldistribution on the reactor performances, Chem. Eng. Sci. 65 (2010) 372– 379.
[44] S. Kim, S. Lorente, A. Bejan, Vascularized materials: Tree-shaped flow architectures matched canopy to canopy, J. Appl. Physics 100 (2006) 063525.
[45] K.H. Cho, J. Lee, M.H. Kim, A. Bejan, Vascular design of constructal structures with low flow resistance and nonuniformity, Int. J. Therm. Sci. 49 (2010) 2309–2318.
[46] K.H. Cho, M.H. Kim, Fluid flow characteristics of vascularized channel networks, Chem. Eng. Sci. 65 (2010) 6270–6281.
[47] K.H. Cho, M.H. Kim, Transient thermal-fluid flow characteristics of vascular networks, Int. J. Heat Mass Transfer 55 (2012) 3533–3540.
[48] K.H. Cho, W.P. Chang, M.H. Kim, A numerical and experimental study to evaluate performance of vascularized cooling plates. Int. J. Heat Fluid Flow, 32 (2011) 1186–1198.
[49] M. Pan, Y. Tang, H. Yu, H. Chen, Modeling of velocity distribution among microchannels with triangle manifolds, AIChE J. 55 (2009) 1969–1982.
[50] D. Tondeur, Y. Fan, J. M. Commenge, L. Luo, Uniform flows in rectangular lattice networks. Chemical
Engineering Science. 66, 5301–5312 (2011).
[51] C. Pistoresi, Y. Fan, L. Luo, Numerical study on the improvement of flow distribution uniformity among parallel mini-channels, Chem. Eng. Process. 95 (2015) 63–71.
[52] M. Saeed, M.H. Kim, Header design approaches for mini-channel heatsinks using analytical and numerical methods, Appl. Therm. Eng. 110 (2017) 1500–1510.
29
[53] M. Pan, Y. Tang, L. Pan, L. Lu, Optimal design of complex manifold geometries for uniform flow distribution between microchannels, Chem. Eng. J. 137 (2008) 339–346.
[54] J.C.K. Tong, E.M. Sparrow, J.P. Abraham, Geometric strategies for attainment of identical outflows through all of the exit ports of a distribution manifold in a manifold system, Appl. Therm. Eng. 29 (2009) 3552–3560.
[55] J.M. Jackson, M.L. Hupert, S.A. Soper, Discrete geometry optimization for reducing flow non-uniformity, asymmetry, and parasitic minor loss pressure drops in Z-type configurations of fuel cells, J. Power Sources, 269 (2014) 274–283.
[56] E.V. Rebrov, J.C. Schouten, M.H.J.M. de Croon, Single-phase fluid flow distribution and heat transfer in microstructured reactors, Chem. Eng. Sci. 66 (2011) 1374-1393.
[57] O.K. Siddiqui, S.M. Zubair, Efficient energy utilization through proper design of microchannel heat exchanger manifolds: A comprehensive review, Renewable Sustainable Energy Rev. 74 (2017) 969–1002. [58] L. Luo, M. Wei, Y. Fan, G. Flamant, Heuristic shape optimization of baffled fluid distributor for uniform
flow distribution, Chem. Eng. Sci. 123 (2015) 542–556.
[59] L. Luo, Y. Fan, G. Flamant, M. Wei, Method for determining characteristics of holes to be provided through a plate and corresponding programme, WO/2015/028758, 2015.
https://patentscope.wipo.int/search/fr/WO2015028758
[60] J.K. Tong, E.M., Sparrow, J.P., Abraham, Attainment of flowrate uniformity in the channels that link a distribution manifold to a collection manifold, J. Fluids Eng. 129 (2007) 1186-1192.
[61] X. Liu, J. Yu, Numerical study on performances of mini-channel heat sinks with non-uniform inlets, Appl. Therm. Eng. 93 (2016) 856–864.
[62] M. Wei, Y. Fan, L. Luo, G. Flamant, CFD-based evolutionary algorithm for the realization of target fluid flow distribution among parallel channels, Chem. Eng. Res. Des. 100 (2015) 341–352.
[63] M. Wei, G. Boutin, Y. Fan, L. Luo, Numerical and experimental investigation on the realization of target flow distribution among parallel mini-channels, Chem. Eng. Res. Des. 113 (2016) 74–84.
[64] M. Wei, Y. Fan, L. Luo, G. Flamant, Design and optimization of baffled fluid distributor for realizing target flow distribution in a tubular solar receiver, Energy, in press.
[65] X. Guo, Study of transfer intensification of a miniature multi-channel multifunctional heat exchanger, PhD thesis of Grenoble University, France, 2013.
[66] Y. Fan, R. Boichot, T. Goldin, L. Luo, Flow distribution property of the constructal distributor and heat transfer intensification in a mini heat exchanger, AIChE J. 54 (2008) 2796–2808.
[67] L. Luo, Y. Fan, Plate heat exchanger, WO2015/193600, 2015. https://patentscope.wipo.int/search/en/WO2015193600
![Figure 1. Geometry and dimensions of the multi-scale fluidic network [10, 3, 3] (unit: mm).](https://thumb-eu.123doks.com/thumbv2/123doknet/11479007.292260/5.892.166.762.250.602/figure-geometry-dimensions-multi-scale-fluidic-network-unit.webp)