HAL Id: cirad-00168367
http://hal.cirad.fr/cirad-00168367
Submitted on 27 Aug 2007
HAL is a multi-disciplinary open access
archive for the deposit and dissemination of
sci-entific research documents, whether they are
pub-lished or not. The documents may come from
teaching and research institutions in France or
abroad, or from public or private research centers.
L’archive ouverte pluridisciplinaire HAL, est
destinée au dépôt et à la diffusion de documents
scientifiques de niveau recherche, publiés ou non,
émanant des établissements d’enseignement et de
recherche français ou étrangers, des laboratoires
publics ou privés.
Virginie Emonet-Denand, Vincent Porphyre, Nguyen Thi Hoa Ly, Dang
Hoang Bien, Jean-Marie Paillat
To cite this version:
Virginie Emonet-Denand, Vincent Porphyre, Nguyen Thi Hoa Ly, Dang Hoang Bien, Jean-Marie
Paillat. Classification of pig farms regarding environmental risk and internal use of pig manure.
V.Porphyre Nguyen Que Coi. Pig Production Development, Animal-Waste Management and
Envi-ronment Protection: a Case Study in Thai Binh Province, Northern Vietnam, CIRAD-PRISE
publi-cations, pp.83-106, 2006. �cirad-00168367�
To better understand the risks of pollution in the Thai Binh province’s context, 43 surveys were carried out to analyze and represent the diversity of effluent management practices. The implemented methodology was based on the construction of environmental indicators in order to estimate environmental risks, and an ap-proach based on qualitative observations and statistical methods to classify farms and propose a relevant typology. The observed pollution was always due to discharge of liquid manure; solid waste was always used by farmers themselves. The animal stock was the determining factor of environmental risk. Other con-straints were identified in terms of structure, i.e. the size of the pond or the area farmed, and in terms of agri-cultural practices, i.e. types of waste (liquid/solid) and local possibilities for use.
Regarding Environmental Risk
and Internal Use
of Pig Manure
V. Emonet-Denand, V. Porphyre, Nguyen Thi Hoa Ly,Introduction
The effects of changes in the economic and technical context of pig farms on their operation and performance vary according to initial outlay from farmers, their projects, means of organization and management of productive systems and investment possibilities (1). In this array of animal husbandry sys-tems in Vietnam, little is known about strategies for managing livestock farm effluents: what are these management practices? What defines them? How do they evolve with the specialization of farms towards pig husbandry? What links exist between producers of livestock effluents and users (crops, ponds)? What are the risks associated with these practices and means of capitalizing on this waste production?
Given the diversity present, the work carried out on pig farms in Thai Binh province from March to August 2005 and presented in this chapter aimed to identify the existing or potential problems of pollution by livestock farm effluents, in the context of intensification of pork production. The exposure of “high-risk” practices for the environment and the identification of their deter-mining factors aims, in the long term, to encourage the development of less polluting agricultural production systems.
The construction of a typology constitutes a first necessary step to better define the varying effects of pig farm waste management practices on the envi-ronment and to adapt research and development to the various needs and structures. This typology is based on data from surveys carried out with farmers and through calculation of environmental indicators; in addition, it has been built up by using multivariate sta-tistical methods.
In order to carry out the surveys, the sampling (43 farm-ers) sought to represent the diversity of farms with regard to production and management of pig excre-ment. The lack of reliable regional data (census, sur-veys) nevertheless makes it impossible to assess the statistical and spatial representativeness of this sample. However, it is known that communes make agricultural develop-ment policy choices: specializa-tion in poultry and/or pigs and/or fish farming. Given that more than 95% of farmers are fattening between 1 and 3 pigs, it can be deduced that the number of “big” farms has been overestimated. There are not
many very big farms of more than 15 sows, nor spe-cialized farms (> 100 sows). These operations are still scarce and are not present in all communes of the province. In addition, the avian influenza epidemic was a constraint given that all farms practising intensive poultry production had to be avoided. Moreover, many farmers stopped keeping poultry, temporarily modify-ing their animal waste management practices. In this case, the analysis was based the farm’s former prac-tices. Finally, households that have in-stalled Chinese digesters are “showcases” in terms of management of effluents for farmers and local authorities. Accordingly, although this kind of farmer appears to be overrepre-sented in the sample, we soon found it to be essential to study the management of these systems destined to proliferate, given their popularity with farmers and authorities, in addition to the profound changes that they cause in terms of polluting discharges.
In this study, the farm is the central subject, considered as decision-making centre, production and/or utiliza-tion unit of organic matter. The methodology used draws on the work of Paillat et al., 2003 (2) on Réunion Island where a typology of livestock farming effluents management systems was developed. The surveys were carried out using the method of comprehensive analy-sis of the farm that includes an analysis of its overall operation and a diagnosis of the targeted study field, here the management of animal excreta. By ope-ration, we mean “the sequence of decisions made by the farmer and the farmer’s family within a set of con-straints and assets with a view to attaining objectives they have set themselves and that govern the produc-tion processes present on the farm” (3). This vision of the farm must be placed in a temporal context. Deci-sions taken currently are in part the outcome of past development, and inform about the future of the farm and possible changes. The farm will be described by its capacity and its produce, which will give a definition of the combination of its various types of production; this includes an inventory of plant and animal produce as well as how this production is conducted. These types of production are ranked in order of area of land used and of quantity of produce, their enhancement and promotion (marketing, processing), technical practices depending on to the intensity of input use, yields and performances per animal or per batch, and numbers of animals. It is within the choices leading to a combination of kinds of production that lies the essence of strategic choices.
The categories studied – in particular the family, the apparatus of production and history – are then ana-lyzed from two angles: firstly considering their rela-tionship with the combination of types of production (namely how certain characteristics influence, limit or increase the range of items being produced on the farm), the methods and behaviour adopted and the technical and economic performances; secondly with the past or current decisions that they reveal, some characteristics are the expression of important choices that go beyond the combination of types of production and entail the management of the farm. The coherence of decisions must therefore be clear and in keeping
with the vision that the farmer and his family have of the situation.
We will firstly present the practices of farmers when dealing with animal excreta and we will highlight ele-ments of differentiation between farms regarding to their operation relative to the management of organic matter. The second part will deal with the environmen-tal risk associated to these practices, with an attempted quantification in order to also differentiate between pork production systems. Finally, the third part will present the typology constructed from the dif-ferentiation of practices and the quantification of risks.
Box 1: Kinds of pig farming
- Farrowing: Farmers own sows and sell their offspring after weaning (7 to 10 kg)
- Pre-fattening (“got” pigs): Farmers raise piglets from weaning until about 25 kg. They are then sold on to
another farmer for the rest of their growth, or sold for export. There are many Vietnamese farmers who buy piglets after weaning to raise them until they weigh 25 kg.
- Fattening (“thit” pigs): Farmers raise weaned piglets or pigs of 25 kg to obtain pigs fattened for meat with
a final weight of between 45 and 90 kg. Note:
Vietnamese farmers traditionally have the advantage of decisional flexibility. They can easily switch to another kind of livestock depending on their available fodder resources, available space in their buildings, the market price of meat and their liquidity needs. Nevertheless, such a course of action is not possible on industrial-type “farms”, operated on a batch system and with permanently optimized infrastructure.
This opportunist nature performs the role of a market regulator. The big production units, along with the me-dium-sized and small farms, complement each other for the supply of a common market. The flexibility of small and medium-sized farms wards off crisis, in particular in the pork sector where there are large variations in market prices. While the big farms are efficient but not very flexible, the small and medium-sized farms are less intensive but more reactive. This is true not only of pig production, but also of the pig slurry commodity chain.
Animal waste management practices on pig
farms
Farming systems and the flows of effluents
under consideration
Figure 1 presents the main constitutive elements of a
farm with production consumption flows as well as flows of plant or livestock by-products. The farm is split into two parts: the area of inhabited land, located in the village, of variable size, but often small, with the house, the garden and any stock of pigs, birds and fish kept on it; the usually constant area of farmland used for growing crops.
Animal and plant produce are completely integrated. The flows between types of farming are numerous (Figure 1). Waste from livestock (pigs, poultry, cattle and water buffalo) and the household (human excreta) play a central part in the integration of the different types of farm-ing, sometimes even between different farms. To describe this management, we will conjointly
use structural elements, i.e. size of farm, livestock buildings, storage facilities, location on the farm, and practices, i.e. drainage of buildings, processing, use on the farm, transfers between farms (4). Figure 2 presents the diversity of types of waste from livestock farms, drained, stored, processed and put to use on the farm or elsewhere.
Quantities produced and size of farm
Quantitative data for production of excreta per pig and per day are very variable, depending on kinds of animal and diet. Owing to lack of local references, we have esti-mated them by making simplifying hypotheses based on the bibliography. We have assumed that the weight of excreta, faeces and urine, produced per animal is lin-early proportional to the weight of the animal (5). This coefficient decreases as the pigs grow bigger (6): from 8.6% at 41.9 kg live weight, it goes down to 3.8% at 130 kg live weight. On the farms surveyed, most pigs fat-tened for meat are raised until they weigh 50-70 kg. We will therefore use the coefficient 7% of excreta produced per kilogramme of live weight. Given their weight when adults1, the coefficient, used for the sows2, will be lower
(3.8%). The results are expressed in weight and not in volume, according to local custom. The diverse farming strategies, feeding methods and genetics used in the course of the same year all make the situation complex for the assessment of speed of animal growth. We will therefore use the local reference of 500 gramme/day of Average Daily Gain (ADG).
The quantities of excreta produced on the farms
sur-veyed vary from 2 to 300 metric tons per year, this pro-duction being directly proportional to the size of the herd. Not being restricted by any upper limit, farms vary greatly. Large seasonal variations can be observed in terms of organic matter, for example when livestock farmers increase their stock when prices are high. Although this phenomenon is a general trend, it is particularly prevalent on medium-sized and large farms, not committed to a Western-style intensive system. Thus some farms (n=6) have, some years, doubled their stock in winter. The daily quantity of exc-reta to be managed is accord-ingly greater. The con-sequences in terms of management are significant on farms where the building is located over the fish-farming pond. The balance of the integrated system can be upset depending on the amplitude of change. Western-style intensive system farrow-to-finish farms however maintain stable stock levels.
Farm buildings
i) Location of buildings
Some pig farms are made up of several groups of buildings resulting from successive enlarge-ments. The sheds are separated through lack of space or
Figure 2: The various types of pig farm effluents produced and their destination (L=Liquid, S=Solid)
1 120 kg for local Mong Cai sows and 200kg for Large White, Landrace or related breeds. 2 Adult sows and gilts are grouped together in calculations.
because of a specific development on a pond. Buildings are for the most part located on land used for dwellings, in the village. A trend can however be observed to move buildings to agricultural land when pig farms are enlarged: all small-scale farms (0 to 1
sows, < 5 pigs fattened per batch) and 80% of medium-sized farms (1 < sows < 5, 20 to 30 pigs fat-tened per batch) have their building on land used for dwellings, compared with only 45% of farms (5 sows, > 30 to 50 pigs fattened per batch).
The construction of the building on agricultural land can be for several reasons: a) the land for dwelling is on the edge of the village and the farmer owns a piece of farmland nearby that he has converted into building land; b) following the conversion of a low-lying paddy field into a pond, the farmer has constructed a building on the pond, and c) the farm is an industrial operation (a “farm”).
ii) Kinds of buildings observed
The flooring material used in buildings determines the type of produce to be managed. Table 1 shows the diversity of existing buildings according to size of pig stock. The pigs on the farms surveyed are mostly raised on concrete floors. The variety in livestock waste observed is therefore mostly due to the draining, sto-rage and processing practices selected by the farmer.
Recent intensive farm building – On the biggest farms, there are modern, intensive-style installations, with a cages and open metal flooring. The pig farms visited were structured as follows (n=5): sows in gestation and boars are stalled individually on concrete flooring; pigs for meat being fattened and finished are raised in col-lective pens on concrete, the maternity sections are on open metal flooring, as are weaned piglets. These buildings exist only on farms with more stock than 10 sows with fattening. The open metal flooring systems are not mounted on a pit, but on concrete paving. Liquid excreta and cleaning water go through the gra-ting, but solid effluents are either scraped off and stored, or recovered with the liquid effluents according to the farmer’s strategy.
Semi-industrial building with concrete flooring – The pigs are housed in concrete stalls. The size of stalls varies from one farm to another from 3 to 10 m2. The
flooring is smooth and slightly sloped. At the lower end of the stall, a channel running through all the stalls enables effluents to be drained off. Some old buildings have dark, cramped stalls with awkward access, while other more recent ones are open and spacious. Traditional stall – Sows are housed either in concrete stall identical to those of the pigs, or in “traditional stalls”. The flooring of a traditional stall is made of con-crete or bricks. It is on 2 levels separated by a step of 20 to 50 cm. the sow eats and sleeps on the upper level, while excreta accumulates on the lower level. Often a litter made of straw and/or rice husks is added on the lower level. Other waste is added there: food waste, dry plants, etc. These stalls are sometimes the only building of very small farms (1 sow or 2 to 3 fat-tening pigs/year). Some of the bigger farms have retained this building for sows or storage of excreta.
Table 1: distribution of buildings by kind of farm (n=43)
0 to 2 sows and/or < 20 pigs 0 to 5 sows and/or 20 < pigs < 50 > 5 sows and/or > 50 pigs
Traditional shed 3 4 1 Modern building con-crete < 5 stalls 2 14 6 Modern building con-crete > 5 stalls 0 5 9 Recent inten-sive farm building 0 0 5
Figure 3: porcs charcutiers sur sol en béton. A l'ar-rière, on aperçoit
Cleaning and drainage of pig excreta
For each strategy that makes use of livestock waste – or does not – there is a corresponding specific drainage practice. Two main practices lead to the
pro-duction of four kinds of untreated products: i) practices that mix liquid forms (urine, cleaning water) with solid (faeces), resulting in a liquid slurry or in a manure when mixed with a litter, and ii) practices that separate these forms, resulting in a scraped slurry and liquid waste.
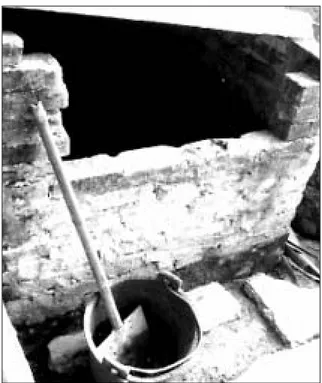
Figure 4: Bucket and spade for scraping
on a Thai Binh farm, April 2005
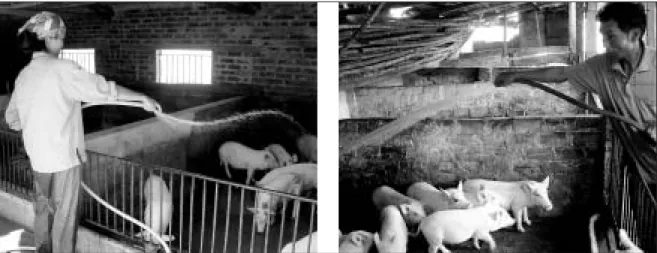
Figure 5: Cleaning with water of modern stalls with concrete flooring.
i) No separation of liquid and solid waste
The farmer has a traditional stall. Excreta are mixed with litter and form manure. The upper level of the stall (for sleeping/lying down) is sometimes scraped but rarely cleaned with water. The concrete flooring of the building is cleaned with a hosepipe or a bucket when the buil-ding has no running water supply. The slight slope in the floor and the water pressure carry the excreta towards the back of the stall. A channel takes this liquid slurry outside the building. In summer, farmers clean their building 1 to 3 times a day depending on the tempera-ture. Farmers also use water to cool the animals down. Sometimes, a tub is provided at the back of the stall for the animals to bathe in. In winter, the frequency of cleaning drops to only 1 to 4 cleaning(s) a week.
ii) Separation of liquid and solid waste
The floor is scraped and then rinsed with water with the same frequency as before. The nature of the scraped slurry depends on the scraping surface and on the effi-ciency of the cleaning. It can be considered that 50 to 60% of urine and 95 to 100% of faeces are scraped off in this way. Some farmers, having no water in winter (no pipe, canal dried out), wipe away liquid effluent with a cloth after having scraped the floor.
Liquid waste - urine and cleaning water – flows away with gravity. It flows into a pit, a water hole, a fish-farming pond, a river or a communal canal. In 80% of farms surveyed, the dominant strategy is scraping. However, the bigger the farm, and the more diversi-fied the potential uses of the effluents, the more the choices of farmers are varied. Combinations of dif-ferent practices on the same farm can then be observed: farmers with a building located over a fish-farming pond (n=8) can choose to scrape only some of the stalls to obtain the organic fertilizers necessary for crops; the remaining stalls are then cleaned out with water and the liquid slurry falls into the pond. Farms with excess slurry only store what they need and are unconcerned by any surplus produced; excess excreta is carried away with cleaning water. Farmers with a medium-sized to large pig farm and owning a methane digester, adopt several strategies: either they scrape all solids and only leave the liquids to run into the pit of the digester; or they scrape what they are sure of being able to store and use on crops or in a pond (depending on the season, storage and processing capacities), the remaining liquid slurry is di-rected into the pit of the digester; or they no longer separate the solid and liquid forms and all the excreta and cleaning water go into the digester.
Scraping, costly in terms of labour, also remains a more unpleasant operation than simply cleaning with water. Despite this, the manual transport and spreading of organic products on the crops make this practice essential. The enlargement of the farm is often accom-panied by a lesser separation of liquid and solid efflu-ents. This trend increases with the installation of biogas, strongly encouraged by the local authorities.
Storage of pig effluents
The storage of livestock effluents is one of the major con-straints of farmers questioned. The small area of land for dwelling leaves little or no space for storage. These efflu-ents are a source of nuisance both for the family house-hold and for the neighbourhood, particularly when the dwelling is located in the village (80% of farms surveyed). Storage structures observed on the farms are varied. They share a low capacity of 1 to 5 m3maximum.
i) Storage of manure and scraped slurry
Manure is stored covered over in the traditional stall. Farmers having developed their production (sows > 2 and pigs/batch > 20) and owning a traditional stall use it to store scraped slurry from the building equipped for production. Such manure has little plant matter in it. When the farm becomes too large, some farmers con-vert their traditional stall into a pit for scraped slurry only. They stop raising sows or move them into modern stalls. Other systems exist: a small stall is converted into a storage structure; one or several small concrete pits are constructed outside the building, slurry being car-ried by the bucket-load to these pits; or the building may be equipped with a storage structure.
ii) Storage of liquid slurry
The first possibility is that liquid slurry is not stored at all and falls directly into a pond. Often a pit is con-structed just outside the building, collecting all slurry; nevertheless, overflow from such pits is observed in the wet season or after an enlargement of the farm without consequent pit enlargement. Finally, liquid slurry can be entirely processed in the pit of the biogas digester.
iii) Storage of liquid waste
In general, liquid waste in not stored and runs away directly from the building into a river, a communal canal, a fish-farming pond or a garden. Sometimes, a small storage structure is placed just outside the building; liquid effluent is then collected and reused. These structures are only observed when there is a possibility of putting the liquid to use near the farm building: kitchen garden, dry crops, or orchard. Liquid waste is occasionally directed into a buried pit behind the building. Depending on the size of the farm, pits,
the use and destination of produce, as well as fre-quency of emptying vary. Small-scale farmers empty their pit twice a year for muckspreading on their crops, whether they are full or not. Pigs-fish farmers who feed their fish with scraped slurry empty their pit daily. Given the heterogeneity of structures, it is diffi-cult to detect a trend among farmers who have deve-loped pig farming (> 20 pigs/batch). Some are forced to empty their pit every 10 days while others can wait 3 months. Retrieval is manual and is done by the bucket-load. One farm (Farm 35), with a lot of live-stock and a large pond, empties its pit once every three months with an electric pump.
A major element in water and environmental pollu-tion, management of liquid effluents is not mastered on farms with a large pig stock. Overflowing pits, a lack of storage of liquid livestock waste, or contami-nation of neighbouring fish-farming ponds can all be observed.
Processing of untreated produce
i) Production of “compost”
Scraped or liquid slurry is not used untreated on crops. They undergo a treatment known as composting. Here, the term “compost” signifies a mixture of scraped slurry, dry or green plant waste (dry floating plants, rice husks, maize leaves, rice straw, etc.), ashes from rice straw (kitchen waste) and lime. Its composi-tion varies and depends, among other things, on the proportion of pig excreta. Farmers with few pigs com-pensate for the lack of animal excreta with plenty of extra plant matter. Farmers who have developed their pig production are forced to empty their pits more fre-quently. They make their compost in a specialized structure (pit or converted building), or on their farm-land. The mixture is prepared one to three months before muckspreading and then covered with a thin layer of mud, a nylon cover or jute matting. The higher the proportion of excreta, the less the product has to decompose. Only two farmers stated that they turned their compost regularly in order to obtain a better decomposition. This makes it lighter and therefore easier to spread and of better quality.
ii) Production of biogas
Out of 43 farms surveyed, 14 were equipped with a Chinese-type methanizer for making biogas. The advantage of methanization is that it considerably reduces the sanitary problems linked to livestock efflu-ents. The gas produced is never used for the produc-tion of electricity, but for family cooking, heating water, cooking mash for the pigs and making rice alcohol. It also enables farmers to solve the problem of storage on the land used for dwelling. Out of these 14 farms, 2
have average to low production. They present the par-ticularity of having coupled the treatment of pig excre-ment with that of human excreexcre-ment. The capacities of the digesters are 7 and 10 m3. These farms are not
spe-cialized in pig farming. Their owners are traders for whom livestock farming remains a small proportion of their income. Methanization enables them to have access to gas and to abandon the unpleasant use of coal. Savings on coal are however more or less signi-ficant depending on the efficiency of the system.
Box 2: Products that do not come from pig farming
In addition to pig effluents, there are often several other forms of animal waste, each with their own specificity in terms of management and use by farmers on crops or in ponds.
Effluents from poultry farming – Poultry kept in buildings are raised on a concrete floor covered with a litter consisting of rice husks. The building is cleaned every two or three days. All the farms surveyed with poultry kept buildings store poultry excreta in bags. When the poultry are only raised in a family courtyard with less than 30 birds per batch, it is not uncommon for the hencoop to be built over the pig stalls. Droppings are then collected with slurry or manure.
Effluents from cattle and water buffalo farms – A single farm in our sample had a bullock. It is housed in a shed with a concrete floor at night and grazes during the day. The excreta are scraped up and mixed with pig exc-reta in the pit of the traditional stall.
Human excreta – On small, little-modernized farms, the sanitary facilities are often located next to the livestock stalls. In one case, the pit of the traditional stall is the same as that for the toilets. Human excreta, both liquid and solid, usually fall into a pit filled with ashes. The use of human excreta being considered as taboo, few farmers dared to broach the subject.
Box 3: the consequences of biogas - examples
The case of two farms (29 and 32) is particularly interesting. Before the installation of biogas, the farmers cleaned their buildings by scraping. Some of the scraped slurry was composted; the rest was stored tem-porarily then sold. The liquids fed a small water hole in which grew many water hyacinths collected by those living in the neighbourhood. Since the installation of biogas, all excreta are processed in the digester and the residual liquids are drained off the farms. The two farmers today claim they lack farm fertilizer as they cannot manually carry and spread the liquid substratum. One (29) is considering abandoning the organic manuring of its land. The other (32), growing several high added value crops far from his dwelling, is wondering about the possibility of putting residual liquids to work. He buys slurry while waiting to develop somewhere to collect and impregnate these liquids. Four farmers have decided to stop organic fertilization after installation of the digester. The portion of their income derived from crops was small (development of pig farming and other acti-vities) and they do not fear lower yields linked to stopping organic fertilization. They compensate by increasing the dos-age of mineral fertilization and leaving plant residues on the fields that are no longer used as material for making fires but are burned where they are.
The 12 other farms have concentrated on pig produc-tion. The capacities of digesters are all between 10 and 17 m3. The installation of a digester modifies effluent management habits considerably. Farmers partially or even totally abandon the separation of liquid and solid forms in order to fill the digester with diluted slurry. The watery residue rich in nitrogen drained off at the end of the process poses the same management problems as liquid waste. The difficulties are compounded by the large volume of water necessary for the recommended cleaning to ensure correct operation of the digester.
Destination of livestock effluents
The use of effluents as fertilizers on crops, as well as in farm ponds, are described in the preceding chap-ters. In cases of surplus or lack of labour, waste is transferred to neighbours or exchanged with other farmers. Farmers concentrating on pig production resort to giving away or selling excreta. All the big farms that have not installed biogas sell or give away their scraped slurry. These are often transfers between friends, neighbours or members of the same family. The products exchanged are scraped slurry, and sometimes compost. Demand is concentrated in three periods of the year: January-February and May-June for rice, September-October for dry crops.
There are also transfers of effluents that are not tran-sactions. When the pig shed of a farm is located near the pond of a nearby farm, it is not uncommon for water from cleaning, even liquid slurry to be volunta-rily poured into the pond. It is a mutually beneficial interaction: one farmer frees himself of storage prob-lems while the other reduces the feed costs for his fish-farming pond.
Box 4: examples of exchanges between crop and livestock farmers
The livestock effluent management strategy of farm n°14, with 3 sows and 200 pigs being pre-fattened a year, relies on sales and gifts: a fish farmer comes every fortnight to empty the slurry pit in exchange for 50,000 VND (eq. €2.5); liquid waste flows into the neighbouring pond. Having only a limited labour force, the farmer is very pleased not to have to empty her pits. She no longer fertilizes her crops and sells everything.
Others have dug pits at the roadside or outside buildings so that scraped slurry is accessible for neighbours (2 cases). One farmer in Vu Thu district has noticed that the sale of farm fertilizer in his commune is becoming more and more difficult because of the installation of several farmers in the neighbourhood (stronger competi-tion). He wonders about the future because he doesn’t know where to store his excreta if nobody comes to buy them from him.
Identification and quantification
of environmental risks
Destination of effluents discharged into the
environment
Observations in the field show direct discharge of efflu-ents into the environment, from several sources: escape of liquid waste from a building without a sto-rage structure; the pouring of biogas wastewater into a pond, a watercourse or a garden; the overflow of storage pits of insufficient size and unprotected from extreme weather; excess liquid slurry poured into ponds; the frequent replenishment of wastewater from fish-farming ponds. It should be pointed out here that only water and soil pollution have been taken into account. Air pollution phenomena through volatiliza-tion have not been addressed due to lack of local re-ferences.
Environmental risks have henceforth been modulated depending on the destination of by-products. Incomplete knowledge and complexity of the field make it difficult to establish a true hierarchy of envi-ronmental risks. Considering water contamination as the biggest risk, we have defined a “destination coef-ficient” as follows:
- discharges into watercourses pose the greatest risk; they will be given a coefficient of 1,
- ponds are considered as intermediate purifying
structures between the pigsty and the water-course; discharges will be given a coefficient of
0.75,
- discharges into the ground will be given a
coeffi-cient of 0.5.
These destination coefficients are only representative of a simplified reality. They have been given to the va-rious farms surveyed, on the basis of field observations and hypotheses concern-ing the environmental impact of their discharges into water and the ground. In addition, the complexity of the hydraulic network makes it impossible to know what the exact destina-tions of watercourses are: some waters can be used for irrigation of paddy fields, while others flow directly into a river. The risk is then no longer comparable.
i) Directs discharges into water: pollution of bodies of water
Bodies of water can be fish-farming ponds or water-courses. By “watercourses” we mean rivers, canals and communal channels, these latter carrying water to canals then on to rivers. Ponds attached to a pigsty are concerned by this kind of pollution. Excessive pig exc-reta levels lead to eutrophication of this environment. One of the first visible signs of pollution is asphyxia of the fish. Then, if the water is not renewed and the levels of organic products are maintained, the eutrophication continues: the water becomes cloudy and foul-smelling. Growth of floating plants and fish farming become impossible. The environmental impact leads to economic losses linked to the halt in farming acti-vities in the pond. Some farmers favour diversification of forms of production by limiting the number of pigs in a building (n=2). Others, with higher pig production capacity, sacrifice their fish production (n=2). Their ponds, thus converted into sewage lagoon, remain the source of leaching of mineral elements, polluting the ground vertically or neighbouring ponds laterally. These pools are often prone to overflow in the wet season leading to contamination of watercourses. Pollution of watercourses is very common, particularly in villages. Unused liquid effluents escape from the backs of buildings into channels, rivers and canals.
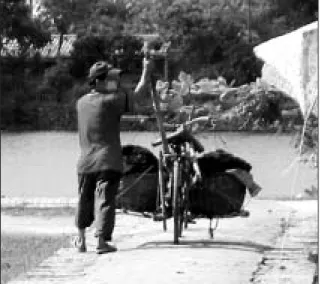
ii) Direct discharges into the ground: soil pollution
Mud forms behind a building when effluents are left to flow directly onto the ground. In addition to an envi-ronmental risk from leaching and run-off of polluting mineral elements, bad smell nuisances and sanitary risks can then develop. These forms of pollution are all the more worrying when they are located in the middle of villages. However, through lack of local references on the nitrogen needs of crops and the availability of organic nitrogen in farm fertilizer, soil pollutions linked to excessive muckspreading has not been addressed. Muckspreading being a particularly unpleasant activity (transport of heavy loads by bicycle, poor quality of the road system, manual muckspreading, distance between fields), we can suppose that the quantities spread are rarely excessive. Risks can however result from excessive mineral fertilization.
Estimate of nitrogen losses through direct discharge The impact of discharge of effluents into the environ-ment is proportional to the quantity of polluting ele-ments discharged into the water. Because of its high mobility, its reactivity to its environment, its transfor-mations with the various forms, only nitrogen has been taken into account here to describe the pollution observed. In addition, the fertilizing properties of this element make a necessity of its recycling to crops and ponds for the agricultural systems surveyed.
i) Quantity of animals on the farm
Given the complexity of livestock systems linked in particular to the time during which animals are raised varying from farm to farm and from season to season, the indicator that we have chosen to represent the quantity of animal stock is the live weight sold yearly (LW). As this indicator doesn’t include farrowing ope-rations, the sows have been converted into their equi-valent in pigs fattened for meat, also expressed in terms of live weight sold yearly (LWPFM). This equiva-lent value is obtained from an estimate of the excreta produced per year per sow following the hypotheses shown in Part II: a local sow represents 480 kg LWPFM
or 8 pigs raised until they weigh 60 kg in one year; an exotic breed sow represents 780 kg LWPFM or 13 pigs raised until they weigh 60 kg in one year.
This system of equivalences can be criticized for mixing up different livestock logics and systems: sow breeders (farrowers), farrow-to-finish farmers and fat-teners. We have already seen that the livestock raising strategy depends more on the fattening time than on the number of sows. However, our aim being the study of organic matter management and associated envi-ronmental risks, we may content ourselves with this equivalence.
ii) Calculation of nitrogen discharges
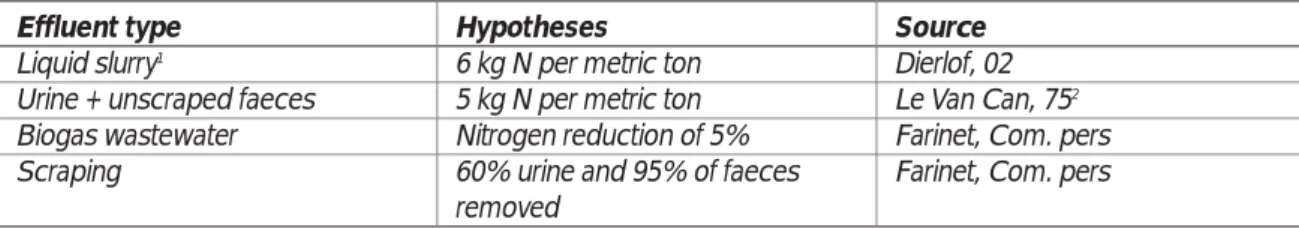
From the observation of evacuation practices and hypotheses shown in Table 2, we have esti-mated nitrogen discharges due to direct discharge from the building (PER variable). The products concerned are the mixture of urine and unscraped faeces, liquid slurry and biogas wastewater. We have then weighted the nitrogen discharges of the destination coefficient defined in the preceding paragraph. This gives us the variable POLL defined by:
Box 5: Pollution observed on the farms surveyed
The various forms of pollution have been listed and then shown farm by farm. To achieve this, the following choices have been made:
- An agreement between neighbours allowing effluents (liquid livestock waste, liquid slurry, biogas residual liquid waste) from one farm to run into the pond or kitchen garden of another is considered as making use of it (29, 13). We consider that a neighbour authorizing these practices is making use of by-products. The fact of not having met the neighbours limits the survey, because while the farmer questioned claims that his neighbour agrees, it is not always the case.
- Letting effluents run into a waterhole where floating plants grow that are picked to feed pigs or for making compost is a way of making use of them (41).
- Direct discharge into a pond is polluting when signs of pollution have been observed or commented on by the farmer: cloudiness of the water, development of algae, abnormal behaviour of fish (breathing at the surface) or reduced yields.
Direct discharge has been noted on 25 farms, or 58% of farmers questioned. As a general rule, it is mostly large-scale farms that are responsible for direct discharge:
- for 14 farms, discharge takes place into watercourses behind the farm; - for 6 farms, it takes place in ponds set aside for fish farming;
- for 5 of them, discharge causes mud to form on land where the dwelling is located.
In addition, on the basis of interviews that have made it possible to specify the issues as perceived by the stake-holders, the 22 “qualities” that they wish to see improved have been defined for the system studied (Table 2). For
example therefore, the issue “quality of life” has been broken into several qualities: the “cleanliness of villages” (Clean_vil), “surface water cleanliness” (Clean_wat), “air quality” i.e. the reduction of olfactory nuisances (Air).
Table 2: Hypotheses made for the calculation of nitrogen discharges Effluent type
Liquid slurry1
Urine + unscraped faeces Biogas wastewater Scraping
Hypotheses
6 kg N per metric ton 5 kg N per metric ton Nitrogen reduction of 5% 60% urine and 95% of faeces removed
Source
Dierlof, 02 Le Van Can, 752
Farinet, Com. pers Farinet, Com. pers
1 Consisting of 54% faeces and 46% urine (Muller, 1993) 2 Analysis of urine, the proportion of faeces in the mixture is
Figure 9: Weighted nitrogen discharges of the effluents destination coefficient (POLL)
All the farms with a POLL variable higher than 100 kg of nitrogen per year are equipped with a biogas digester, except for farm n°16, a large one that has dif-ficulty finding a use for its wastewa-ter (Figure 9). Given the lack of available references on Vietnamese live-stock effluents, we have used bibliographical refe-rences here for which experimental conditions were not known. The true volumes of effluents being unknown and in all likelihood very variable between farms and over time, the presence of cleaning water has not been taken into account in the calculation of nitro-gen discharges. For our calculations, we have used the discharges of fresh matter produced by the animals, then the nitrogen from the estimated con-centrations in the excreta. The volatilization of ammo-nia in the building and during storage being unknown in our context, it has not been integrated into the cal-culations, which leads to overestimates of the nitrogen discharges into the water and the soil. Despite these limits, the calculation linked to direct discharges remains inter-esting for comparing farms with other farms; it also makes it possible to assess the scale of ni-trogen pollution risks linked to livestock effluents.
Relationship between production of effluents and potential use
i) Excess effluent production index
In order to quantitatively assess the excess in pig efflu-ents produced on a farm, an index off theoretical excess effluent production has been created. This index corresponds to the following ratio:
The first step therefore consists of calculating the total production of pig effluents; the next step is an estimate of the farm fertilizer needs of crops and
ponds. The theoretical needs for fresh matter corre-spond to the farmer’s needs for farm fertilizer from pigs for his pond plants, his crops and to feed his fish. This index does not take into account practices spe-cific to the farmer or the possible additional presence of cattle/water buffalo or poultry farming. Pig efflu-ents are considered as used to their maximum poten-tial on crops and in ponds.
For crops, local recommendations for organic fertiliza-tion are used. The main obstacle to under-standing them are the terms used: the dosages to be applied are for “phân chuông”, a term that sometimes signifies scraped slurry, sometimes the composted mixture of this slurry with plant residues. In the survey by Le Van Can (1975) (7), the term “phân chuông” was translated as compost. The nature of composted mixtures varies with the length of composting and depend-ing on the kind of products used (see Chapter 7). By default, it will be considered that the loss in weight that accompa-nies composting is identical for all mixtures and totals 50% of the mixture’s initial weight (7). It will be consid-ered that this mixture is made up of 70% liquid slurry and 30% plant residues. This corresponds to practices observed in the field. The losses in weight that may take place during storage of solid effluents are not taken into account, as often the two operations cannot be distinguished separately.
The estimate of needs in local units (kg of fresh matter per sao, one sao equalling 360 m2) and in metric tons
per hectare uses the data shown in Chapter 8. We have used the following ratio: two 50 kg pigs being fattened per day for a pond of one sao3. This ratio enables
cal-culation of needs in fresh matter for a pond of one sao for one year, namely 1.825 metric tons/year.
ii) Area farmed
The total area farmed is the total flattened area (TAF variable). The number of crop cycles on the land con-ditions the frequency and the quantity of organic matter added: fields planted with rice (RI variable) are doubled as paddy fields systematically receive two cycles; fields planted with dry crops (DC variable) are multiplied by the number of cycles observed (one to three cycles on the same field); pond area (PO variable) is counted as one crop with one cycle.
3 This reference is associated with an extensive polyculture of herbivorous carp, with yields from 2 to 4 metric tons per hectare (higher yields being obtained in the VAC system), and a stock density of 1-2 pigs per m2
EEPI = FPEMP / Needs for FPEM (Equation 2)
With: EEPI Excess effluent production index FPEMP Fresh pig effluent matter produced (in metric tons)
Needs for FPEM, fresh pig effluent matter (in metric tons)
Figure 10: Distribution of farming area by farm and excess effluent production index
Box 6: An excess effluent production index and contrasted situations
Among the big farms, excess effluents from pigs can be as high as factor 17 (farm n°29); however, this farm does not pollute because it exports most of its effluents. Restrictions on space are such that, on some farms, needs in organic matter from pigs are met with as little as de 2.8 metric tons LWPFM or 1 local sow and about twenty pigs fattened for meat up to 100 kg (farm n°22).
Small farms have an excess effluent production coefficient of less than 1. Most of the farms in the province fall into this category. While exclusive poultry farmers and owners of cattle and water buffalo are also included into this category, and do not show a shortfall in farm fertilizer, it can be supposed that they are a minority. There is therefore a significant deficit in farm fertilizer on these farms. Surveys have shown that they all need to buy farm fertilizer.
Pig farm classification according to pig
waste management
Focus on four types of farmers
The farms surveyed have been grouped together by
combining a multivariate statistical analysis (principal components analysis) carried out with quantitative parameters (Table 3) and a qualitative approach based on the analysis of the overall operation of farms, i.e. ori-entation of the production system, goals, constraints and advantages.
The step-by-step statistical analysis leads to the defi-nition of three keys for farm classification: (1) the size of the pig farm, which plays a major part in terms of pollution; (2) the area farmed given by the excess
efflu-ent production index and the total area; and (3) the presence of a pond making it possible to discriminate some farms. The first key categorizes farms into four general types (Figure 11):
(*) Areas of pond and dry crops considered individually show evidence of diversification of production on the farm; (**) QPU = QPRO - LO
Type I – large-scale modern farms: annual tonnage is more than 15 metric tons LWPFM; type I' is an
exten-sion of type I;
Type II – specialized farms with a medium-sized livestock operation relative to the area: annual tonnage is
between six and 15 metric tons LWPFM;
Type III – small farms in the process of development: annual tonnage produced is between one and five
metric tons LWPFM;
Type IV – “subsistence” farms: less than one metric ton LWPFM.
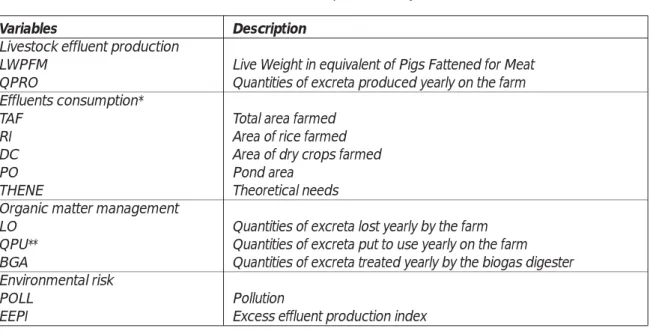
Table 3: The variables taken into account in the main components analyses (MCA) Variables
Livestock effluent production
LWPFM QPRO Effluents consumption* TAF RI DC PO THENE
Organic matter management
LO QPU** BGA Environmental risk POLL EEPI Description
Live Weight in equivalent of Pigs Fattened for Meat Quantities of excreta produced yearly on the farm Total area farmed
Area of rice farmed Area of dry crops farmed Pond area
Theoretical needs
Quantities of excreta lost yearly by the farm Quantities of excreta put to use yearly on the farm Quantities of excreta treated yearly by the biogas digester Pollution
Livestock farms are primarily defined by their pig pro-duction, given the major part played by stock levels on environmental risk. The area of water farmed for fish is the second factor: it leads to waste management spe-cific to the feeding and fertilization of ponds. Finally, the area farmed is the third factor for differentiation of live-stock farms. The presence of dry crops multiplies the crop cycles and generates increased farm fertilizer
needs. Present in the analyses thanks to the POLL and EEPI variables, environmental risk has been catego-rized: type I farms pose overall more risk than type II and type III farms, which pose little or no risk. The envi-ronmental risk is therefore arranged hierarchically by the POLL variable (Table 4) as a supplement to the types and sub-types categorization tree, drawn up according to the distribution keys (Figure 11).
Table 4: Hierarchical arrangement of environmental risk Qualities
POLL variable
High risk
POLL>250 kg nitro-gen per year
Medium risk
100<POLL<250 kg nitrogen per year
Low risk
0 kg<POLL<100 kg nitrogen per year
No risk
POLL=0 kg nitro-gen per year
i) Type I - modern large-scale pig farms
Type I farms use exotic breed pigs, and are of a highly technical nature; their production is regular and is based on industrial feed; the herd contains between 10 to 20 exotic sows, and batches of between 50 to 100 pigs fat-tened for meat. The buildings are recent; these farmers have made significant investments in modern infra-structure and have adopted blocked stalls with open metal flooring in maternity sections. They are part of the long commercial commodity chain supplying the regions of Hanoi and Haiphong; usually, they have signed sales contracts with export companies to ease the regular distribution and sale of their produce. These producers put themselves into their farms and in addi-tion employ a permanent and/or temporary workforce during peaks of activity (rice harvest, catching fish). In the medium and long term, they seek to develop other activities, as well as continuing to expand their produc-tion system and to hand on the farm to their children. However they lack space to increase the size of their pig herd. For some high-risk farms in this group, biogas wastewater constantly escaping and cleaning water and other liquid waste not being put to use pose the most acute problems in terms of waste manage-ment. The sub-type IA is defined by an intensive integrated production of pigs-fish or pigs-fish-poultry; the areas farmed are large with ponds in the VAC system. They are industrial “farm”-type structures with buildings located on agricultural land, outside villages. This category of producer wishes to cease growing rice and develop their integrated livestock operation. Their excess effluent production index is between 1.7 < IS < 2.5; the use of biogas and the pouring of liquid slurry into the pond are their main methods of ma-naging their livestock waste. They nevertheless pose a medium to low risk in terms of pollution with waste-water put to use in ponds; however the control of excreta flow into ponds to feed the fish constitutes their main constraint.
Sub-type IB has diversified crops with a high excess effluent production index between 4 and 6. Lacking sufficient fish-farming ponds, the risk for the environ-ment is high to medium.
The farmer of sub-type IC raises only pigs, with a small area of land where he grows only rice; these farms have an excess effluent production index between 8 and 20 and, consequently, a very high risk of pollution. However, when the biogas digester wastewater is put to use off the farm (in a pond of a neighbouring farm for example), these farms pose no risk.
Sub-types IB and IC seek to convert their paddy fields into ponds if the plots of land are close to each other, to abandon growing rice and specialize in pig produc-tion. Their prevailing waste management strategy is to turn to biogas, abandoning the practice of scraping that separates the liquid and solid effluents; this leads to an increase in risk of nitrogen pollution. However, when the farmer continues to put organic manure on his fields, the necessary scraping of excreta reduces nitrogen discharges. Another solution for these farms is to continue scraping and to give or sell farm fertilizer. The excess liquid effluents that are difficult to manage in most cases pose a major constraint: excessive vo-lumes of effluents, inexistent or insufficient storage structures, too small dwelling areas, fields too distant. Type I' (Figure 9) is an extension of type I. It is a large farm with 60 exotic sows. Its infrastructure is not com-parable with that of type I farms. However, the current waste management procedures are identical to those of type I, and accordingly, type I' which is often pro-moted by the authorities, poses a very high risk to the environment. The development of this type of farm structure must be accompanied by the installation of efficient facilities for treatment or recycling of nitrogen and phosphorous from effluents off the farm: filtration, centrifugation, composting if it is possible to recover carbon-bearing matter (rice stalks, etc).
ii) Type II – specialized pig farmers in the process of
modernizing
Production of this type II can be described as cross-bred pigs (exotic x local), with from 0 to 5 local sows, and batches of 20 to 50 pigs fattened for meat. Animal feed is rice-based, with rice husks, maize and com-plemented with industrial concentrates. These farms also kept poultry before the avian influenza outbreak. Construction is recent with from 5 to 10 concrete stalls; several recently renovated buildings can also be observed. The workforce is mainly family but also calls on temporary outside help at harvest time. These farmers supply both a long commodity chain stret-ching to Hanoi and a short one to Thai Binh. These farmers wish to modernize their structure to enable them to raise exotic pigs; they also seek to produce rice alcohol and to make use of residues in the pig feed. Their main problems are the lack of available space and the large variations in market prices. Sub-type IIA practices pigs–fish integration, with an excess effluent production index between 2 and 4. The strategy of excreta management is based on pou-ring the liquid slurry into the pond and the scraping of
solids. Farms of this type can pose low or no pollution risk when the effluents are poured into the pond with-out spillage into public waterways. Too small a pond leading to eutrophication problems represents the major risk.
Sub-type IIB favours diversified polyculture; the excess effluent production index is between 2 and 3. Limited space on the land for dwelling, lack of workforce and limited demand/consumption of effluents are the con-straints identified by these farmers.
Sub-type IIC farms only pigs, with an excess effluent production index between 3 and 12. How-ever, having a smaller herd that type IC, some IIC farms pose low or no pollution risk if liquids are put to good use in the garden and excess solids given away or sold. Types IIB and IIC practise the scraping of solids associated with composting and with the gift or sale of any excess; they often favour treatment by methanization or make use of liquids on high added value crops; they have stiff constraints however, particularly because they do not make good use of liquids and biogas wastewater. The development trajectory of IIC farmers is aimed at specializing in pig farming (IC) with increased risk of nitrogen pollution, while that of types IIA and IIB is aimed at diversification of farm activities, with the pos-sibility of reducing the current risk by putting the solids to better use (IIB) through export and the liquids (IIA) in the fish-farming pond.
iii) Type III – small-scale and non-specialized pig
farmers
Type III can be described as having a herd of 15 pigs per batch with 1 to 2 sows, of mixed breed. Feed for animals being fattened is made from rice, rice husks, floating plants and is complemented with industrial concentrates; the sows are fed in the traditional way, often with household waste and fibrous produce. Farmers here are part of the local trading circuit, and sometimes find markets within the short commodity chain in Thai Binh province. Some buildings are re-cent and often have less than 5 stalls; usually, they could do with being renovated or are limited to a traditional stall. The workforce is drawn exclusively from the family. Raising pigs is often a secondary activity, in parallel
with making noodles, weaving mats, distilling rice alco-hol, or growing a large amount of crops. They wish to maintain or possibly develop their pig farming activity depending on opportunities in the short-term market. They also suffer from lack of space as well as large vari-ations in market prices.
Sub-type IIIA aims to specialize in fish farming; ponds are from 3 to 20 sao in size, with a low excess effluent production index between 0 and 1, supposing there is no problem of surplus waste to be managed. Sub-type IIIB favours diversification, also with a low excess efflu-ent production index, less than 1. Small producers of sub-type IIIC however raise only pigs, grow only rice on their land, and have a medium excess effluent pro-duction index between 1 and 2. They seek to develop pig production (trajectory towards IIC), while sub-types IIIA and IIIB wish to maintain diversification of activities on the farm.
The prevailing strategy of type IIIA with relation to waste management favours letting liquid slurry run into ponds, transporting scraped slurry to the ponds, and buying farm fertilizer, showing the real shortage of organic matter for some crops or ponds. The systematic use of effluents in the pond thus enables these farms to be deemed as non-polluting. Sub-types IIIB and IIIC opt for a management entailing scraping of solids and com-posting with both the liquids and human excrement being put to use. The essential points in order to pose low or no risk are putting the liquids to use in the garden, but also giving or selling off the excess solids. Their constraints are the lack of workforce and space on the land for dwelling, as well as an overall deficit in farm fertilizer.
iv) Type IV – very small-scale pig farmers
Finally, type IV represents the vast majority of pig farm-ers in the province. They are very small farms with extremely limited means. They raise one to three pigs a year, sometimes a sow when they have managed to save enough money. The pigs and piglets are sold to village fatteners or at the local market. Effluents are put to use in their totality on these farms that are often equipped with a traditional stall. These farmers lack farm fertilizer for manuring their land, garden or family water hole.
Possible evolution of farms and related
changes in animal waste management
After classification of existing farms, changes of type have been considered according to the strategies announced by the farmers questioned. An easy evo-lution of type III farmers into type II can be envisaged. The transition appears more difficult from type II to type I, given the high level of investment and technical know-how required to raise exotic animals. Type IV farmers, who are in a large majority, have restricted potential for evolution: their lack of means and/or their non-specialization do not encourage them to increase their livestock.
State help for the conversion of low-yield paddy fields into ponds will probably lead to a development of type IA farms where pigs-fish integration appears essential. From the environmental point of view, the pollution risk will diminish if the farmer opts for a fish feed based on effluents. Putting this waste to use will be accompa-nied by a trend to move livestock operations outside inhabited areas.
The installation of biogas digesters, encouraged by the local authorities, increases the environmental risk on type I and type II farms. Less separation of liquid and solid waste, or even the abandonment of this practice, very significantly increases environmental risk. A parallel development of the poultry sector would lead to strong competition of the poultry droppings com-modity chain against that of pig slurry. A fresh increase in this production will only occur when the avian influenza epidemic is over or at the very least under control; in 2005, the Vietnamese Government adopted some strict measures to limit poultry, so it appears that
this scenario is unlikely in the short and medium term.
Factors associated with environmental risk
The parallel analysis of the overall operation of farms and of environmental risks has made it possible to expose the determining polluting factors linked to the constraints of farm structure and management.
i) Structural constraints
The Vietnamese land system imposes a strong con-straint on area limiting the possibility of putting efflu-ents to use. The size of the farm varying very little, the constraint increases with the quantity of animals farmed. It is a determining risk factor in farm types I', I and II C. The living area has not been taken into account while drawing up this typology. On areas between 180 m2 and 500 m2, the possibilities for accommodating effluent storage and treatment struc-tures are limited. Enlarging the pigsty (transition from type III to II) without having other areas on the farm that can potentially consume liquid effluents (kitchen garden, orchard, pond) increases the environmental risk. Type I farms and totally integrated pigs-fish sys-tems are less prone to this dwelling space constraint. Although the excess effluent production index is an indicator of environmental risk, it should be observed that it does not provide the complete picture. Other structural constraints became apparent during the analysis of livestock waste management practices: - insufficient size of effluent storage structures often
observed when a livestock farm is enlarged (tran-sition from type IV to III, III to II) ;
- lack of workforce on type II and III farms that limits muckspreading in the fields;
- lack of a garden or pond near the farm that prevent the use of liquids;
Box 7: A typology, special cases
Some farms of types I and II also pose low or no risk. This can be explained by specific management sys-tems: the biogas wastewater from farm 29 is carried by a channel about a hundred metres long to a pond of over 10 sao belonging to the neighbour; farm 7 has a large pond enabling it to use all of the wastewater from its biogas digester; the strategy of farms 14, 17 and 42 is based on a total transfer of effluents: liquid waste runs into the neighbouring pond and all solids are sold by contract to fish farmers in the village. Conversely, farm 32 poses a high risk although it belongs to type II. Following the installation of a digester, the farmer has completely changed his management methods. He has abandoned the separation of solid and liquid effluents, with the liquids being used and the solids being sold, in favour of filling his digester. The quantity of wastewater having become too great, he has abandoned the use of liquids, which he discharges into a communal canal.
- distance from fields, linked to difficult access and unmotorized transport;
- distance from crops with high added value that reduces the use of liquid effluents;
- presence of poultry production on the farm that reduces the use of pig waste.
The presence of a digester also appears to be a deter-mining factor in terms of environmental risk linked to nitrogen discharges. The production of biogas pres-ents considerable advantages: reduction of the chem-ical oxygen demand4(DCO), reduction of sanitary risks,
production of gas for cooking or preparation of feed for animals, reduction of workforce for cleaning buildings. These installations have been developed for the most part on big farms (mostly type I), which is why it was possible to establish a link between biogas and envi-ronmental risk, though obviously not a relation of cause and effect. In fact, this system does increase environ-mental risk because it tends to reduce the traditional practice of scraping that separates liquid from solid waste. Nev-ertheless, there are examples where, when space permits, the biogas wastewater is very well used. Some biogas-pond combinations work well (n=1), but this involves a minority of cases.
ii) Constraints on management
The choice of effluent evacuation methods with total, partial or inexistent separation of liquids and solids to a large part determines environmental risk. With the lowest degree of separation when a farm is enlarged, a growing environmental risk can be expected, relative to the development strategies observed of type III farms into type II.
In addition, when the livestock farm gets bigger, the farmer is inclined to favour pig production. Through lack of workforce, the organic fertilization of fields may be stopped. In other cases, fish production is sacri-ficed and a pond is converted into a sewage lagoon.
Problems of leaching then lead to contamination of neighbouring ponds. While a large-scale farm (type I) can afford to divest itself of its fish farming activity, what about smaller neighbouring farms? Over and above the environmental risk, the imbalance in the system or the impact on neighbouring sys-tems can lead to an economic risk.
Transfers of solid effluents between farms are a deter-mining factor: they considerably reduce environmen-tal risk and enable the farmer to free himself of storage constraints. Local constraints limit the distances for transfers. Difficulties are observed in sale and/or gift in areas where the competition is strong (intensive poul-try farming, proliferation of pig farms). The transfer of liquid effluents is only possible when two farmers co-operate to create an integrated pigs-fish system. Finally, while on an individual level, type II and III farms only pose a medium to low risk, their proximity in inhabited areas leads to a higher accumulated risk. Unchecked development of type II and III pig farms in villages could have significant consequences in terms of environmental risk given the high population density of these areas.
Discussion and conclusion
Existing practices of effluent management on pig farms are very diverse. Conditioned by the kind of buildings and their location, evacuation practices (separation of liquids and solids), and treatment lead to the creation of six different products: scraped excre-ment, liquid slurry, liquid waste, manure, compost, and biodigester wastewater. Optimum usage of solid pro-ducts has been observed: scraped excrement and manure. They are spread onto crops, usually in the form of “compost”, distributed to ponds, sold or given away. On the other hand, liquid products that are hea-vier and difficult to store are rarely used. While there is a real tradition of using solid products on field crops, this is not the case for liquid products. These are reserved for gardens, nearer to the livestock, and, in some cases, to crops with a high added value. Except for liquid slurry, liquid products are discharged directly into watercourses, ponds or spread in the form of mud onto gardens. The size of the farm directly conditions the volume of liquid discharge, because the production of solid waste remains almost constant and suited to crop-growing land.
The following ideas should therefore be considered: (1) a system enabling the reduction of the quantity of nitrogen entering the biodigester, as a substitute to the practice of scraping, progres-sively abandoned by large-scale farmers owing to lack of work-force, (2) a system for collecting, transporting and using waste-water, which is currently being discharged into the environment.