S-1
Supporting Information
A Versatile Molecular Silver Ink Platform for Printed Flexible Electronics
Arnold J. Kell, 1* Chantal Paquet,1 Olga Mozenson,1 Iden Djavani-Tabrizi,1 Bhavana Deore,1 Xiangyang Liu,1 Gregory P. Lopinski,2 Robert James,3 Khelifa Hettak,3 Jafar Shaker,3 Adrian Momciu,3 Julie Ferrigno,4 Olivier Ferrand,4 Jian Xiong Hu,4 and Sylvie Lafrenière,4* Patrick R. L. Malenfant1*
Dr. Arnold J. Kell1, Dr. Chantal Paquet1, Ms. Olga Mozenson1, Mr. Iden Djavani-Tabrizi 1, Dr. Bhavana Deore1, Dr. Xiangyang Liu1, Dr. Patrick R. L. Malenfant1
Security and Disruptive Technologies Portfolio National Research Council Canada
100 Sussex Drive
Ottawa, Ontario, K1A 0R6, Canada
E-mail:[email protected], [email protected]
Dr. Gregory P. Lopinski2
Measurement Science and Standards Portfolio National Research Council Canada
100 Sussex Drive
Ottawa, Ontario, K1A 0R6, Canada
Robert James3, Khelifa Hettak3, Jafar Shaker3, Adrian Momciu3 Communications Research Centre Canada
RF Technologies
3701 Carling Avenue, Ottawa, ON, Canada Ottawa, ON, K2H 8S2, Canada
Julie Ferrigno4, Olivier Ferrand4, Jian Xiong Hu4, Sylvie Lafrenière4 GGI International
1455, 32e Avenue
Lachine, QC H8T 3J1, Canada
S-2
Figure S1. Thermogravimetric analysis of silver neodecanoate (red line), silver neodecanoate
dissolved in a mixture of aromatic and aliphatic solvents, green line) and the formulated molecular ink (blue line). Note that the both the thermogravimetric analysis and differential thermographic analysis shows that formulation of the ink with solvents and solvents/ethyl cellulose decreases the decomposition temperature by ~50°C (from 230 to 180°C).
S-3
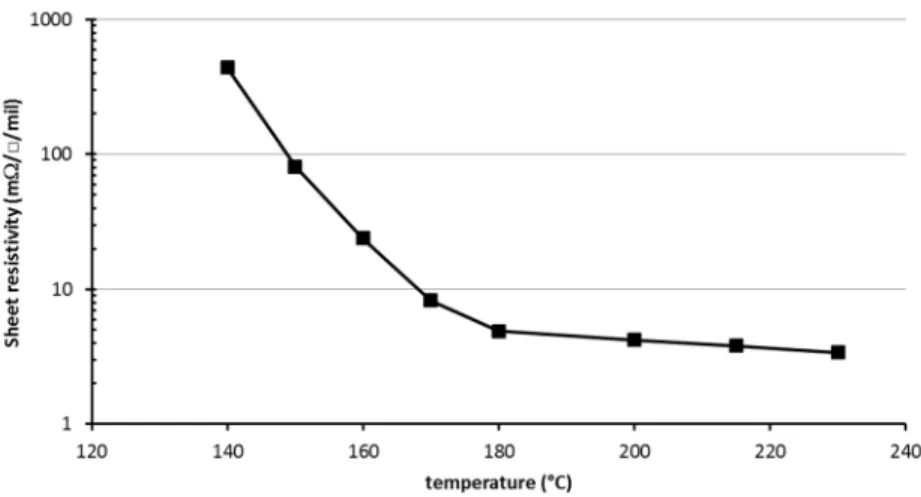
Figure S2. A plot showing the dependence of sheet resistivity on the sintering temperature for
screen printed molecular ink on KaptonTM substrate (sintering time = 60 minutes). Note that the temperature is measured with a thermocouple fixed to the substrate.
Figure S3. A plot showing the dependence of volume resistivity on the sintering temperature for
screen printed molecular ink on KaptonTM substrate (sintering time = 60 minutes). Note that the temperature is measured with a thermocouple fixed to the substrate.
S-4
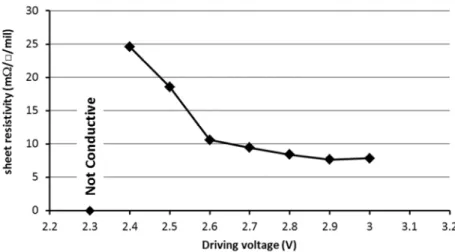
Figure S4. A plot showing the dependence of sheet resistivity on the photosintering driving
voltage for screen printed molecular ink onto KaptonTM substrate and photosintered. The driving voltages capable of producing conductive traces ranges from 2.4 to 3.0 kV, which correspond to energy densities of 0.58 to 0.91 J/cm2 per pulse, as described in the experimental section.
Figure S5. A plot showing the dependence of volume resistivity on the photosintering driving
voltage for screen printed molecular ink onto KaptonTM substrate and photosintered. The driving voltages capable of producing conductive traces ranges from 2.4 to 3.0 kV, which correspond to energy densities of 0.58 to 0.91 J/cm2 per pulse, as described in the experimental section.
S-5
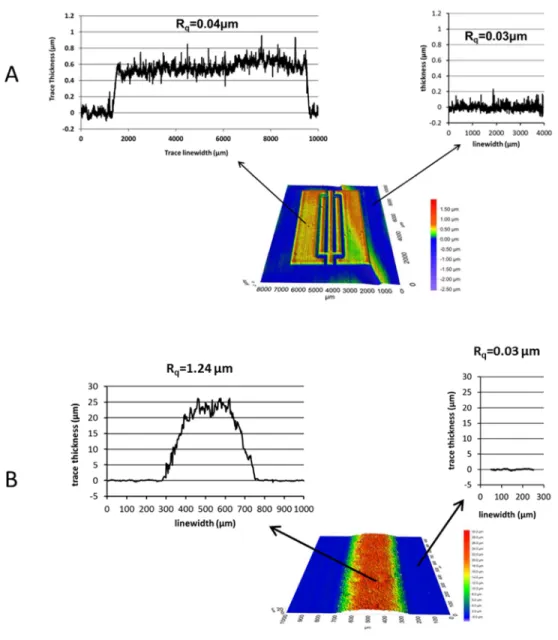
Figure S6. The root mean square surface roughness (Rq) of a feature derived from thermal sintering of the silver molecular ink printed on KaptonTM substrate (A). Note that the surface roughness of the silver molecular ink-derived trace (0.04 µm) is similar to that of the Kapton substrate itself (0.03 µm). Conversely, the Rq value for flake inks is significantly higher (~1.24 µm) (B).
S-6
Figure S7. A topographical analysis of the traces followed through the printing and sintering
processes, showing a 3D profilometer image of a ~160 μm trace after being printed and air dried (a), and subsequently thermally sintered in a reflow oven at 220°C for 10 minutes (b) or photosintered using the Xenon Sinteron 2000 system (c). Overlapping profilometer cross-sectional images are also shown (d) to highlighting the thickness differences in the unsintered, air dried traces (black) in comparison to the photosintered traces (blue) and thermally sintered traces (red).
S-7
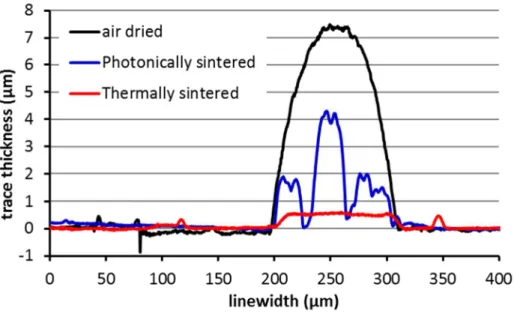
Figure S8. Overlapping profilometer cross-sectional images acquired with a Dektak stylus
profilometer highlighting the thickness differences in the unsintered air dried traces (black) in comparison to the photosintered traces (blue) and thermally sintered traces (red). Note that the overall structure of the traces are consistent with what we measure with the optical profilometer in Figure S7.
S-8
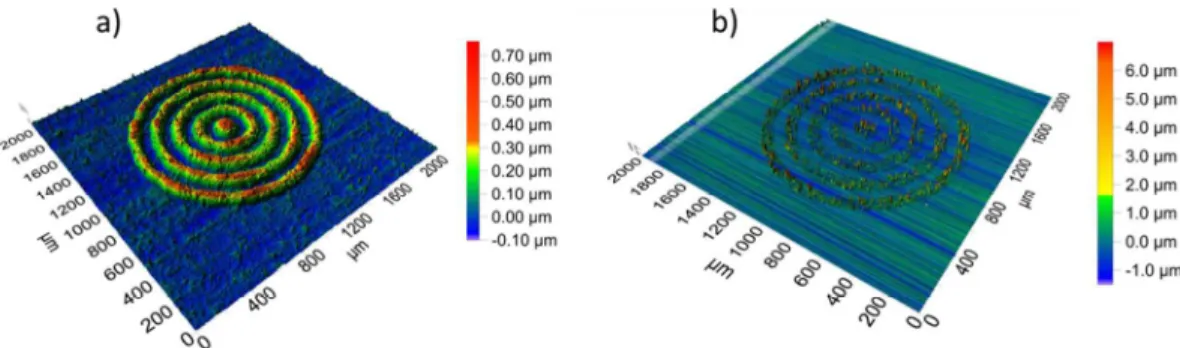
Figure S9. Comparison of trace topography obtained from optical profilometry for thermally (a)
and photonically (b) sintered molecular ink derived traces. Note that the resolution and pitch is unaffected (see Table S2).
Figure S10. Photographs of aerosol jet printed molecular ink traces subjected to cross-hatch
testing (ASTM D3359-09). Silver molecular ink formulated without ethyl cellulose printed onto polycarbonate and sintered at 120°C for 60 minutes; before (a) and after (b) the cross hatch adhesion test. Note that an entire uniform layer of the trace is removed with scotch tape (c) indicating that, in the absence of ethyl cellulose, the adhesion of the traces to polycarbonate is poor.
S-9
Figure S11. Rheological properties of the inkjet ink formulation, showing the ink viscosity is
independent of shear stress put on the ink. Specifically, as a sheer stress is put on the liquid (blue trace) the viscosity remains unchanged and when the shear stress is removed (red trace), the viscosity remain the same.
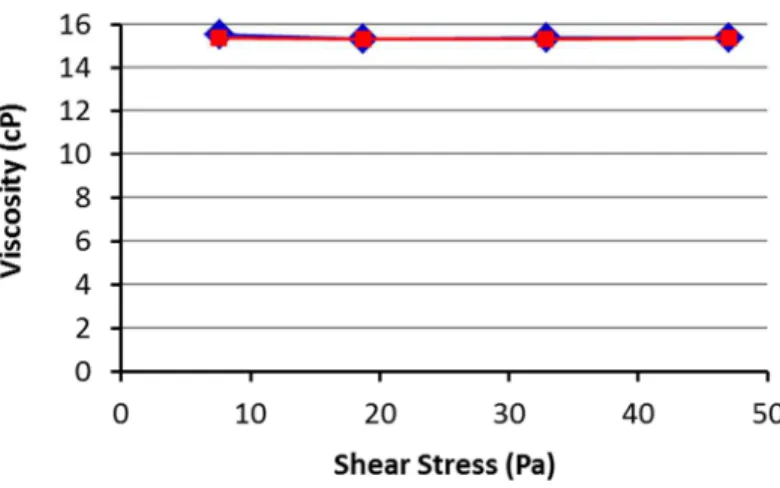
Figure S12. Rheological properties of the aerosol jet ink formulation, showing the ink viscosity
is independent of shear stress put on the ink. Specifically, as a sheer stress is put on the liquid (blue trace) the viscosity remains unchanged and when the shear stress is removed (red trace), the viscosity remain the same.
S-10
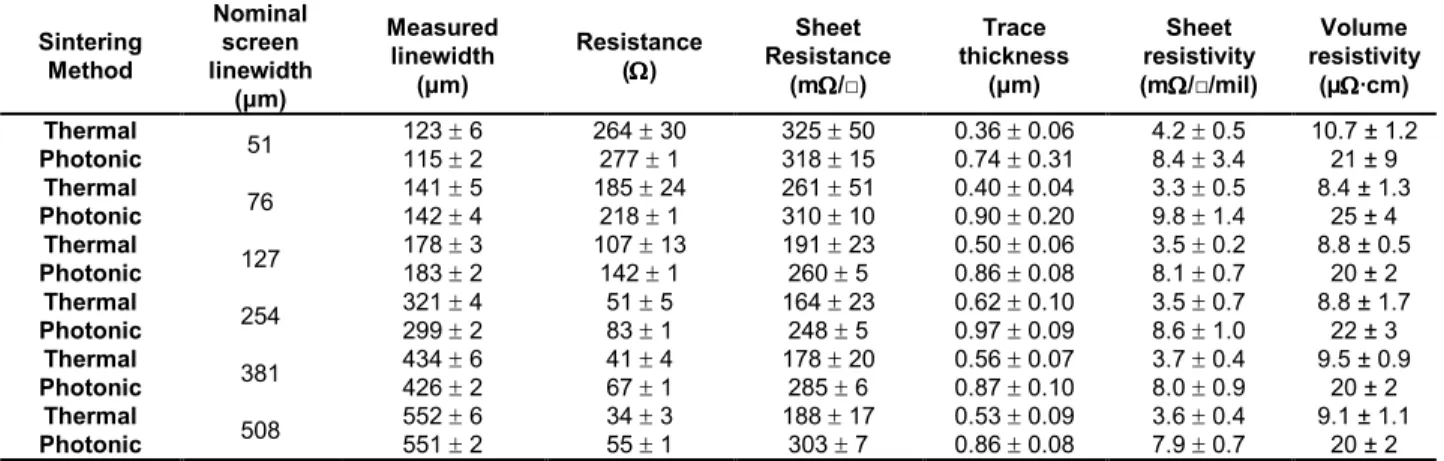
Table S1. Comparison of dimensional and electrical data for photonically and thermally sintered
linear 10 cm traces on Kapton™. Sintering Method Nominal screen linewidth (µm) Measured linewidth (µm) Resistance (ΩΩΩΩ) Sheet Resistance (mΩΩΩ/□) Ω Trace thickness (µm) Sheet resistivity (mΩΩΩ/□/mil) Ω Volume resistivity (µΩΩΩ·cm) Ω Thermal 51 123 ± 6 264 ± 30 325 ± 50 0.36 ± 0.06 4.2 ± 0.5 10.7 ± 1.2 Photonic 115 ± 2 277 ± 1 318 ± 15 0.74 ± 0.31 8.4 ± 3.4 21 ± 9 Thermal 76 141 ± 5 185 ± 24 261 ± 51 0.40 ± 0.04 3.3 ± 0.5 8.4 ± 1.3 Photonic 142 ± 4 218 ± 1 310 ± 10 0.90 ± 0.20 9.8 ± 1.4 25 ± 4 Thermal 127 178 ± 3 107 ± 13 191 ± 23 0.50 ± 0.06 3.5 ± 0.2 8.8 ± 0.5 Photonic 183 ± 2 142 ± 1 260 ± 5 0.86 ± 0.08 8.1 ± 0.7 20 ± 2 Thermal 254 321 ± 4 51 ± 5 164 ± 23 0.62 ± 0.10 3.5 ± 0.7 8.8 ± 1.7 Photonic 299 ± 2 83 ± 1 248 ± 5 0.97 ± 0.09 8.6 ± 1.0 22 ± 3 Thermal 381 434 ± 6 41 ± 4 178 ± 20 0.56 ± 0.07 3.7 ± 0.4 9.5 ± 0.9 Photonic 426 ± 2 67 ± 1 285 ± 6 0.87 ± 0.10 8.0 ± 0.9 20 ± 2 Thermal 508 552 ± 6 34 ± 3 188 ± 17 0.53 ± 0.09 3.6 ± 0.4 9.1 ± 1.1 Photonic 551 ± 2 55 ± 1 303 ± 7 0.86 ± 0.08 7.9 ± 0.7 20 ± 2
Table S2. A table highlighting the measured linewidth and line spacing for both the concentric
circle features processed using thermal and photonic sintering. This data is measured from the images presented in Figure S5.
Sintering Method Measured Linewidth (µm) Measured Line spacing (µm) Thermal 105 ± 2 45 ± 2 Photonic 108 ± 4 50 ± 4
S-11
Table S3. Flex and crease testing (ASTM F1683-02) as a function of linewidth produced from
the photonic sintering of the molecular ink on KaptonTM substrate. Note all changes < 10%. Measured Linewidth (µm) 115 ± 2 142 ± 4 183 ± 2 299 ± 2 426 ± 2 551 ± 2 Tensile flex % change in Resistance 4.5 ± 0.3 4.2 ± 0.1 4.0 ± 0.2 3.5 ± 0.1 3.4 ± 0.1 3.5 ± 0.1 # samples 4 12 4 14 14 14 Compressiv e flex % change in Resistance 8.7 ± 0.4 7.7 ± 0.3 7.6 ± 0.5 5.8 ± 0.2 5.3 ± 0.2 4.9 ± 0.2 # samples 4 12 14 14 14 14 Tensile crease % change in Resistance 3.3 ± 0.4 5.7 ± 0.7 6.6 ± 0.9 6.5 ± 1.3 4.0 ± 0.5 3.9 ± 0.5 # samples 4 18 17 21 20 21 Compressiv e crease % change in Resistance 3.3 ± 1.7 2.9 ± 0.7 2.7 ± 0.6 3.1 ± 0.6 2.4 ± 0.5 2.4 ± 0.5 # samples 7 18 17 21 20 21
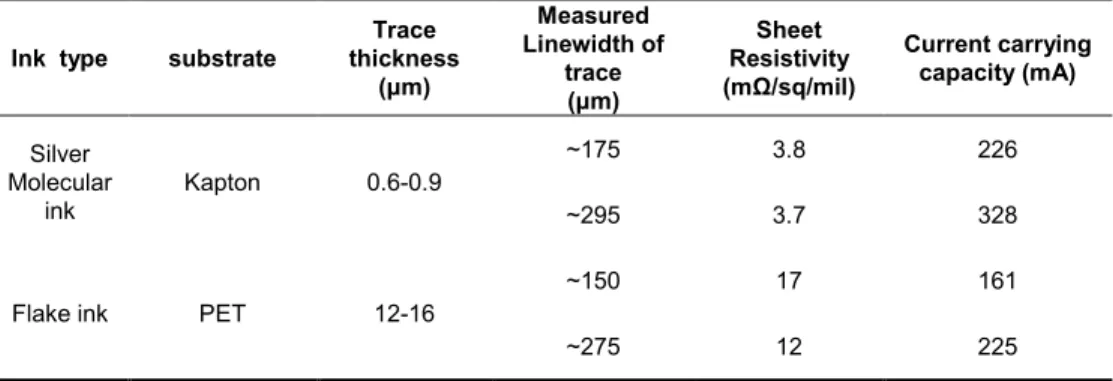
Table S4. Current carrying capacity comparison (measured according to ASTM F1681-07a), for
the molecular ink and a representative silver flake ink.
Ink type substrate
Trace thickness (µm) Measured Linewidth of trace (µm) Sheet Resistivity (mΩ/sq/mil) Current carrying capacity (mA) Silver Molecular ink Kapton 0.6-0.9 ~175 3.8 226 ~295 3.7 328
Flake ink PET 12-16
~150 17 161
S-12
Table S5. Shear force, in pounds, required to remove an LED bound to the printed silver
molecular ink and silver flake ink traces.
IPC Shear Force Test on LED (with silver epoxy-based adhesive)
Flake Ink on Polyimide (lbs) Molecular Ink Thermosintered on Polyimide (lbs) Molecular ink Photosintered on Polyimide (lbs) LED 1 3.85 5.30 4.95 LED 2 3.65 4.80 4.10 LED 3 3.85 4.30 4.05 LED 4 3.55 4.75 4.90 LED 5 - - 5.15 Minimum 3.55 4.30 4.05 Average 3.73 4.79 4.63 Maximum 3.85 5.30 5.15