Architecting space communication networks
under mission demand uncertainty
The MIT Faculty has made this article openly available.
Please share
how this access benefits you. Your story matters.
Citation
Sanchez Net, Marc, del Portillo, Inigo, Cameron, Bruce, and
Crawley, Edward. “Architecting Space Communication Networks
Under Mission Demand Uncertainty.” 2015 IEEE Aerospace
Conference (June 2015): 1-11.
As Published
http://dx.doi.org/10.1109/AERO.2015.7119020
Publisher
Institute of Electrical and Electronics Engineers (IEEE)
Version
Author's final manuscript
Citable link
http://hdl.handle.net/1721.1/108024
Terms of Use
Creative Commons Attribution-Noncommercial-Share Alike
Architecting Space Communication Networks under
Mission Demand Uncertainty
Marc Sanchez Net, I ˜nigo del Portillo, Bruce Cameron, Edward Crawley Massachusetts Institute of Technology
77 Massachusetts Ave 33-409 Cambridge, MA 02139
617-682-6521
{msnet,portillo,bcameron,crawley}@mit.edu
Abstract—NASAs Space Network has been a successful program that has provided reliable communication and navigation ser-vices for three decades. As the third generation of satellites is being launched, alternatives to the current architecture of the system are being studied in order to improve the performance of the system, reduce its costs and facilitate its integration with the Near Earth Network and the Deep Space Network. Within this context, past research has proven the feasibility of efficiently exploring a large space of alternative network architectures using a tradespace search framework.
Architecting a space communication network is a complex task that requires consideration of uncertainty, namely (1) factoring in customer demand variability, (2) predicting technology im-provements and (3) considering possible budgetary constraints. This paper focuses on adding uncertainty associated with (1) to the existing communications network architecture tool by describing a heuristic-based model to derive mission concept of operations (conops) as a function of communication require-ments. The accuracy of the model is assessed by comparing real conops from current TDRSS-supported missions with the pre-dicted concept of operations. The model is used to analyze how customer forecast uncertainty affects the choice of the future network architecture. In particular, four customer scenarios are generated and compared with the current TDRSS capabilities.
T
ABLE OFC
ONTENTS1 INTRODUCTION. . . 1
2 MODELS TO ARCHITECT SPACE COMMUNICA -TION NETWORKS . . . 2 3 RESULTS. . . 5 4 CONCLUSIONS. . . 8 ACKNOWLEDGMENTS . . . 10 REFERENCES . . . 10 BIOGRAPHY . . . 10
1. I
NTRODUCTION MotivationCommunication and navigation services are a crosscutting element that all missions require in order to support their daily operations. Nevertheless, deriving their characteristics from mission and programmatic requirements is a non-trivial task that typically involves scientists and communication and system engineers, as well as active negotiation with the ground and space assets that will be providing the services [1]. In essence, the goal of this effort is as twofold: First, obtain a communication subsystem design for the mission that meets the data volume and tracking requirements and 978-1-4799-5380-6/15/$31.00 c 2015 IEEE.
minimizes the amount of resources that are used to transmit the information. Second, derive a concept of operations (conops) that facilitates data delivery process, the spacecraft commanding and health monitoring, and is compatible with the limitations of the set of assets that will be used to interface between the mission operations center (MOC) and the spacecraft.
The classical approach to solve the second goal is to formu-late an optimization problem [1], [2], [3], [4]. For instance, the returned data volume can be maximized subject to con-straints in the contact time, number of passes per orbit and limitations in the supported data rates. Furthermore, temporal constraints are imposed so that all operations take place in available contact opportunities.
Despite the attractiveness of this approach, several pitfalls hinder its applicability to define conops for future space-craft. First, missions will express requirements differently depending on their specific scientific objectives, types of requested services and design maturity. As an example, the International Space Station might require a high definition video service at a minimum of 50 Mbps during 95% of its orbit, where a 5% rest period is allowed so that astronauts and personnel at the MOC can rest. In contrast, mission designers for a future university CubeSat might only know the data generation rate from the instruments on-board the spacecraft, orbit characteristics and the university ground station capabilities. Similarly, highly capable Earth obser-vation missions might have tight requirements on the time between consecutive contacts due to the amount of data their instruments are generating and the amount of on-board memory they can accommodate in the spacecraft.
Therefore, the question becomes: How can we formulate the optimization problem to obtain the conops of any mission in such a way that it can accommodate all possible scientific, engineering and programmatic requirements? Furthermore, is it possible to address the problem in such a way that is highly natural and intuitive for mission designers and network managers? And finally, what is the impact of different service conops and customer demand uncertainty in the architecture of future space communication networks?
Research Goals
This paper addresses these questions through a two step process. First, it presents a rule-based heuristic algorithm that derives concept of operations for different communication services based on mission data and programmatic require-ments. Its applicability to different types of missions in the near Earth domain is demonstrated by comparison with current real mission conops supported by the Near Earth Network [5].
Second, it uses the aforementioned algorithm to predict the service characteristics and conops for a nominal, pessimistic and optimistic set of missions that will require communi-cation services in the 2020 to 2030 time frame. These customer scenarios are then used as an input to assess the value of different space network architectures and analyze their sensitivity to uncertainty in the customer base.
Paper Structure
The structure for the rest of this paper is as follows: First, an overview of the Integrated Analysis of Communication Ar-chitectures (ITACA), the tool used to evaluate space network architectures, is presented. This is followed by a discussion on how to generate communication conops based on mission requirements. Next, the rule-based system developed to solve the problem at hand is presented and validated with missions for which both requirements and concept of operations are available. Then, multiple mission scenarios are generated and fed into ITACA for evaluation against a predefined set of space network architectures. The results are finally used to quantify the benefit and cost of each alternative in the presence of customer uncertainty.
2. M
ODELS TO ARCHITECT SPACECOMMUNICATION NETWORKS
The goal of this section is to present an overview of the models used to architect space communication networks in the presence of demand uncertainty. First, a brief introduction to ITACA is presented. A thorough description of the tool can be found in [6], [7], while the present discussion focuses on how the benefit of an architecture is computed given a set of customer missions and their respective communication requirements. Next, the service characterization model is described. It specifies the set of variables that are used to model a service concept of operations, as well as the rule-based algorithm implemented in order to solve the problem of finding an optimal solution. The advantages of such an approach over a purely mathematical formulation are further discussed. Finally, the service characterization model is val-idated against current missions supported by NASA-owned networks.
Integrated Tradespace Analysis of Communications Architec-tures
The Integrated Analysis of Communication Architectures is a computational tool developed to explore large spaces of alternative network architectures that provide communication services in the near Earth domain. The tool formulates the problem of architecting the network as an optimization problem over the combinatorial space defined by a set of architectural decisions that drive the performance and cost of the system. These decisions include, for instance, the con-stellation pattern, the communication payloads and antennas placed on-board the relay satellites, as well as the ground system capabilities or the presence of inter-satellite links. Two search algorithms are available, full factorial enumer-ation and a customized genetic algorithm. They generate a valid network architecture by assigning a particular option to each architectural decision. Then, they combine their information together with constant parameters across archi-tectures (e.g. system lifetime) to (1) design the different space and ground assets in the network and (2) assess its performance and cost. The performance metric for the network is computed based on the ability of the network to
satisfy the concept of operations for the different services that customer missions request. In other words, ITACA assumes that the system requirements for the network are expressed as a set of customer missions, each one demanding one or more services (e.g. TT&C, science data return), and each service characterized by a particular concept of operations.
Five parameters are used to define a service concept of op-erations: Number of contacts per day, contact duration, mini-mum time between contacts, maximini-mum allowable latency and contact data rate. These are used, together with the network architecture and design, to construct a possible schedule that specifies the number of contacts that each mission is granted, the amount of data it is able to return over these contacts, the latency of the downlinked data, and the EIRP the customer platform will have to provide in order to close the link budgets with the network relay satellites and ground stations. Then, the satisfaction of a service is computed as the average between the fraction of data returned to the ground (over the total desired amount of data), a binary metric that indicates whether the latency requirement has been met, and a normalized figure of merit that captures the willingness of a mission to provide a given level of EIRP.
References [6], [7] provide in depth discussions on all sub-models and elements of ITACA, as well as the cost estimation relationships used to price the different assets of the network. Service characterization model
Problem formulation—The main goal of the service charac-terization modelis to provide an automated and efficient way to translate a mission’s scientific, engineering and program-matic requirements into a service concept of operations that satisfies them and is compatible with the restrictions imposed by the service providers. The proposed approach to solve this goal formulates the service characterization problem as a heuristic rule-based search over a constrained space of solutions. This space is characterized by the five variables that define a service conops:
• Contact time (Tc): Contact duration between the mission and a network asset.
• Number of contacts per day (Nc)
• Contact data rate (Rb): It is assumed that the data rate over a contact will be constant.
• Minimum time between consecutive contacts (∆Tmin) • Maximum time between consecutive contacts (∆Tmax) Both mission requirements and time constraints impose lower and upper bound to each of these conops variables. Therefore, the generic problem formulation is as follows: Given
θ = Tc Nc Rb ∆Tmin ∆Tmax (1)
then a solution θ∗to the service characterization problem is θ∗: max {lb1, .., lbN1} ≤ θ ≤ min {ub1, .., ubN2} (2) where lbi and lbj ∀i, j depend on one or combinations of mission and network requirements, as well as physical con-straints (e.g all contacts must fit within the duration of a day). Note that there is no objective function in this problem, the goal is to find one or multiple viable solutions θ∗given the available set of requirements. Then, mission designers and
network planners can decide if the resulting service conops is satisfactory or extra requirements should be imposed in order to obtain a better or more realistic solution.
On the other hand, since the problem has been formulated as a constrained search over a five variable design space, some generic properties are desirable when devising the algorithm that solves it:
• If the problem is overdefined (i.e. the available require-ments impose more constraints on the problem than degrees of freedom), then converge to the less stringent concept of operations that satisfies all the requirements and constraints. • If the problem is underdefined (i.e. the specified re-quirements are not sufficient to prescribe a single optimal solution), then provide a set of viable solutions in a finite amount of time.
• If the problem has no feasible solution, then satisfy all constraints and hard requirements while providing a best effort solution for soft requirements.
• Design the algorithm modularly so the effect of new mis-sion requirements can be added as they become available. The proposed solution is based on a rule-based implementa-tion of the Iterative Deepening Depth-First Search (IDDFS) algorithm [8]. Given an initial trivial non-feasible solution, apply a set of rules that modify the concept of operations so that one of the five variables is swapped to either its lower or upper bound. If the new solution is still not feasible, re-apply the same set of rules so that another variable in the concept of operations is modified. Repeat this process iteratively until a feasible solution is found or a maximum number of iterations is reached.
Since the decision of which conops variable will be modified at each iteration is not directly controlled but left to the acti-vation agenda of the rule-based expert system, two situations have to be controlled in the algorithm:
• Infinite loop: Assume you start in a given non-feasible concept of operations. Multiple rules are applied sequentially, each one making one single change in the conops, after which you obtain the same initial concept of operations. Then the rule-based expert system agenda could trigger the exact same sequence rules over and over, leading to an infinite loop situation. This problem, however, can be easily handled by keeping track of the conops explored and not revisiting them once they have been deemed as non-valid.
• Conops backtracking: During the search process, a given sequence of rules might lead to a conops that is non-feasible and whose neighbor conops have already been explored and considered non-valid. In other words, the search algorithm is stuck in a non-feasible part of the solution space. To exit it, the algorithm backtracks to a previous conops and re-starts the search process based on his neighbor solutions. If all of them have also been explored, then it backtracks again until an unfeasible conops with neighbors not explored is found, or the entire conops space has been explored and no valid concept of operations has been found (i.e. there is no feasible solution).
Algorithm implementation—The current implementation of the service characterization model is able to handle the following list of mission requirements:
• On-board memory size
• Percentage of memory utilized before dump • Data product acquisition time
• Data product size
• Total instrument data rate • Peak instrument data rate • Instrument duty cycle • Daily data volume • Orbit data volume • Data latency
• Percentage of orbital coverage • Maximum and minimum data rate • Maximum and minimum contacts per day • Maximum and minimum contacts per orbit • Maximum and minimum contact time
They are used to generate a total of 30 rules that define the upper and lower bounds for θ. Additionally, 2 extra rules are needed to provide the backtracking capability. As an example, rule 1 is used to ensure that the conops contact data rate does not exceed a given limit. The rule starts by searching in the database of requirements for a cap in the maximum data rate that the mission’s communication subsystem can support (lines 2 and 3). If the current concept of operations exceeds it (lines 4 and 5), and a conops using that maximum data rate has not been previously explored (line 6), then generate a new concept of operations were the contact data rate is set to the requirement cap.
Rule 1: Limit on maximum allowable Rb
1 (d e f r u l e l i m i t −Rb−t o −max
2 (REQUIREMENT (m i s s i o n ?m) (name max−Rb)
3 (v a l u e ?Rb−max) ) 4 ? f <− (CONOPS (i t ? i t) (m i s s i o n ?m) (Rb ?Rb) ) 5 (t e s t (< ?Rb−max ?Rb) ) 6 (n o t (CONOPS (m i s s i o n ?m) (Rb ?Rb−max) ) 7 => 8 (d u p l i c a t e ? f (i t (+ ? i t 1) ) (Rb ?Rb−max) ) 9 )
Another example of a more complex logic is presented in rule 2, where minTbC represents the minimum time between contacts previously denoted as ∆Tmin. In this case, two mission requirements are necessary, the orbital period (lines 2 and 3) and the instrument duty cycle (lines 4 and 5). The rule indicates that a contact should not be scheduled unless the instrument has been able to collect sufficient data per orbit, where the duty cycle is used as a proxy metric for the amount of data that scientists consider desirable.
Rule 2: Limit ∆Tminbased on instrument duty cycle 1 (d e f r u l e l i m i t −minTbC−due−t o −i n s t r u m e n t −d u t y −c y c l e 2 (REQUIREMENT (m i s s i o n ?m) (name o r b i t a l −p e r i o d) 3 (v a l u e ?T) ) 4 (REQUIREMENT (m i s s i o n ?m) (name i n s t −d u t y −c y c l e) 5 (v a l u e ? i n s t −DC) ) 6 ? f <− (CONOPS (i t ? i t) (m i s s i o n ?m) 7 (minTbC ? minTbC) ) 8 (t e s t (< ? minTbC (∗ ?T ? i n s t −DC) ) ) 9 (n o t (CONOPS (m i s s i o n ?m) 10 (minTbC (∗ ?T ? i n s t −DC) ) ) 11 => 12 (d u p l i c a t e ? f (i t (+ ? i t 1) ) 13 (minTbC (∗ ?T ? i n s t −DC) ) ) 14 )
Finally, rule 3 exemplifies a piece of logic included in the ex-pert system to ensure that the resulting concept of operations meets the temporal constraints of the problem. Therefore, this rule applies regardless of the mission requirements as it represents a hard constraint that has to always be satisfied in order to consider a conops specification valid. In particular, its goal is to ensure that equation 3 hold given that we are specifying a service concept of operations for just one day.
T[min] 0 2 4 6 8 10 P r { Tc > T } 0 0.2 0.4 0.6 0.8 1 Contact duration Tc X: 8.006 Y: 0.5885
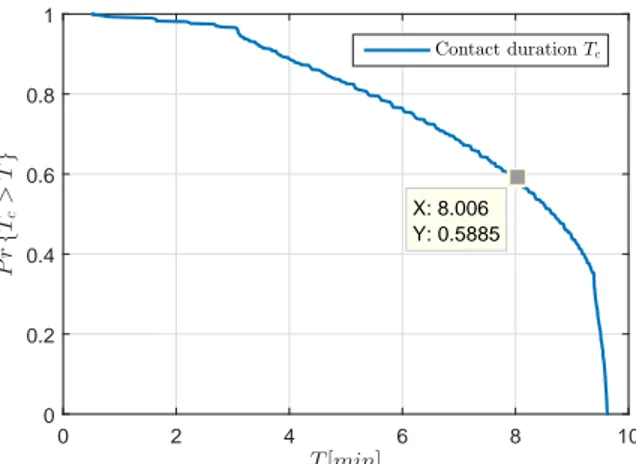
Figure 1: Aqua-EPGN contact duration distribution
Rule 3: Limit Tcbased on temporal constraints 1 (d e f r u l e l i m i t−Tc−t o−f i t−c o n t a c t s−w i t h i n−a−day 2 ? f <− (CONOPS (i t ? i t) (m i s s i o n ?m) (Tc ? Tc) ) 3 (t e s t (> ? Tc (− (/ 86400 ?Nc) ? minTbC) ) ) ) 4 (n o t (CONOPS (m i s s i o n ?m) 5 (Tc (− (/ 86400 ?Nc) ? minTbC) ) ) ) 6 => 7 (d u p l i c a t e ? f (i t (+ ? i t 1) ) 8 (Tc (− (/ 86400 ?Nc) ? minTbC) ) ) ) 9 ) Validation
In order to validate the service characterization model the Aqua mission from NASA’s Earth Observing System (EOS) [9] will be used. Its operations are currently supported through three main elements:
• The EOS Polar Ground Network (EPGN), two primary polar ground stations in the northern hemisphere (Alaska Ground Station - AGS - and Svalvard Ground Station - SGS), plus a back-up secondary ground station located in Antarctica (McMurdo Station).
• The Space Network (SN) that provides continuous cov-erage for contingency operations and low data rate TT&C services through its multiple access service.
• The Direct Broadcast (DB) mode of transmission, that has a limited capability to deliver Aqua’s data directly to scientists without processing it in the mission control center.
For the purposes of this validation, only services provided through the EPGN will be studied and, in particular, the science data return service will be used as a benchmark. This is mainly due to the limited information on the requirements that characterize the other elements that support Aqua’s oper-ations.
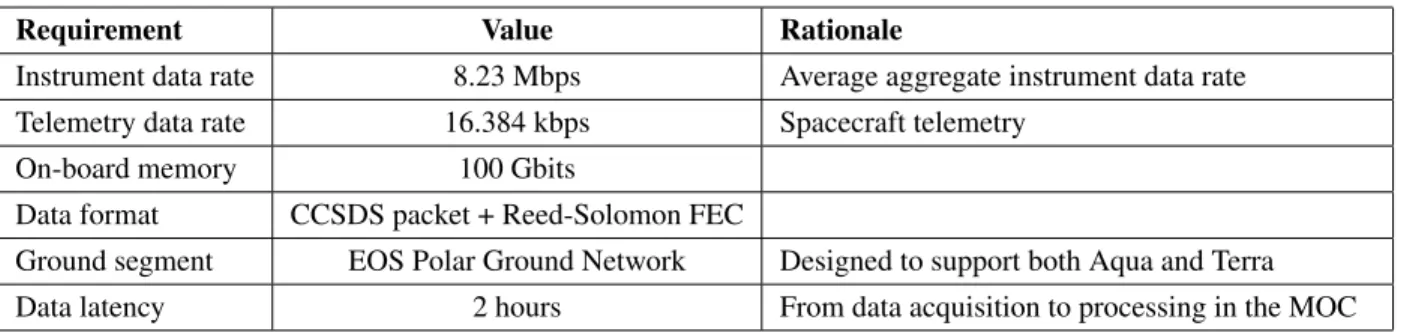
The baseline requirements for Aqua’s science data return service through the EPGN have been derived from reference [10] and are summarized in table 1. Based on the list of sup-ported requirements in the service characterization model, all of them can be directly inputted to the rule-based expert system except for the effect of having to use AGS and SGS as primary ground stations. In order to derive the extra re-quirements they impose, STK [11] is used to propagate Aqua orbital motion for a month. Then, contact opportunities from their antennas and the spacecraft are computed assuming a minimum elevation angle of 10 deg.
T[min] 0 200 400 600 800 1000 P r {∆ Tm in > T } 0 0.2 0.4 0.6 0.8 1
Min. time between contacts ∆Tmin
X: 88 Y: 0.8628
Figure 2: Aqua-EPGN contact duration distribution Table 2: Aqua requirements for the model
Requirement Value Units
Orbit altitude 708 km
Data generation rate 9.55 Mbps
Max. Tc 8 min
Min. ∆Tmin 88 min
Latency 1.5 hours
Based on this analysis, the first requirement that can be derived is the maximum contact time. Figure 1 presents the probability of having a contact duration longer than T minutes. It can be seen that a contact longer than 8 minutes is only possible for less than 60% of the passes. Therefore, 8 minutes is set a upper bound for the contact duration. On the other hand, the choice of two northern hemisphere ground stations has also a direct effect on the minimum time between consecutive contacts. In particular, figure 2 plots the probability of having two contacts in less than T minutes. It can be seen that a minimum time between contacts of at least 88 minutes should be expected given the current choice for the ground system.
The final set of requirements for the science data return service concept of operations is detailed in table 2. The data generation rate is computed assuming a 16% overhead from the CCSDS packetization and Reed-Solomon FEC [10]. Similarly, the latency requirement is reduced to 1 hour and 30 minutes because the expected latency between the EPGN and Aqua’s MOC is 30 minutes [12].
Reference [10] also provides the concept of operations for Aqua. It specifies 17 or 18 daily contacts at 150Mbps (approximately one per orbit), where the data dump will only occur during the central part of the passes over AGS and SGS, while the entire pass duration also be used for commanding, sending telemetry and tracking the spacecraft. In contrast, the service characterization modelpredicts a total of 16 contacts per day, each one with a nominal duration of 8 minutes, a data rate of 100Mbps, a maximum time between contacts of 90 minutes and a minimum time between contacts of 80 minutes. Note that this concept of operations clearly meets the data latency requirements, as well as the limits in the minimum time between consecutive passes. Furthermore, the
Table 1: Aqua requirements summary
Requirement Value Rationale
Instrument data rate 8.23 Mbps Average aggregate instrument data rate
Telemetry data rate 16.384 kbps Spacecraft telemetry
On-board memory 100 Gbits
Data format CCSDS packet + Reed-Solomon FEC
Ground segment EOS Polar Ground Network Designed to support both Aqua and Terra
Data latency 2 hours From data acquisition to processing in the MOC
total returned data volume is 100Gbytes per day, the same amount that is on average being generated.
The only discrepancies between the conops obtained through the service characterization model come from a reduction of contact data rate and consequent increase in contact duration. This is due to the pessimistic assumption that missions will tend to minimize the data rate at which they transmit. In this case, however, the mission decided to take full advantage of both ground segment data rate capabilities and therefore only transmit science over the central part of the contact [10].
3. R
ESULTSThe goal of this section is to demonstrate the usefulness of the service characterization module, when used in conjunction with ITACA, to quantify the value of space network architec-tures in the presence of requirements uncertainty. The results presented herein aim at quantifying the value of the current TDRS communication payloads given their ability to support robotic and astronaut missions in low Earth orbit in the 2020 to 2030 time frame.
Architectures tradespace defintion
The first step when using ITACA is to define the set of architectural options that can be used to generate valid net-work architectures. Table 3 extracted from reference [6] summarizes the set of architectural decisions that are avail-able in the tool. For the purposes of this study it will be assumed that satellites are placed in geosynchronous orbit, they are procured, launched and operated by NASA, and they use monolithic (non-disaggregated) spacecraft with bent-pipe technology. Similarly, the ground system will be composed of White Sands, Guam and the new site Blossom Point. Three communication payloads are considered to be available to architect the network: First, the TDRS single access (SA) service is based on a 5 meter parabolic antenna attached to an S-band, Ku-band and Ka-band transponder. This sin-gle access service can provide simultaneous communication links at S and Ku or Ka-band, thus allowing missions to schedule their science data return services through the high frequency, high capacity link, while commanding, telemetry and tracking are transmitted through the S-band contact [13]. Similarly, the current TDRS system also offers a multiple access service (MA) operating at S-band. It is based on a phased array antenna coupled with a set of beamformers that allows tracking and communicating with 5 independent spacecraft [13].
On the other hand, this study assumes that in the next decade NASA will have available optical technology to provide high
Table 4: Payload characteristics
SA MA LLST Data rate [Mbps] 6 300 600 1 2880 Band S Ku Ka S Opt Mass - - 69 Kg Power - - 130 W Aperture 4.9 m 12 dB 10 cm Modulation B,Q-PSK B,Q-PSK DPSK
data rate communications in the near Earth context. In particular, it is assumed that the Luna Lasercomm Space Ter-minal (LLST) first demonstrated in the LADEE mission and scheduled to launch again in LCRD, will be fully operational and could therefore be used to extend the capabilities of the TDRS system. This includes using optical communications to provide forward and return links from TDRS to the cus-tomer missions, but also to support high data rate downlink capabilities from the TDRS spacecraft to the ground. Table 4 summarizes the key parameters and capabilities for each of these payloads. They were extracted from references [13] and [14].
Finally, the space network architectures under consideration are combinations among the three aforementioned payloads with the following restrictions: Only two SA antennas can be put on the TDRSS bus; only one payload can be accom-modated in a TDRS satellite because it requires the entire nadir bay; and only one optical terminal can be placed on TDRS, but its reduced dimensions and power requirements allow them to be used in combination with the SA and MA payloads. Table 5 summarizes the resulting spacecraft configurations under study.
User scenario definition
Eight user scenarios have been generated to capture variabil-ity in the set of missions that will demand services from the next generation TDRS. They intend to capture the effect of two sources of uncertainty, the number of missions that will be flying in 2020-2030, and the conops for the communica-tion services they request.
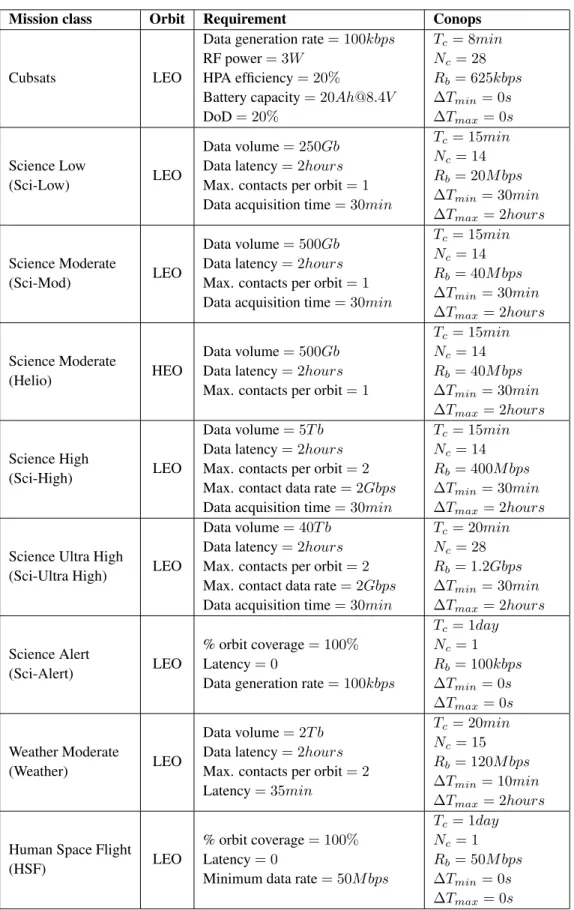
In order to generate concepts of operations for the different types of missions, they have been categorized in nine canoni-cal mission classes depending on major mission requirements such as daily data volume or the maximum admissible data latency. They are are detailed in table 6, along with the con-cept of operations generated by the service characterization module.
Table 3: Architectural decisions
Decision Range of values
Antenna selection Any parabolic antenna supporting S-, X-, Ku-, Ka-band.
Opti-cal telescopes (1550nm)
Payload type selection bent-pipe vs circuit-switched vs packet-switched
Payload-to-spacecraft allocation (disaggregation)
All the possible partitions of Ninstr instruments into 1 ≤
Nsat≤ Ninstrsatellites
Inter-Satellite Link payload allocation Yes or no for each constellation of satellites
Contract modality 100% procurement, hosted payloads, or 100% commercial
Orbit selection GEO, MEO or LEO
Constellation design # planes: Np
# sats per plane: Nsp
Fractionation strategy all-mothers vs. mother-daugther
Ground station Subset of White Sands, Guam and a new site
Table 5: Spacecraft configurations
SA-1 SA-2 MA LLST SC-1 0 0 0 1 SC-2 0 0 1 0 SC-3 0 0 1 1 SC-4 1 0 0 0 SC-5 1 0 0 1 SC-6 1 0 1 0 SC-7 1 0 1 1 SC-8 1 1 0 0 SC-9 1 1 0 1 SC-10 1 1 1 0 SC-11 1 1 1 1
Similarly, the number of missions flying in the 2020-2030 decade has been divided into four paradigmatic scenarios: nominal, CubeSat proliferation, science-data driven and bud-get constraint. The nominal case is based on the load that the current TDRS system is supporting. In contrast, the CubeSat proliferation scenario assumes that NASA will be supporting 50 CubeSats. The science-data driven scenario is characterized by the inclusion of one ultra high mission (e.g. DESDynI [15]), and one extra “science alert” mission and “science high” mission. Finally, the budget constraint scenario assumes that NASA is no longer supporting the ISS and the science mission have been reduced significantly (only one “science high” mission and half of the other lower class missions).
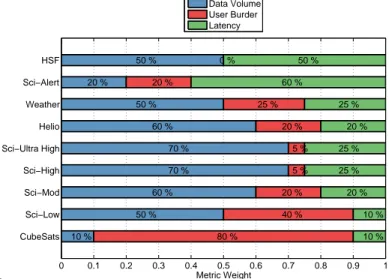
Finally, in order to be able to compute the benefit metric for the space network architecture two extra pieces of infor-mation are necessary: The relative importance between the metrics against which the service conops are evaluated; and the relative importance between mission classes. Figure 3 presents the selected weights for the service metrics. Note how different missions have very different preferences, with CubeSats highly concerned about the user burden while the ISS (HSF) is only concerned about the timeliness and volume for the data. Note also that these weights are held constant across the four paradigmatic scenarios previously described. Similarly, figure 4 presents the mission classes relative
im-0 0.1 0.2 0.3 0.4 0.5 0.6 0.7 0.8 0.9 1 CubeSats Sci−Low Sci−Mod Sci−High Sci−Ultra High Helio Weather Sci−Alert HSF Metric Weight 10 % 80 % 10 % 50 % 40 % 10 % 60 % 20 % 20 % 70 % 5 % 25 % 70 % 5 % 25 % 60 % 20 % 20 % 50 % 25 % 25 % 20 % 20 % 60 % 50 % 0 % 50 % Data Volume User Burder Latency
Figure 3: Relative importance for service metrics
portance. For the three non-constrained cases, it is assumed that the ISS is the dominant most important mission for the TDRS system and therefore is responsible for 50% of the total architecture benefit. The rest is split between scientific missions (Earth Observation, astrophysics and heliophysics), with higher importance assigned to both “high science” mis-sions and “science alert” mismis-sions. Note also that in the CubeSats proliferation scenario only 5% of the benefit comes from servicing them. This value assumes that the TDRS system would be willing to accept requests from this vast set of users, but they would never be prioritized over the other scientific missions. Finally, in the budget constrained sce-nario 75% of the benefit is obtained by successfully satisfying high demanding scientific missions.
Results
Figure 5 presents the tradespaces obtained with the five scenarios defined in section 3. The x-axis has a normalized figure of merit, where 1 indicates that all missions have been able to return all their desired data, they have all met their latency requirements, and they have required an acceptable EIRP to close the link budget (the threshold to define an EIRP
Table 6: Mission classes and requirements
Mission class Orbit Requirement Conops
Cubsats LEO
Data generation rate = 100kbps RF power = 3W
HPA efficiency = 20%
Battery capacity = [email protected] DoD = 20% Tc = 8min Nc= 28 Rb= 625kbps ∆Tmin= 0s ∆Tmax= 0s Science Low (Sci-Low) LEO Data volume = 250Gb Data latency = 2hours Max. contacts per orbit = 1 Data acquisition time = 30min
Tc = 15min Nc= 14 Rb= 20M bps ∆Tmin= 30min ∆Tmax= 2hours Science Moderate (Sci-Mod) LEO Data volume = 500Gb Data latency = 2hours Max. contacts per orbit = 1 Data acquisition time = 30min
Tc = 15min Nc= 14 Rb= 40M bps ∆Tmin= 30min ∆Tmax= 2hours Science Moderate (Helio) HEO Data volume = 500Gb Data latency = 2hours Max. contacts per orbit = 1
Tc = 15min Nc= 14 Rb= 40M bps ∆Tmin= 30min ∆Tmax= 2hours Science High (Sci-High) LEO Data volume = 5T b Data latency = 2hours Max. contacts per orbit = 2 Max. contact data rate = 2Gbps Data acquisition time = 30min
Tc = 15min Nc= 14 Rb= 400M bps
∆Tmin= 30min
∆Tmax= 2hours
Science Ultra High
(Sci-Ultra High) LEO
Data volume = 40T b Data latency = 2hours Max. contacts per orbit = 2 Max. contact data rate = 2Gbps Data acquisition time = 30min
Tc = 20min Nc= 28 Rb= 1.2Gbps ∆Tmin= 30min ∆Tmax= 2hours Science Alert (Sci-Alert) LEO % orbit coverage = 100% Latency = 0
Data generation rate = 100kbps
Tc = 1day Nc= 1 Rb= 100kbps ∆Tmin= 0s ∆Tmax= 0s Weather Moderate (Weather) LEO Data volume = 2T b Data latency = 2hours Max. contacts per orbit = 2 Latency = 35min Tc = 20min Nc= 15 Rb= 120M bps ∆Tmin= 10min ∆Tmax= 2hours
Human Space Flight
(HSF) LEO
% orbit coverage = 100% Latency = 0
Minimum data rate = 50M bps
Tc = 1day Nc= 1 Rb= 50M bps ∆Tmin= 0s ∆Tmax= 0s
Sci−Low (22.5 %) Sci−Mod (2.5 %) Sci−High (12.5 %) Helio (7.5 %) Weather (2.5 %) Sci−Alert (5 %) HSF (50 %)
(a) Nominal scenario
CubeSats (5 %) Sci−Low (17.5 %) Sci−Mod (2.5 %) Sci−High (12.5 %) Helio (7.5 %) Weather (2.5 %) Sci−Alert (5 %) HSF (50 %) (b) CubeSats proliferation CubeSats (2.5 %) Sci−Low (12.5 %) Sci−Mod (2.5 %) Sci−High (10 %) Sci−Ultra High (7.5 %) Helio (7.5 %) Weather (2.5 %) Sci−Alert (5 %) HSF (50 %)
(c) Science-data driven scenario
CubeSats (5 %) Sci−Low (25 %) Sci−Mod (5 %) Sci−High (30 %) Helio (20 %) Weather (5 %) Sci−Alert (10 %)
(d) Budget constrained scenario Figure 4: Mission classes relative importance
acceptable depends on the mission class). In turn, the y-axis contains the lifecycle cost to deploy, maintain and operate the network over a decade. Note that the demand uncertainty is captured through the four mission scenarios only affects the benefit metric, thus justifying the observed stratification in the y-axis.
In particular, figure 5a plots the results when the ISS is included as major stakeholder for the TDRSS network. It can be observed that the nominal, data-driven and CubeSat proliferation scenario obtain a very similar benefit score, therefore indicating that the network architectures in the Pareto front are not very sensitive to the uncertainty in the network customers. In other words, since the majority of the TDRSS value comes from properly supporting the ISS, as long as this customer the choice of a future network architecture over another is not differentiable.
On the other hand, figure 5b plots the the exact same set of network architectures when they are evaluated against their ability to satisfy the scientific missions. In that case, the spread of benefit for a particular architecture us close to 30%, with the constrained scenario always obtaining better scores than the three others. Furthermore, it seems that there is little difference between the current nominal case and the opti-mistic cases where there is either a proliferation of CubeSats or an increase in the highly demanding scientific missions. This fact suggests that the current TDRSS system would have enough capacity to provide communication services in these
cases.
Another interesting dimension of this study is related to the relay spacecraft configuration listed in table 4. Figure 6 presents the tradespace from figure 5a color coded according to the type of communication payloads that are placed on-board the relay satellites. Results indicate that spacecrafts that only have RF communication payloads are less vulnera-ble to demand uncertainty than those flying optical payloads. This is due to the fact that the majority of the customer base does not have service conops stringent enough to enforce the use of optical communications. Therefore, assuming that mission planners are risk averse, they will value more positively network architectures that maintain RF communi-cations as the baseline alternative.
4. C
ONCLUSIONSSummary
This paper has provided a quantitative study of the effect of mission demand uncertainty when architecting near Earth space communication networks. It has first presented the service characterization model, a new rule-based heuristic search algorithm to derive communication service concept of operations from mission engineering, scientific and pro-grammatic requirements. The algorithm has been designed using an iterative deepening depth-first search, where at each iteration one variable in the concept of operations is modified
benefit 0 0.2 0.4 0.6 0.8 1 Lifecycle cost [$M] 4000 5000 6000 7000 8000 9000 Constrained Data-driven Nominal Cubesats
(a) Scenarios with ISS
Benefit 0 0.2 0.4 0.6 Lifecycle cost [$M] 4000 5000 6000 7000 8000 9000 Constrained Data-driven Nominal Cubesats
(b) Scenarios without ISS Figure 5: Mission classes relative importance
benefit 0 0.2 0.4 0.6 0.8 1 lifecycle cost 4500 5000 5500 6000 6500 7000 7500 8000 8500 Pareto Front SC-1 SC-2 SC-3 SC-4 SC-5 SC-6 SC-7 SC-8 SC-9 SC-10 SC-11
Figure 6: Spacecraft configuration
in order to meet the constraints set by mission requirements. The termination criteria has been set to either a feasible conops solution if the problem is correctly identified, or a best effort solution when requirement conflicts are too stringent. Next, the algorithm has been validated using the original requirements and concept of operations for the Aqua mission from NASA’s Earth Observing System. It has been demon-strated that, given the instrument data rates, data latency and choice of ground system, the service characterization modelis able to successfully predict the concept of operation. Furthermore, it has proven the ability of the model to utilize heterogeneous types of mission requirements.
Finally, the service characterization model has been used in conjunction with ITACA to quantify the effect of demand uncertainty for the Space Network. Results indicate that selecting the future architecture for the TDRS system does not necessarily depend on the demand uncertainty, at least for the majority of the missions that they currently serve. Nevertheless, making sure that big drivers such as the ISS are properly satisfied would be major factor to consider in the selection of a final architecture.
Future work
The first body of future work is related to the integration of the service characterization model with ITACA. Automating this step would allow system architects to directly understand how the network is able to satisfy their customer’s major communication requirements and would, therefore, facilitate the tradespace exploration process. Similarly, the model should be expanded so that it can handle requirements from multiple spacecraft subsystems (e.g. energy limitations from the battery) and other possible restrictions.
The second line of future work consists of analyzing the effect of demand and conops uncertainty in the architecture of the future TDRS system. By coupling the service characteri-zation modelwith ITACA, one can analyze the system per-formance and cost when NASA policies are enforced across missions. For instance, the tool could be used to understand the cost savings from investing in optical communications at the agency level and replacing RF high data rate system for all robotic missions. Similarly, the effect of acquiring new spectrum bands (or extra bandwidth) could be directly quantified, as well as the effect on system capacity when scheduling policies are enforced (e.g. the maximum contact
time should be reduced to 7 minutes unless continuous cov-erage is required).
A
CKNOWLEDGMENTSThis project is funded by NASA under grant #NNX11AR70G. Special thanks to Greg Heckler for supporting the study, and Bill Horne and his team for helping in the mission requirement definition.
R
EFERENCES[1] A. Globus, J. Crawford, J. Lohn, and R. Morris, “Scheduling earth observing fleets using evolutionary algorithms: Problem description and approach,” in Pro-ceedings of the 3rd International NASA Workshop on Planning and Scheduling for Space, 2002, pp. 27–29. [2] Y.-w. Chen, Y.-s. Fang, J.-f. Li, and R.-j. HE,
“Constraint Programming Model of Satellite Mission Scheduling,” JOURNAL-NATIONAL UNIVERSITY OF DEFENSE TECHNOLOGY, vol. 28, no. 5, p. 126, 2006. [3] S.-m. Han, S.-w. Beak, K.-r. Cho, D.-W. Lee, and H.-d. Kim, “Satellite mission scheduling using genetic algorithm,” in SICE Annual Conference, 2008. IEEE, 2008, pp. 1226–1230.
[4] N. Muscettola and S. F. Smith, “Integrating planning and scheduling to solve space mission scheduling prob-lems,” in Proceedings 1990 DARPA Workshop on Inno-vative Approaches to Planning, Scheduling and Control, San Diego, CA, 1990, pp. 220–230.
[5] National Aeronautics and Space Administration, “Near Earth Network Users’ Guide,” Tech. Rep., 2010. [6] M. S. Net, D. Selva, A. Seas, B. Seery, B. G. Cameron,
and E. F. Crawley, “Exploring the Architectural Trade Space of NASAs Space Communication and Navigation Program,” in 2013 IEEE Aerospace Conference. Big Sky, Montana: Institute of Electrical and Electronics Engineers, 2013.
[7] M. S. Net, “Architecting Space Communications Net-works,” Master’s thesis, Massachusetts Institute of Technology Department of Aeronautics and Astronau-tics, Cambridge, Massachusetts, 2014.
[8] S. Russell, P. Norvig, and A. Intelligence, “A modern approach,” Artificial Intelligence. Prentice-Hall, Egnle-wood Cliffs, vol. 25, 1995.
[9] C. L. Parkinson, “Aqua: An Earth-observing satellite mission to examine water and other climate variables,” Geoscience and Remote Sensing, IEEE Transactions on, vol. 41, no. 2, pp. 173–183, 2003.
[10] NASA Goddard Space Flight Center, “EOS Aqua (PM) Ground System Requirements Document,” Tech. Rep., 2000.
[11] Analytical Graphics, Inc. [Online]. Available: http: //www.agi.com/
[12] NASA Goddard Space Flight Center, “Aqua Status Report,” Tech. Rep., 2014. [Online]. Available: http: //aqua.nasa.gov/AquaStatus September2014.pdf/ [13] National Aeronautics and Space Administration, “Space
Network Users’ Guide,” Tech. Rep., 2007.
[14] ——, “LCRD Overview for IOAG,” Tech. Rep., 2012.
[15] P. A. e. a. Rosen, “The proposed DESDynI mission-from science to implementation.” IEEE, 2011.
B
IOGRAPHY[
Marc Sanchez Net is currently a second year M.S. student in the department of Aeronautics and Astronautics at MIT. His research interests include machine learning algorithms and rule-based ex-pert systems, and their suitability to the fields of system engineering and space communication networks. Prior to his work at MIT, Marc interned at Sener Ingenieria y Sistemas as a part of the team that develops and maintains FORAN, a CAD/CAM/CAE commercial software for shipbuilding. Marc received his degrees in both Industrial engineering and Telecommunica-tions engineering in 2012 from Universitat Politecnica de Catalunya, Barcelona.
I ˜nigo del Portillo is a graduate student in the department of Aeronautics and As-tronautics at MIT. His research interests include dynamics of fractionated satel-lite system and small satelsatel-lites commu-nications. Inigo received his degrees in Industrial Engineering, Electronics gineering and Telecommunications En-gineering in 2014 from Universitat Po-litecnica de Catalunya, Barcelona.
Dr. Bruce Cameron is a Lecturer
in Engineering Systems at MIT and a consultant on platform strategies. At MIT, Dr. Cameron ran the MIT Com-monality study, a 16 firm investigation of platforming returns. Dr. Cameron’s current clients include Fortune 500 firms in high tech, aerospace, transportation, and consumer goods. Prior to MIT, Bruce worked as an engagement man-ager at a management consultancy and as a system engineer at MDA Space Systems, and has built hardware currently in orbit. Dr. Cameron received his undergraduate degree from the University of Toronto, and graduate degrees from MIT.
Dr. Edward F. Crawley received an Sc.D. in Aerospace Structures from MIT in 1981. His early research interests centered on structural dynamics, aeroe-lasticity, and the development of actively controlled and intelligent structures. Re-cently, Dr. Crawleys research has fo-cused on the domain of the architecture and design of complex systems. From 1996 to 2003 he served as the Depart-ment Head of Aeronautics and Astronautics at MIT, leading the strategic realignment of the department. Dr. Crawley is a Fellow of the AIAA and the Royal Aeronautical Society (UK), and is a member of three national academies of engineering. He is the author of numerous journal publications in the AIAA Journal, the ASME Journal, the Journal of Composite Materials, and Acta Astronautica. He received the NASA Public Service Medal. Recently, Prof Crawley was one of
the ten members of the presidential committee led by Norman Augustine to study the future of human spaceflight in the US.