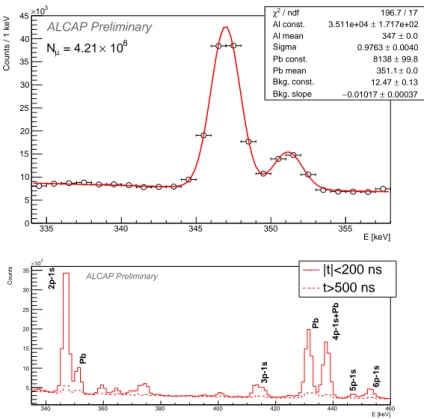
Status of the AlCap experiment
Texte intégral
Figure


Documents relatifs
PSD of the emitted aerosol particles during the abrasion of weathered (c) uncoated reference sample (t= 120 s to 720 s) (d) nanocoated samples (corresponding to the phase during
les systèmes autonomes ou hors réseau : L’intérêt porté aux énergies renouvelables nous a amené à nous intéresser aux systèmes photovoltaïques comme production
All spectra are compatible with the high-energy diffuse emission of the inner Galaxy observed by Fermi-LAT, the ionization rate of diffuse clouds, and recent satellite and balloon
From this telescope we can select the elastic scattering spot in the identification map, then, knowing the Rutherford cross section and extracting the number of counts in the spot,
This scheme leads to a number of questions: i) will multiple scattering in the target increase the emittance so much that cooling of the protons should be necessary? ii) the
But for the polyethylene target of 100 pm in thickness symmetric expansion on the rear and front side was not observed, although the pt of the target was kept the same value with
indicates that the more ionic the bond, the weaker are the satellites (Fig.2): though KF is a quite ionic solid, the satellite intensity of K Ka is weak.. We must note here that
Important parameters to be considered involve the lattice match- ing between two adjacent phases, the entropy related to the atomic structure of a n inter-