[Articles]
Journal of Educational Psychology Issue: Volume 107(1), February 2015, p 47-63
Copyright: (C) 2015 by the American Psychological Association Publication Type: [Articles]
DOI: 10.1037/a0037142 ISSN: 0022-0663
Accession: 00004760-201502000-00006
Keywords: imagination, imagery, multimedia learning, learning strategy Hide Cover
An Imagination Effect in Learning From Scientific Text
Leopold, Claudia1; Mayer, Richard E.2Author Information
1Institute for Psychology in Education, University of Muenster
2Department of Psychological and Brain Sciences, University of California, Santa Barbara
This research was supported by a fellowship of the German Research Foundation granted to Claudia Leopold.
Claudia Leopold, Institute for Psychology in Education, University of Muenster, 48149 Muenster, Germany.
Received July 22, 2013 Revision received May 1, 2014 Accepted May 3, 2014
Abstract
Asking students to imagine the spatial arrangement of the elements in a scientific text constitutes a learning strategy intended to foster deep processing of the instructional material. Two experiments investigated the effects of mental imagery prompts on learning from scientific text. Students read a computer-based text on the human respiratory system (control group), read while being asked to form an image corresponding to each of 9 paragraphs (imagery group), or read while being asked to form an image and with seeing an onscreen drawing before each paragraph (picture-before-imagery group) or after each paragraph (picture-after-imagery group). Imagery prompts facilitated transfer and retention performance compared to a control group on an immediate test (Experiment 1: d = 1.30 on transfer, d = 0.74 on retention) and on a delayed test (Experiment 2: d = 0.86 on transfer, d = 0.98 on retention), but the added drawings had no additional effect. The findings support the imagination principle, which states that people learn more deeply when prompted to form images depicting the spatial arrangement of what they are reading.
Consider a text that explains how the respiratory system works, such as shown in Appendix A. What can be done to help students learn more deeply so that they are better able to answer transfer questions based on the lesson? One approach is to add graphics, such as a graphic for each paragraph that depicts the structure or functioning of a portion of the respiratory system as described in the paragraph. The rationale for this approach comes from research on the multimedia principle, which has shown that students learn more deeply from words and graphics than from words alone (Butcher, 2014; Mayer, 2009). For example, Mayer (2009) reported that across more than a dozen experimental comparisons, students performed better on a transfer test after reading a scientific passage accompanied by corresponding graphics (e.g., drawings or animation) than without graphics, yielding a median effect size greater than 1.
The explanation for the multimedia principle is that students given words and graphics are more likely to engage in appropriate cognitive processing during learning, including selecting corresponding information in the text and graphics, organizing this information into corresponding cognitive representations, and integrating the verbal and pictorial representations with each other and with relevant prior knowledge (Mayer, 2009). In his dual coding theory, Paivio (1986, 2007) pointed to the positive cognitive
consequences that occur when learners make referential connections between words and images during learning. Similarly, the cognitive theory of multimedia learning posits that building connections between corresponding verbal and pictorial representations is a central process in meaningful learning, as indicated by superior transfer performance.
The present study takes the multimedia principle one step further by asking whether students can learn more deeply by imagining the spatial arrangement of elements described in a scientific text about how the respiratory system works. We call this process seeing with the mind's eye because the students engage in multimedia learning by imagining internal graphics rather than viewing external graphics. The goal of the present study is to determine the cognitive consequences of asking students to imagine graphics that depict the structure and functioning of the respiratory system being described in the text. Overall, we aim to test what can be called the imagination principle, which posits that students learn more deeply from an explanative scientific text when they are asked to form mental images corresponding to the structures and processes described in the text. The present study is motivated by the relative lack of research on the imagination principle as an aid to understanding explanative text (Dunlosky, Rawson, Marsh, Nathan, & Willingham, 2013).
Literature Review
This study on the imagination principle is motivated in part by recognition that the potentially powerful role of mental imagery in human learning, memory, and cognition has been examined across a variety of research literatures including spatial cognition, verbal learning, memory mnemonics, and educational psychology.
In spatial cognition, a number of studies have examined basic characteristics and functions of mental imagery (Farah, 1984; Ganis, Thompson, & Kosslyn, 2004; Johansson, Holsanova, & Holmqvist, 2006;
Shepard & Cooper, 1982). An important finding from these studies is that the cognitive processing of imagined representations follows similar mechanisms as the cognitive processing of perceived
representations (Borst & Kosslyn, 2012; Finke, 1985; Kosslyn, Thompson, & Ganis, 2006). Thus, there is a functional equivalence between visual mental imagery and visual perception. This functional equivalence refers, for example, to how people inspect and rotate mental images (Kosslyn, Ball, & Reiser, 1978;
Shepard & Metzler, 1971) and indicates that the underlying representations for these imagery processes are depictive and spatial in nature.
In verbal learning, studies conducted by Paivio (1986) and his coworkers showed that mental imagery enhances recall performance on basic memory tasks such as remembering word lists. An important finding is the concreteness effect, in which people remember lists of concrete words or sentences better than lists of abstract words or sentences (see Paivio, 1965, 1969, for a review; Sadoski, Goetz, & Fritz, 1993). Sadoski, Goetz, and Rodriguez (2000) and Goolsby and Sadoski (2013) reported similar findings for concrete versus abstract texts. Paivio explained these results with the idea that concrete words and sentences evoked imagery processes that aided their recall. This interpretation is supported by the results of Sadoski and Quast (1990), who found close relations between students' imagery ratings of text
passages and their long-term recall (r = .40). Furthermore, Paivio and his colleagues reported that an instruction to imagine lists of concrete nouns versus an instruction to pronounce these nouns improved recall probability by about 50% (Paivio, 1975; Paivio & Csapo, 1973). Both of these findings can be explained by Paivio's dual coding theory, which posits that adding a nonverbal imaginal code to a verbal code serves as a supplementary route for facilitating recall (see also Sadoski & Paivio, 2013).
In memory mnemonics (e.g., keyword method, method of loci), the idea of dual coding is applied to facilitate recall of vocabulary items (Atkinson, 1975; Raugh & Atkinson, 1975), technical terminology and foreign words (Carney & Levin, 1998; Jones, Levin, Levin, & Beitzel, 2000), and facts (Brigham & Brigham, 1998; Levin, Morrison, McGivern, Mastropieri, & Scruggs, 1986; McCormick, Levin, & Valkenaar, 1990). These mnemonic techniques have in common that they rely on imagery processes in order to establish, for example, referential connections between a vocabulary item (e.g., the German word Fenster = window) and an acoustic associative that is similar in sound (e.g., faint). An example is a mental image of a person standing before a window and suddenly fainting so that he or she is falling into the window. According to
Paivio (1986), these kinds of images help students to build connections between verbal and nonverbal (imagery) representations.
In educational psychology, two branches of research on mental imagery can be identified, focusing on the role of imagination in learning procedures and in learning facts. In the first research branch, focusing on memory for procedures, researchers have established an imagination effect when students imagine their actions as they learn a procedural task. For example, students were asked to imagine the steps of a procedure for how to construct formulae in a spreadsheet application (Cooper, Tindall-Ford, Chandler, & Sweller, 2001), how to apply geometry rules (Ginns, Chandler, & Sweller, 2003), how to find a route in a bus timetable (Leahy & Sweller, 2005), or how to use a temperature line graph (Leahy & Sweller, 2005). Overall, instructions to form mental images in these experiments facilitated learning the various procedural tasks when the students had sufficient prerequisite schemas about the task. The authors explained this effect with the idea that imagination requires learners to automatize the procedures similar to mental practice in perceptual-motor tasks frequently investigated in sports psychology (Driskell, Copper, & Moran, 1994). As this type of imagery strategy is focused on facilitating automation of procedures, it corresponds to an imagery rehearsal strategy.
In the second branch of research, focusing on memory for facts, research established an imagination effect when students were asked to imagine pictures in their mind corresponding to facts in a narrative. For example, in a classic study, Pressley (1976) taught elementary school children in a 20-minute training how to form mental images and asked them afterward to read a 950-word story with the instruction to make up pictures in their head as they read. Students in the control group received a control training in which they were asked to do whatever they could in order to remember the story. The results showed that students in the imagery group remembered more facts about the story than the students in the control group. Similar results were reported by Gambrell and Jawitz (1993) with fourth-grade students, by Kulhavy and Swenson (1975) with sixth-grade children, and by Giesen and Peeck (1984) and Rasco, Tennyson, and Boutwell (1975, Experiment 1) with college students.
In contrast, Anderson and Kulhavy (1972) and Rasco et al. (1975, Experiment 2) showed no effect of an imagery instruction on text recall, but Anderson and Kulhavy found that students who actually reported using the imagery strategy performed better in a recall test than students who reported not using mental imagery. Thus, it seems important to provide clear and specific imagery instructions and to check whether the students really follow these instructions.
In general, these results suggest that imaging a picture while reading a story is a powerful strategy for fostering recall of facts. Furthermore, the results of Rasco et al. (1975) and Gambrell and Jawitz (1993)
showed that there was no difference between students who were asked to create mental pictures and students who were provided with external pictures. Thus, the same underlying processes may apply to both internally constructed images and externally presented images.
The present study extends the study of imagination effects involving procedural knowledge (by imagining carrying out steps in a procedure) and factual knowledge (by imagining mental pictures about a story) to an imagination effect involving conceptual knowledge (by forming an image of the spatial structure of a scientific system). Investigating the effects of imagination on conceptual knowledge is relevant because scientific texts often remain challenging for students (Best, Rowe, Ozuru, & McNamara, 2005; Graesser, 2007). VanLehn and colleagues (2007, Experiment 2), for example, found no learning gains from reading passages from a physics textbook compared to students who read nothing at all but just took the test.
Graesser (2007) pointed out that scientific or technical text is a challenge because students often lack relevant background knowledge and adequate reading strategies directed at facilitating deep
comprehension. To our knowledge, the present study is the first to examine whether imagination strategies can apply to the educationally relevant domain of learning how a conceptual system works, using problem-solving transfer as a dependent measure.
Theory and Predictions
According to the cognitive theory of multimedia learning, meaningful learning (as measured by transfer test performance) occurs when learners engage in appropriate cognitive processing during learning, including selecting relevant verbal and visual material from the lesson, mentally organizing it into verbal and pictorial representations, and integrating the representations with each other and with relevant prior knowledge activated from long-term memory. Prompts to imagine the spatial arrangement of elements in scientific text are intended to prime these processes in the same way that providing well-designed graphics creates a multimedia effect (Mayer, 2009).
One process that is crucial in both, in processing text with mental imagery and in processing text with corresponding pictures, is the integration of words and images, that is, creating referential connections between words and corresponding images. In mental imagery, the process of creating referential connections is essential because mental imagery cannot be applied without the learner drawing connections between words or phrases and their corresponding images (Sadoski & Paivio, 2013). This integration of words and images is a key ingredient in generative processing in the cognitive theory of multimedia learning; therefore, mental imagery can be considered a generative learning strategy (Mayer, 2009). Similarly, in learning with text and pictures, referential connections between words and
corresponding pictures are crucial for facilitating deeper understanding of the text content, that is, to transfer knowledge to new problems (Kester, Kirschner, & van Merrienboer, 2005; Mayer, 2009; Mayer, Steinhoff, Bower, & Mars, 1995). If creating referential connections is crucial for developing a deep understanding of the learning materials and if we take into account that referential connections are a key component of the imagination process, then imagery activities should improve transfer and retention test performance.
Furthermore, when students build images of the spatial relationships that are expressed in the text, these mental imagery activities can facilitate mental model building (Johnson-Laird, 1983). This spatial form of mental imagery promotes an internal representation that preserves topological relations between elements of a system and therefore structural equivalence with the referential system (Denis, 2008; Denis & Cocude, 1989). On the basis of this internal representation, students can derive structural knowledge about the major components of the system as well as dynamic knowledge about how the system works (Mayer & Gallini, 1990). This is consistent with the view that learners can build runnable mental models of a dynamic system (Hegarty, 2004). Mental imagery can therefore be called a model-focused strategy that should affect the students' ability to transfer their knowledge to new problems.
To our knowledge, there are no studies that directly test the effects of mental imagery in learning from explanative scientific text on transfer performance. Leutner, Leopold, and Sumfleth (2009) found an interaction between drawing instruction and imagery instruction in terms of imagery instruction facilitating comprehension in the absence of drawing instruction. However, the comprehension test required students to draw text-based inferences but did not include transfer questions. The results of Leopold, Sumfleth, and Leutner (2013) showed that student's self-reported mental imagery activities partly mediated the students' spatial representations about the text content, which in turn mediated transfer performance. These studies support the idea that imagery affected the students' spatial representations and deeper understanding, although this idea was not directly tested.
One problem that may affect the effectiveness of mental imagery concerns the quality of students' created images. Denis and Cocude (1992) observed that students had difficulties in constructing accurate mental images from a text that described the spatial outline of a fictive island. Denis (2008) related these
difficulties to two processes-construction and review processes. Constructing mental images is a sequential process in which students generate images and step by step add one image to the other. By contrast, reviewing mental images involves the activation of the whole image so that the image can be used for manipulation or comparison tasks. Although constructing and reviewing are dynamic processes that are intertwined, constructing is usually more important in the beginning of a learning phase, while reviewing is more important at the end of a learning phase (Denis, 2008). To support students in
constructing mental images, we presented external pictures before the students read and imagined each text paragraph. In this sense, the picture provides a scaffold for the imagery process (Eitel, Scheiter, Schuler, Nystrom, & Holmqvist, 2013). To support students in reviewing and uploading their mental images, we presented external pictures after the students read and imagined each text paragraph. The picture provided external feedback for their mental image.
The theoretical rationale for studying the imagination principle is the same as for the multimedia principle, that is, both principles are based on the idea that deeper learning occurs when learners engage in the act of building connections between corresponding words and pictures that describe how a system works. In the case of the multimedia principle, the pictures are provided by the instructor, but in the case of the imagination principle, the pictures are imagined by the learner (with guiding instructions). This integration of words and graphics is called generative processing in the cognitive theory of multimedia learning and is posited to lead to meaningful learning outcomes.
In the present study, students read an explanative scientific text on how the human respiratory system works (as shown in Appendix A) either with or without prompts to imagine (as shown in Appendix B). In addition, for some learners, pictures were provided as instructional support for the imagery process by presenting a picture before or after each text paragraph. Based on the cognitive theory of multimedia learning, we predicted that students who were asked to imagine corresponding graphics as they read an explanative science text would score higher on subsequent transfer tests than students who simply read the text (Prediction 1). We also expected that students who were provided with external pictures to support the imagery process would score higher on transfer tests than students who simply imagined the text on their own (Prediction 2).
Secondary predictions were that students who were asked to imagine would also show superior performance on retention of the key steps in the explanation and on drawing the key steps in the explanation as compared to students who simply read (Predictions 3 and 5). Finally, we expected that students who were provided with external pictures to support the imagery process would score higher on retention and drawing tests than students who simply imagined the text on their own (Predictions 4 and 6). In addition, as a preliminary step, we tested whether the treatment groups differed in time on task, self-reported motivation, perceived difficulty, and mental effort.
Experiment 1 tested these six predictions on an immediate test. Method
Participants and design.
The participants were 85 college students recruited from the psychology subject pool of the University of California, Santa Barbara. Their mean age was 19.09 years (SD = 1.14), and the percentage of female students was 64.3%. They scored low on a survey of prior knowledge (M = 3.28, SD = 2.07, based on a 13-point measure), and their mean score on a 10-point test of spatial ability was 4.16 (SD = 3.31). The study was based on a between-subjects design with four levels of imagery instruction (imagery group, picture-before-imagery group, picture-after-imagery group, and control group). Twenty students served in the imagery group, 22 in the picture-before-imagery group, 20 in the picture-after-imagery group, and 23 in the control group.
Materials.
The learning materials were computer based and consisted of four versions of a lesson on how the human respiratory system works adapted from a shorter lesson used by Mayer and Sims (1994). The text
contained 786 words and consisted of an introduction and nine paragraphs. We computed a readability score using the Flesch-Kincaid grade level formula as an indicator of text difficulty (Kincaid, Fishburne, Rogers, & Chissom, 1975). The readability score of the text was 9.9, which indicates that the text was appropriate for students from Grades 10 and higher and was thus appropriate for college students. The same text was used in all four versions and is reproduced in Appendix A. In all four versions, each paragraph was presented on a separate screen along with the following headings: (a) Structure of the Nervous System, (b) Steps in the Nervous System to Control Breathing, (c) Structure of the Thoracic Cavity, (d) Structure of the Airway System, (e) Process of Inhaling, (f) Structure of the Exchange System, (g) Structure of the Circulatory System, (h) Process of Exchanging, and (i) Process of Exhaling. Students clicked on a next button in order to move from one paragraph to the next paragraph. The presentations were developed using Macromedia Authorware 7.0.
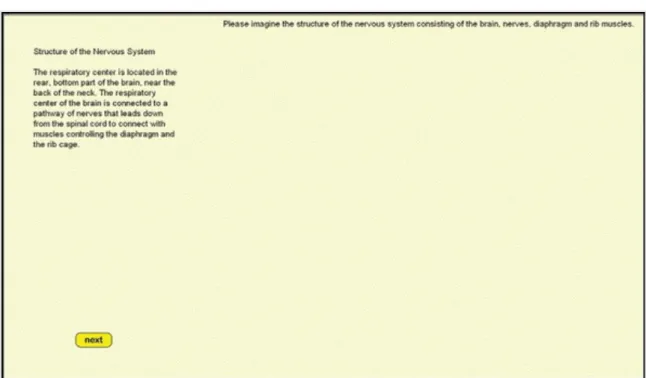
The control version of the lesson included just the text paragraphs with the next button presented below each paragraph, as exemplified in Figure 1. The imagery version was identical to the control version except that a specific imagery instruction was added to the right of each paragraph, for example, "Please imagine the steps in the nervous system when the brain sends a signal to the diaphragm and rib
muscles." Figure 2 shows a screenshot from the imagery version of the lesson. The imagination
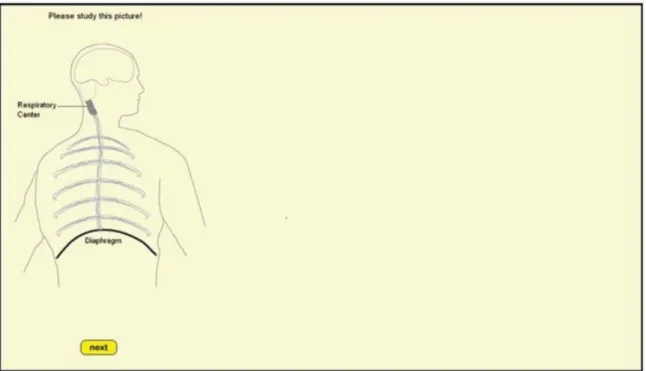
instructions for each of the nine paragraphs are listed in Appendix B. The picture-before-imagery version of the lesson was identical to the imagery version except that a drawing was presented before each paragraph. The drawing depicted the content of the following paragraph. In order to move from the picture to the corresponding paragraph, the students clicked on the next button. In order to move from this paragraph to the next picture, they clicked on the next button again, and so on. The students only saw either the picture or the paragraph, never both of them at the same time. Figure 3 shows a screenshot of a picture shown before a paragraph in the lesson. The picture-after-imagery version was identical to the picture-before-imagery version except that the corresponding picture was presented after the students had read and imagined the respective paragraph with the instruction: "Please compare this with your mental picture." Thus, students in the picture-after-imagery group first saw the paragraph with the imagery instruction, then clicked the next button and saw the corresponding picture. When they clicked on the
Figure 1. A screenshot of the program presented to the control group. See the online article for the color version of this figure.
Figure 2. A screenshot of the program presented to the imagery group. See the online article for the color version of this figure.
Figure 3. A screenshot of a picture shown to the picture-before-imagery group. See the online article for the color version of this figure.
The testing materials consisted of a retention test, a transfer test, a drawing test, a paper-folding test, and a questionnaire. The testing materials were printed on 8.5-in. x 11-in. sheets of paper.
The retention test contained the following instruction at the top of the sheet: "Using what you learned in the session, please write an explanation of how the human respiratory system works." For scoring the student's explanations, we divided the text into 35 idea units based on the paragraphs about the process of respiration and 41 idea units based on the paragraphs about the structure of the respiratory system. The headings for the paragraphs on the process of respiration were (a) Steps in the Nervous System to Control Breathing, (b) Process of Inhaling, (c) Process of Exchanging, and (d) Process of Exhaling. We computed a process-retention score for each student by counting the number of ideas (out of 35) that the student included in his or her explanation. One point was given for correctly stating each of the 35 idea units, for example, "brain detects the need for oxygen," "brain sends out a signal to inhale," "signal moves to muscles controlling the diaphragm or rib cage," "the diaphragm contracts downward," and "the rib cage moves slightly outward." The headings of the paragraphs about the structure of the respiratory system were (a) Structure of the Nervous System, (b) Structure of the Thoracic Cavity, (c) Structure of the Airway System, (d) Structure of the Exchange System, and (e) Structure of the Circulatory System. We computed a structure-retention score for each student by counting the number of ideas (out of 41) that the student included in his or her explanation. One point was given for correctly stating each of the 41 idea units, for example, "respiratory center is located in rear part of brain," "from brain nerves lead down the spinal cord," "nerves lead to muscles of the diaphragm and rib cage," "the thoracic cavity contains the lungs," "the thoracic cavity is surrounded by ribs," "ribs can move inward or outward," and "the diaphragm is on the bottom of the thoracic cavity." The participant did not have to show the exact
wording or correct spelling to receive credit for an idea unit but had to express the correct idea. All scoring was done by consensus between two raters who were blind to the participants' group. Separate scores for process and structure were computed in order to determine whether the effects of imagining helped students to visualize the static structure of the respiratory system and the dynamic functioning of the respiratory system. Interrater reliabilities based on 25% of the data were r = .93 for the process-retention test and r = .79 for the structure-retention test.
The transfer test consisted of five sheets, each containing a question that required the students to apply their knowledge to new problems, such as "Although there is oxygen in the lungs, the cells in the body do not get enough oxygen to make energy. What could have caused this problem?" or "Suppose you are a scientist who is trying to improve the human respiratory system for people who climb high mountains (where less oxygen is in the air). What could be done to make the human respiratory system more effective for mountain climbing?" We computed a transfer score for each participant by counting the number of acceptable answers across the five transfer questions (Cronbach's [alpha] = .66). The reliability of [alpha] = .66 is acceptable but a bit lower than expected, which may depend on the fact that only five transfer questions were used. Interrater reliability based on 25% of the data was r = .98. Acceptable answers for the first question were air cannot get into the air sacs, capillaries cannot pick up oxygen from the air sacs, the arteries are blocked, veins do not take away carbon dioxide, the connection between lungs and heart is blocked, blockage in the bronchioles, heart does not beat regularly, cells cannot absorb oxygen, and so on. Acceptable answers for the second question were expand the rib muscles, expand the diaphragm, expand the lung's capacity, change the regulation of the brain's system, absorb more oxygen with every breath, make the exchange system more effective, add air sacs in the lungs, add something that can bind more oxygen in the blood, add more channels of capillaries or arteries, and so on. The transfer test was intended to assess the learner's depth of understanding of the material and therefore is the primary learning outcome measure in this study.
The drawing test contained the following two instructions, each typed on a separate sheet: "Please draw a picture of the exchange system and label the different parts." "Please draw a picture of the respiratory system when the person inhales and label the different parts." These instructions referred to the representation of key components of the respiratory system explained in the text and their spatial relations. The students were informed that sketching the important components and their interrelations would be sufficient rather than drawing aesthetically appealing pictures. The accuracy of the exchange drawing was assessed using a checklist that consisted of seven criteria based on seven components of the exchange system and their spatial location, that is, the lungs, the alveoli, the capillaries, oxygen, carbon dioxide, arteries, and veins. The accuracy of the inhaling drawing was assessed using a checklist based on four criteria, that is, the windpipe-to-lung connection, expansion of lungs, flattening of the diaphragm, and expansion of ribs. An accurate drawing of each component was given 2 points, a partly accurate component was given 1 point, and an unacceptable drawing of a component received 0 points. For example when a student's drawing showed the diaphragm beneath the lungs and the student had indicated (by arrows or by labels) that the shape of the diaphragm was flattened, 2 points were given. When it was not obvious that the diaphragm was flattened, 1 point was given. When the diaphragm was drawn in the incorrect shape or when the diaphragm was not mentioned at all, 0 points were given. The maximal number of points was 22 for the two drawings (Cronbach's [alpha] = .72). Two raters scored 25% of the students' drawings with an interrater reliability of r = .95. The drawing test was intended to assess the quality of the student's self-generated visual-spatial representations of the respiratory system. The paper-folding test consisted of a sheet with 10 problems taken from Ekstrom, French, Harman, and Dermen (1976). Each item required imaging a paper being folded, punched with a hole, and reopened. One point was given for each correct answer, and one point was subtracted for each wrong answer, with a total possible score of 10. The paper-folding test was intended to measure an aspect of spatial ability that has been found to be related to mental imagery (Denis, 2008).
The first sheet of the questionnaire consisted of seven self-report scales on the students' motivation, their effort/difficulty, and strategy use. The motivation questions were "I enjoyed learning from this lesson," "I would like to learn from more lessons like this," and "Please rate how appealing this lesson was for you." Each was accompanied by a 5-point scale ranging from strongly agree to strongly disagree (Cronbach's [alpha] = .84). The effort and difficulty questions were "Please rate how difficult this lesson was for you" (with a 5-point scale from very easy to very difficult) and "Please rate how much effort you exerted in learning this lesson" (with a 5-point scale ranging from very low to very high). The final two questions were "Please rate your spatial ability" (with a 5-point scale from very low to very high) and "I prefer to learn visually" (with a 5-point scale from strongly agree to strongly disagree).
The second sheet consisted of a four-item self-report questionnaire on mental imagery and six distractor items. The four items were translated from a version used by Leopold et al. (2013) and were used to check whether students followed the instructions during the study phase (with Cronbach's [alpha] = .85). All self-report scales were 5-point scales ranging from 1 (strongly disagree) to 5 (strongly agree). The items were "I mentally imagined how the processes described in the text work," "I formed mental pictures about the text content in order to understand it," "I created mental pictures about the text content," and "I tried to understand the structures and processes of the respiratory system by mental imagery."
The final sheet of the questionnaire included questions concerning the students' age, gender, and prior knowledge about the human body. Their knowledge of the human body was measured by using a 13-item checklist. Students were asked to "place a check mark next to the things that apply to you," based on the following list: "I have participated in science programs or fairs," "Biology was my favorite subject in high school," "I sometimes watch science documentaries about anatomy in my free time," "I can name most of the components of the human heart from memory," "I have taken a course in human anatomy or
physiology," "I attended a course on cardiopulmonary resuscitation (CPR) training," "I can explain what pulmonary embolism means," "I sometimes find myself on the Internet looking up biology related topics," "I know the difference between venous and arterial blood," "I have watched an educational video on how the respiratory system works," "I talked to a doctor about how the process of respiration works," "I know the definition of the terms 'diastolic' and 'systolic'," and "I took advanced biology classes in high school (AP, IB, Honors), etc." A prior knowledge score was computed by tallying the number of items checked on the checklist, yielding a maximum score of 13.
Procedure.
Students were randomly assigned to the experimental groups and were tested in groups of one to three per session. Each student was seated at an individual cubicle in front of a computer. First, participants signed an informed-consent sheet. Then, the experimenter presented oral instructions stating that the students would receive a lesson on the human respiratory system that would comprise an introduction and nine paragraphs. They were told to go at their own pace and that when they were finished, the experimenter would have some questions for them to answer. Students pressed the space bar and then saw a page that welcomed them and thanked them for their participation in the experiment. This page repeated the instructions that they would read an introduction and nine paragraphs on the respiratory system and should click on the next button in order to move through the presentation. Furthermore, students in the three imagery groups were informed that first they would receive a short pretraining in how to use their mental imagination. This pretraining consisted of examples of how to imagine text content based on two text paragraphs about the global warming effect. The text in each paragraph was presented sentence by sentence. After reading the first sentence, students pressed the space bar and then saw how a possible image of that sentence would look. When they pressed the space bar again, the next sentence was presented, and after pressing the space bar again, the image was adapted to the content of the new sentence, and so on. On average students spent 95.87 s (SD = 39.62) on this pretraining of how to form mental images.
After the pretraining, the imagery groups were presented with a page that told them that now they would receive the lesson on the human respiratory system and that they were asked to imagine the text as a graphic. The students in the picture-before-imagery group were informed that in order to help them to imagine the information, they would be shown a drawing before each paragraph. The students in the picture-after-imagery group were informed that in order to help them, they would be shown a drawing after they had imagined the paragraph so that they could compare their mental picture with the presented drawing. The students then studied the respective version of the presentation on the respiratory system according to their experimental group.
When the presentation was finished, the experimenter presented instructions for the paper-folding test, and then, the students were given the paper-folding test for 3 minutes. After 3 minutes, the experimenter collected the paper-folding test and distributed the retention sheet, which asked the students to write an explanation of how the human respiratory system works. After 5 minutes, the retention sheet was
collected, and the transfer sheets were presented one at a time. Students were given 2.5 minutes for each transfer question. Each transfer sheet was collected by the experimenter before the next sheet was presented. Afterward, the two sheets of the drawing test were distributed one at a time. Students were asked (a) to draw a picture of the exchange system and label the different parts and (b) to draw a picture of the respiratory system when the person inhales and to label the different parts. Students were told that their picture did not have to be beautiful but could be simple and should depict the important parts. Two and a half minutes were given for each of the drawing tasks. Then, the experimenter distributed each sheet of the questionnaire, with instructions to answer as honestly as possible and to complete the questionnaire at their own rate. Upon completion, participants were thanked and excused. We followed guidelines for ethical treatment of human subjects.
Results and Discussion
We computed analyses of variance to test overall differences among the experimental groups. To test predictions requiring a comparison of the three treatment means with the mean of the control group, we used Dunnett tests. Dunnett tests control the familywise Type I error rate at 5% and is at the same time a powerful test specifically designed to compare each treatment with a control (Klockars & Sax, 1986;
Sheskin, 2011). To test predictions requiring comparisons between the picture-imagery groups and the imagery group, we used Bonferroni's correction as it is suitable for a small number of comparisons and can be transferred to nonorthogonal comparisons.
Before testing the effects of the imagery instructions on the dependent variables, we examined whether the four treatment groups were equivalent on basic characteristics and whether the groups followed their particular instruction.
Are the groups equivalent on basic characteristics?.
Analyses of variance (with p < .05) showed that the groups did not differ on prior knowledge, spatial ability, age, their self-rated spatial ability, and their preference for learning visually. A chi-square analysis revealed there was a difference in the proportion of males and females.1
In the self-report questionnaire, we asked the students whether they really had imagined the text content. The top line of Table 1 shows the mean imagery score (and standard deviation) for each group, with higher scores indicating higher degrees of imagery during learning. We used these data as a manipulation check. An analysis of variance revealed a significant effect of treatment, F(3, 81) = 4.25, MSE = .47, p = .008, [eta]2 = .14. Dunnett tests showed that the picture-before-imagery group (p = .053), the imagery group (p = .007), and the picture-after-imagery group (p = .012) each reported more mental imagery activity during learning than the control group did. We take this as evidence that the imagination prompts were
successful in promoting imagery during learning from the science text. Table 1 shows that the control group spontaneously reported imagining to a substantial degree, which can be explained by the fact that the text used concrete language, which has been shown to evoke mental images (see the review of
Sadoski & Paivio, 2013). Our results indicate that explicit strategy instruction enhanced this effect.
Table 1 Experiment 1: Means, Standard Deviations, and Effect Sizes for Self-Reported Mental Imagery, Motivation, Perceived Difficulty, and Mental Effort
Does imagery instruction facilitate transfer performance (Prediction 1)?.
The primary research question addressed in this study concerns whether students learn more deeply from a science text when they are prompted to form mental images of the respiratory system and how it works as they read. Based on the imagination hypothesis, students who form mental images of the system described in a science text should understand the material more deeply-through building connections between corresponding words and images-and therefore perform better on tests of problem-solving transfer. The top row of Table 2 presents the means (and standard deviations) of each group on the transfer test. An analysis of variance conducted on these data demonstrated a significant effect of treatment, F(3, 81) = 4.70, MSE = 15.30, p = .004, [eta]2 = .15. Dunnett tests showed that the imagery group outperformed the control group (p = .001), and there was no significant difference between the picture-before-imagery group and the control group (p = .098) or the picture-after-imagery group and the control group (p = .180). In line with our prediction, the superiority of the imagery group over the control group is new evidence for an imagination effect in which students learn more deeply when they are asked to form mental images of an explanative scientific text. This finding is a primary contribution of this study.
Table 2 Experiment 1: Means, Standard Deviations, and Effect Sizes for the Learning Outcome Variables Do the imagery groups that received drawings show better transfer performance than the pure imagery group (Prediction 2)?.
The means in the top row of Table 2 seem to indicate that the groups that received drawings and imagery prompts (i.e., picture-before-imagery and picture-after-imagery groups) showed lower scores in their transfer performance than the imagery group did. Planned comparisons revealed that the mean transfer score of the imagery group did not differ significantly from the picture-before-imagery group, t(81) = 1.66,
p = .200, or from the picture-after-imagery group, t(81) = 1.86, p = .134. As can be seen and contrary to
our predictions, providing drawings of the human respiratory system (in the picture-before-imagery group or picture-after-imagery group) does not add to the effectiveness of imagination prompts, perhaps because the students did not have to work as hard to mentally construct their illustrations. Does imagery instruction facilitate retention performance (Prediction3)?.
The foregoing analysis shows an imagination effect in which asking students to mentally create drawings for a science text results in improvements in transfer test performance, indicating deeper learning. A second research question concerns whether imagination prompts also help students better remember the structure and process of the system described in a scientific text. The second row of Table 2 shows each group's mean retention score (and standard deviation) for text describing the process of respiration, whereas the third row shows the mean retention scores (and standard deviations) for text describing the structure of the respiratory system. According to the imagination hypothesis, instructions to form mental images for the content of a scientific text should result in better memory for the process and structure of the system described in the text.
With regard to process-retention scores shown in the second line of Table 2, an analysis of variance revealed a significant overall effect of treatment, F(3, 81) = 3.35, MSE = 13.06, p = .023, [eta]2 = .11. To examine whether the three experimental groups who received an imagery instruction performed better than the control group did, we computed Dunnett tests. The results showed that the picture-before-imagery group (p = .042), the picture-before-imagery group (p = .052), and the picture-after-picture-before-imagery group (p = .02) each performed better than the control group did. With regard to structure-retention scores shown in the third line of Table 2, an analysis of variance revealed a significant overall effect of treatment, F(3, 81) = 5.14,
MSE = 4.60, p = .003, [eta]2 = .16. Dunnett tests showed that the imagery group significantly
outperformed the control group (p = .011), and there was no significant difference between the picture-before-imagery group and the control group (p = .873) or the picture-after-imagery group and the control group (p = .999). The mean scores in the structure-retention test were quite low and indicate a floor effect. The lower scores can be explained by the fact that the students were asked to write an explanation "of how the human respiratory system works." This task did not require the students to write down structure information but focused on process information.
Overall, the reported results provide additional support for the imagination hypothesis, in which students learn better when they form mental images about the structure and process of the system described in a science text as they read. One limitation of the results is that with gender as a covariate, the overall effect on process-retention scores did not remain significant.
Do the imagery groups who received drawings show better retention performance than the imagery group (Prediction 4)?.
We compared the picture-before-imagery group and the picture-after-imagery group with the imagery group, respectively. With regard to the process-retention score, neither the picture-before-imagery group nor the picture-after-imagery group significantly differed from the pure imagery group, t(81) < 1. With regard to the structure-retention score, the imagery group outperformed the picture-before-imagery group as well as the picture-after-imagery group, t(81) = 3.59, p = .002, and t(81) = 2.95, p = .008, respectively. Overall, contrary to our predictions, there is no indication that adding pictures enhances the effectiveness of imagination prompts.
The imagination hypothesis predicts that asking students to form images during learning will improve their performance on a drawing test. The fourth line in Table 2 shows the mean drawing score (and standard deviation) for each group. An analysis of variance conducted on the data summarized in the fourth line of
Table 2 demonstrated a significant effect of treatment, F(3, 81) = 5.48, MSE = 18.35, p = .002, [eta]2 = .17. Consistent with predictions, Dunnett tests showed that the picture-before-imagery group (p = .001), imagery group (p = .044), and picture-after-imagery group (p = .016) performed better than the control group did.
Do the imagery groups that received pictures show better drawing performance than the imagery group (Prediction 6)?.
Neither the picture-before-imagery group nor the picture-after-imagery group performed significantly better than the imagery group, t(81) = 1.32, p = .382, and t(81) < 1, respectively. Apparently, actually seeing a picture and simply imaging a picture based on a science text produced equivalent improvements on a subsequent drawing test. Contrary to our predictions but comparable to the results of the transfer and retention tests, adding pictures did not increase drawing performance.
Do the groups differ in time on task?.
The mean study times and standard deviations for each group are shown in Table 2. There was a significant difference among the treatment groups in study time, F(3, 81) = 4.31, p = .007, [eta]2 = .14. Dunnett tests showed that the picture-before-imagery group (p = .009) and the picture-after-imagery group (p = .008) spent more time with the presentation than the control group did, but the imagery group did not differ significantly from the control group (p = .226). To take into account the difference in study time, we computed analyses of covariance (ANCOVAs) with study time as a covariate and the
performance measures as dependent variables. The conclusions remain the same when we run an ANCOVA with time as the covariate. The results do not differ from the former analysis for the transfer score, F(3, 80) = 5.08, MSE = 15.27, p = .003, [eta]2 = .16; for the structure-retention score, F(3, 80) = 5.28, MSE = 4.61, p = .002, [eta]2 = .17; and for the drawing score, F(3, 80) = 5.06, MSE = 18.54, p = .003, [eta]2 = .17, except that the overall effect of the treatment on the process-retention score did not remain significant, F(3, 80) = 2.65, p = .055. The effect of the covariate time was in none of the analyses
significant (p > .149). There was also no significant interaction between the treatment and time on any of the performance measures (p > .200).
Do the students differ in their motivation, perceived difficulty, and mental effort scores?.
Table 1 summarizes the mean motivation rating and mental effort scores (and standard deviations) for each group. With regard to motivation, there was a significant effect for treatment, F(3, 81) = 2.88, MSE = .70, p = .041, [eta]2 = .10. Dunnett tests indicated that the picture-before-imagery group reported more enjoyment with the lesson than the control group did (p = .024), but the picture-after-imagery group and the imagery group did not differ from the control group (p = .131 and p = .809, respectively). With regard to the perceived difficulty of the lesson and the mental effort invested in studying the lesson, there were no differences among the experimental groups, Fs(3, 81) < 1. Overall, there is no strong evidence that students who received imagery prompts reported more difficulty or effort than the control group. Only the picture-before-imagery group reported more motivation than the control group did. However, self-report measures may not be the best way to assess these factors as they can be influenced by a tendency to choose socially approved behaviors, student ability, instruction, context of assessment, and so on (e.g.,
Kruger & Dunning, 1999). Behavioral measures such as the students' persistence in studying further text passages, physiological measures, or dual task paradigms might provide more reliable data (Brunken, Seufert, & Paas, 2010; DeLeeuw & Mayer, 2008).
Table 3 shows a correlation matrix for the four learning outcome measures, with significant correlations indicated in bold font. As can be seen, the transfer score correlates significantly with each of the other three scores, the drawing score correlates significantly with two other scores, the process-retention score correlates significantly with two other scores, and the structure-retention score correlates significantly with one other score. Overall, the transfer score appears to be the most inclusive, suggesting that it may be the best measure of deep learning. Consistent with results of other studies (Leopold et al., 2013;
Schwamborn, Mayer, Thillmann, Leopold, & Leutner, 2010), there is a high correlation between the drawing scores and the transfer and process-retention scores (r = .52, r = .53, respectively), indicating close connections between the quality of the spatial representation of the respiratory system and measures of deep learning.
Table 3 Correlations Among Transfer, Process-Retention, Structure-Retention, and Drawing Scores Does drawing performance mediate the effect of imagination activity on transfer performance?.
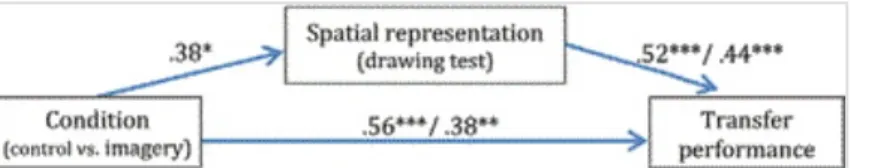
The results reported above showed that the imagery group performed better on tests of problem-solving transfer than the control group. We expected that the effect of condition (control vs. imagery) on transfer performance would be mediated by the quality of the students' internal spatial representations of the respiration process assessed by their drawing performance. This mediation hypothesis is based on the idea that mental imagery instruction promotes an internal spatial representation that preserves structural equivalence with the referential system and therefore facilitates transfer. Following the procedure proposed by Baron and Kenny (1986), we performed simple and multiple regression analyses. First, we computed the direct effect of the independent variable condition (code 1 = control, code 2 = mental imagery) on the dependent variable (transfer performance): [beta] = .56, p < .001 (see Figure 4). Second, we tested whether the independent variable (condition) affects the mediating variable (spatial
representation): [beta] = .38, p = .013; third, we tested whether the mediating variable (spatial
representation) affects transfer performance: [beta] = .52, p < .001. Multiple regression analysis revealed that the direct effect of condition on transfer performance was reduced when the effect of the mediating variable was controlled: [beta] = .38, p = .003. To test whether the indirect effect, that is, the path from the independent variable condition via the mediating variable spatial representation, on transfer test
performance is significant, we conducted the Sobel test (Sobel, 1982; see also MacKinnon, Lockwood, Hoffman, West, & Sheets, 2002). The indirect effect ([beta] = .38 x .52 = .20) was significant (z = 2.16, p = .031). Thus, condition (i.e., imagery instructions) influenced transfer performance by affecting the
students' spatial representations, which in turn affected their transfer performance. These results support partial mediation of the effect of condition on transfer performance via the quality of the students' spatial representations of the respiration process.
Figure 4. Mediation model in Experiment 1. * p < .05. ** p < .01. *** p < .001. See the online article for the color version of this figure.
In Experiment 1, the main result was that mental imagery prompts facilitate transfer performance. In Experiment 2, we focused on examining whether the imagination effect is stable over a time delay. Therefore, we included only an imagery group and a control group. According to multimedia theory and dual coding theory, when learners build connections between text and a mental image, they construct a deeper learning outcome with more retrieval routes, which should enhance performance over a time delay. Previous research on learning strategies further suggests that a particularly useful measure of the
effectiveness of learning strategies involves performance on a delayed test of retention or transfer (Dunlosky et al., 2013), so in the interests of consistency, we sought to determine whether the findings of Experiment 1 could be replicated after a 2-day delay.
Method
Participants and design.
The participants were 48 college students recruited from the paid psychology subject pool at the University of California, Santa Barbara. Their mean age was 19.73 years (SD = 1.38), and the percentage of female students was 77.1%. They scored low on a survey of prior knowledge (M = 3.04, SD = 2.62, based on a 13-point measure), and their mean score on a 10-point test of spatial ability was 5.42 (SD = 3.59). The study was based on a between-subjects design with two of the experimental conditions used in Experiment 1: imagery group and control group. Twenty-three students served in the imagery group, and 25 served in the control group. These conditions were identical to the ones used in Experiment 1 except that we did not immediately test their retention, transfer, and drawing performance but rather tested them after a delay of 2 days. Two students did not return for the second part of the study, so we excluded their data.
Materials.
The learning and testing materials were identical to the ones used in Experiment 1 except that two experimental conditions instead of four were implemented. The reliability (Cronbach's alpha) of the scales was very similar to the ones reported in Experiment 1: [alpha] = .72 for the transfer test, [alpha] = .75 for the drawing test, [alpha] = .91 for self-reported imagery, and [alpha] = .83 for self-reported motivation. Procedure.
The procedure was identical to that used in Experiment 1 except that the study consisted of two parts. In the first part, the students studied the presentation on how the human respiratory system works and filled in the paper-folding test. Then, the students were dismissed and asked to come back after 2 days. Students were told not to study anything about the human respiratory system during the 2-day delay. In the second part of the study, the students completed the retention test, the transfer test, the drawing test, and the questionnaire as in Experiment 1. The tests were scored with the same procedures used in Experiment 1.
Results and Discussion
Are the groups equivalent on basic characteristics?.
Analyses of variance or chi-square tests (with p < .05) showed that the groups did not differ on prior knowledge score, spatial ability, self-rated spatial ability, preference for learning visually, mean age, or proportion of males and females.
Did the students follow the instructions?.
The top line of Table 4 shows the mean imagery score (and standard deviation) for both groups. The analysis of the students' answers on the questionnaire reveals that the students in the imagery group reported more mental imagery activity than the students in the control group did, t(46) = 3.55, p = .001, d = 1.08. We take this as evidence that the imagery group followed the imagery prompts during learning
Table 4 Experiment 2: Means, Standard Deviations, and Effect Sizes for Self-Reported Mental Imagery, Motivation, Perceived Difficulty, and Mental Effort
Does imagery instruction facilitate transfer performance (Prediction 1)?.
We hypothesized that students who form mental images of the system described in the science text should understand the material more deeply-and therefore perform better on tests of problem-solving transfer. The top row of Table 5 presents the means (and standard deviations) of the two groups on the transfer test. A t test revealed a significant difference among the groups, t(46) = 2.93, p = .005, d = .86, with the imagery group scoring higher than the control group. Thus, the imagery prompts facilitated problem-solving transfer compared to a control condition, even after a delay of 2 days.
Table 5 Experiment 2: Means, Standard Deviations, and Effect Sizes for the Learning Outcome Variables Does imagery instruction facilitate retention performance (Prediction 3)?.
The second and third rows of Table 5 show the mean retention scores (and standard deviations) of the two groups. There was a significant effect of treatment on the process-retention score, t(46) = 3.40, p = .001, d = .98, and a nonsignificant marginal effect on the structure-retention score, t(46) = 1.73, p = .092, d = .50, with the imagery group scoring higher than the control group. Thus, imagery prompts facilitated retention of process information compared to a control condition even after a delay of 2 days.
Does imagery instruction facilitate drawing performance (Prediction 5)?.
The fourth line in Table 5 shows the mean drawing score (and standard deviation) for each group. There was a significant effect of treatment on the drawing score, t(46) = 3.27, p = .002, d = .95, with the imagery group performing better than the control group.
Table 5 shows the mean study times and standard deviations for the two groups. There was a significant difference between the groups in study time, t(46) = 2.99, p = .004, d = .89, in which the imagery group spent longer with the presentation than the control group did. Therefore, we included study time as a covariate and computed ANCOVAs with the performance measures as dependent variables. For the transfer score, F(1, 45) = 5.83, MSE = 18.11, p = .020; process-retention score, F(1, 45) = 9.39, MSE = 14.77, p = .004; and drawing score, F(1, 45) = 7.20, p = .010, the results did not change; for the structure-retention score, there no longer was a marginally significant effect when study time was included as a covariate, F(1, 45) = 2.64, p = .111. The effect of the covariate time was in none of the analyses significant. There was also no significant interaction between the treatment and time on any of the performance measures (all Fs < 1).
Do the students differ in their motivation and mental effort scores?.
Table 4 shows the mean ratings (and standard deviations) on motivation, perceived difficulty, and mental effort for the two groups. With regard to motivation, there was a significant difference between the groups,
t(46) = 2.29, p = .026, d = .66, in which the imagery group reported more enjoyment with the lesson than
the control group did. This result is in line with Sadoski and Quast (1990; see also Sadoski & Paivio, 2013), who reported associations between affective factors and mental imagery activity.
With regard to perceived difficulty and mental effort, there were no significant differences between the groups, t(46) < 1, and t(45) = 1.61, p = .114. These findings are consistent with Experiment 1.
How do the four learning outcome measures relate to one another?.
Table 6 shows a correlation matrix for the four learning outcome measures, with significant correlations indicated in bold font. Similarly to Experiment 1, the transfer score correlates significantly with each of the other three scores. This also applies for the drawing score, while the process-retention and structure-retention scores each correlate significantly with two other scores. There are strong correlations between the drawing score and the transfer score, as was found in Experiment 1. Overall, these results are very consistent with those of Experiment 1.
Table 6 Experiment 2: Correlations Among Transfer, Process-Retention, Structure-Retention, and Drawing Scores Does drawing performance mediate the effect of imagination activity on transfer performance?.
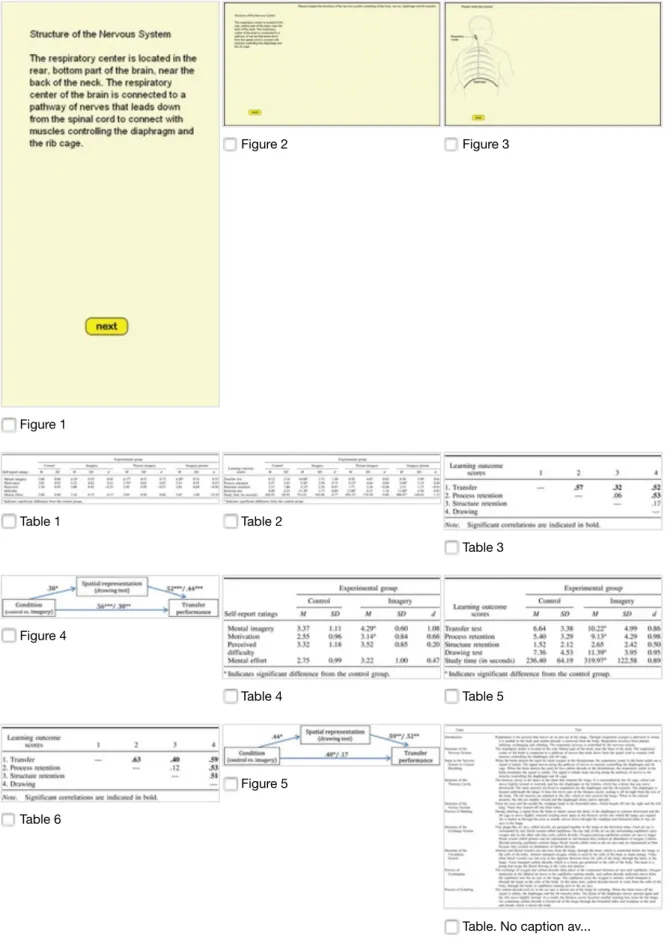
As in Experiment 1, we expected that the effect of condition (control vs. imagery) on transfer performance would be mediated by the quality of the students' internal spatial representations of the respiration process. Simple regression analyses demonstrated that condition (independent variable) significantly affected transfer performance ([beta] = .40, p < .003) and the mediating variable spatial representation ([beta] = .44, p = .002; see Figure 5). Also, the mediating variable spatial representation predicted transfer performance ([beta] = .59, p < .001). Furthermore, multiple regression analysis revealed that the direct effect of condition on transfer performance was no longer significant when the effect of the mediating variable was controlled ([beta] = .17, p = .199), whereas the effect of the mediating variable spatial representation was significant ([beta] = .52, p < .001). These results indicate full mediation of the effect of condition on transfer performance via students' spatial representations.
Figure 5. Mediation model in Experiment 2. * p < .01. ** p < .001. See the online article for the color version of this figure.
General Discussion
Empirical ContributionsThis study's primary empirical contribution is that prompts and instruction to imagine the process of respiration and the structure of the respiratory system while reading an explanative text on how human respiration works facilitate transfer and retention performance on immediate and delayed tests. These results extend previous findings concerning rote memory of words or facts by demonstrating that mental imagery can also affect deeper understanding of explanative text, as shown in superior transfer
performance.
A secondary finding is that adding external pictures-presented either before or after imagining the relevant text paragraph-did not add any benefits beyond simply imagining. For example, on the transfer test, the imagery group outperformed the control group, but the picture-before-imagery and picture-after-imagery groups did not. On the structure-retention test, the imagery group outperformed the control group and outperformed the picture-before-imagery group and the picture-after-imagery group. Overall, the results of Experiment 1 indicate the pictures did not enhance the imagery process as was proposed but in some cases actually weakened it-and this pattern was similar for both of the imagery-and-picture groups, providing evidence for the consistency of the results.
How can these results be explained? The text consisted of nine paragraphs, and each was accompanied by a picture. The students of the picture-before- and picture-after-imagery groups may have relied on the external presentation of the picture rather than on investing effort in creating their own internal picture of the text content. The students of the picture-before imagery group may have focused on the external presentation of the picture rather than on creating an internal picture of the text content. Similarly, the students in the picture-after-imagery group knew that a picture was being presented after each paragraph. In anticipating that a picture would be shown, they may have decided not to put too much effort in the imagination process but rather rely on the external picture. In both cases, processing the external pictures would draw resources away from the mental imagery process. Students might have primarily focused on processing features of the pictures that were not useful in building a dynamic mental representation. Processing the external pictures could also have imposed high cognitive load on the learner because the learner had to mentally hold the pictorial representation in his or her working memory in order to integrate it with the textual input (van Merrienboer & Ayres, 2005). Mental imagery without external pictures, however, seems to foster deeper processing of the text content, presumably because the students connected words and their corresponding images and relied on these images when constructing a coherent runnable model of the respiratory system. A similar result was reported by Schworm and Renkl (2006), who found that self-explanation prompts were less effective when instructor explanations were available than when they were not available, presumably because the learners relied upon the instructor explanations rather than investing effort in self-explanations. More research is necessary to disentangle the effects of external representations, such as pictures, and the strategic processes of the learner, such as mental imagery.
Third, the positive effect of mental imagination not only was found on an immediate test but was replicated on a delayed test that was administered 2 days after the study phase. This result is consistent with the findings of Sadoski and Quast (1990), who found close relations between mental imagery ratings and text recall after a delay of 16 days.
It is further noteworthy that the results of the second experiment were highly consistent with the ones of the first experiment. Similar to the first experiment, the imagery group showed better performance than the control group in transfer, retention, and drawing scores, and moreover, the students' transfer and drawing scores were strongly related, with r = .52 in Experiment 1 and with r = .59 in Experiment 2. In line with these results, mediation analyses indicated that students' performance in the drawing test mediated the effect of imagery instruction on transfer performance in Experiments 1 and 2. These results confirm the idea that mental imagination fosters deep processing of the text content that contributes to the durability of these effects. Overall, the fact that the imagination effect can be demonstrated on both an immediate test and a delayed test and on measures of transfer, retention, and drawing points to its robustness. The strong effect sizes (many above d = 0.80) point to its practical importance. Theoretical Implications
The results are consistent with the idea that the act of imagining the spatial relations among elements described in an explanative text can prime generative learning processes-including selecting relevant elements, organizing them into a coherent structure, and relating them to relevant prior knowledge. The act of imagining, when accomplished successfully, can help students build what Paivio (1986) called referential connections between corresponding words and images, similar to multimedia learning with presented drawings (Mayer, 2009). The positive effects of mental imagery on transfer performance suggest that classic theoretical concepts of mental imagery based on associative tasks (Paivio, 1986), mnemonic techniques (Atkinson, 1975), or recall of facts (Rasco et al., 1975) can be extended with respect to how mental imagery facilitates deep understanding of complex explanative scientific text.
Theories that explain the multimedia principle (Butcher, 2014; Mayer, 2009) provide one starting point because constructing internal pictures in conjunction with corresponding text leads to similar effects on retention and transfer performance as processing external pictures in conjunction with corresponding text. This indicates that the benefits of external pictures are transferrable to internal pictures (i.e., pictures created through the learner's imagination). When learning from text and external pictures, students select, organize, and integrate words and corresponding pictures. When imagining text content, students also select and organize words and transform these words into mental images of the text content. This requires the students to draw referential connections between words and corresponding images. This process is an intrinsic component of the imagination process because the strategy cannot be applied without the students creating connections between the text and their mental images. This verbal-visual connection may be a main benefit of the imagination strategy that contributes to enhanced transfer performance on immediate and delayed tests. This process is based on the dual coding approach described in detail by
Sadoski and Paivio (2013).
Theories of mental model building (Johnson-Laird, 1983) provide a second starting point because they specify the nature of the constructed representation. A mental model is a representation that preserves structural equivalence with the referential content. A mental model of the respiratory system therefore would represent the spatial relations among the components of the system and their interaction, for example, that the diaphragm is located beneath the lungs. When students imagine the structure and the functions of the respiratory components as described in the text, they are prompted to construct a representation that depicts the spatial relations of the system. This construction process is based on an interaction of information provided by the text and general knowledge such as existent models of the learner (Vandierendonck, Dierckx, & van der Beken, 2006).