Marjan Sedighi Gilani* and Francis W.M.R. Schwarze
Hygric properties of Norway spruce and sycamore
after incubation with two white rot fungi
Abstract: In this study, changes in the hygroscopic proper-ties of two main wood species for violin making, Norway spruce and sycamore, after treatment with Physisporinus vitreus and Xylaria longipes were investigated. Swelling and moisture sorption capacity of wood at the growth ring scale were visually and quantitatively assessed by thermal neutron radiography analysis. It was demonstrated that the fungal treatment improved the dimensional stability of both Norway spruce and sycamore, but also increased their moisture adsorption capacity. Dynamic vapor sorp-tion tests and measurements of the changes in dimen-sions of the specimens in the laboratory were in good agreement with the results of neutron radiography analy-sis. The main difference between the moisture sorption of the untreated controls and treated wood was observed at high relative humidity, e.g., above 75%. The contradic-tory behavior of the increased hygroscopicity and reduced swelling was explained by selective degradation of the chemical components and condensation of the moisture content gained in the capillary voids that developed in the cell walls during fungal decay.
Keywords: dimensional stability, dynamic moisture sorp-tion, neutron radiography, Physisporinus vitreus, resonance wood, violin making, wood decay fungi, Xylaria longipes
DOI 10.1515/hf-2013-0247
Received December 19, 2013; accepted March 31, 2014; previously published online April 30, 2014
Introduction
Treatment with white rot fungus Physisporinus vitreus (Pers.) P. Karst. and Xylaria longipes Nitschke improved the acoustic properties of wood resonance via selective
delignification of the cell walls, resulting in a reduction in density without significant alterations in the sound veloc-ity and mechanical properties (Schwarze et al. 2008). Phy-sisporinus vitreus also increases the liquid permeability of refractory wood species, mainly due to the preferential degradation of the pit membranes, a process known as bioincising (Schwarze 2007; Schwarze and Schubert 2011). Fungal treatment can lead to significant damage in the cell wall including the generation of small cavities (Lehringer et al. 2010). White rot fungi initially degraded lignin and hemicelluloses and later degraded cellulose (Martínez-Iñigo et al. 1999; Pandey and Pitman 2003; Ray et al. 2005; Schwarze 2007). Changes in the supramolecular architec-ture in the cell wall may entail a change of hygroscopicity and capacity of water adsorption (Kirk and Highley 1973).
The hygroscopicity in wood is studied by different techniques. Dynamic vapor sorption (DVS) is well suited for studying the sorption capacity and kinetics in native and modified wood (Hill et al. 2010, 2012; Xie et al. 2011). Optical and confocal laser scanning microscopy (CLSM) (Murata and Masuda 2001; Sakagami et al. 2007), environ-mental scanning electron microscopy (ESEM) (Gu et al. 2001; Ma and Rudolph 2006) and X-ray tomography (XRT) (Derome et al. 2010) are some characterization methods for in-situ studying of swelling or shrinkage in wood at the cellular level. Also, neutron radiography (NR) is better suited for quantitative moisture content (MC) estimation in wood than XRT (Zillig 2009) as it provides data with high resolution regarding water transport, even below the fiber saturation point (FSP) (Mannes et al. 2009; Sonde-regger et al. 2010; Sedighi Gilani et al. 2012).
The main objective of the present study was to improve the understanding of the impact of controlled decay on the hygroscopicity of Norway spruce and sycamore wood (Wspruce and Wsycamore) as materials for violin construction. The hypothesis was that changes in the arrangement of the molecules of lignin, hemicelluloses and cellulose in the modified cell walls with fungi will alter the sorptivity and consequently the dimensional stability of wood. The modified material was characterized by NR, with a reso-lution that allows early wood (EW) and late wood (LW) layers to be distinguished. Traditional test methods were also applied for comparison. The goal was to elucidate, the equilibrium and also the time resolved distribution
*Corresponding author: Marjan Sedighi Gilani, Applied Wood Laboratory, Swiss Federal Laboratories for Materials Science and Technology (Empa), Überlandstrasse 129, 8600 Dübendorf, Switzerland, e-mail: marjan.gilani@empa.ch
Francis W.M.R. Schwarze: Applied Wood Laboratory, Swiss Federal Laboratories for Materials Science and Technology (Empa), Lerchenfeldstrasse 5, CH-9014 St. Gallen, Switzerland
of adsorbed moisture and resulting swelling of untreated and modified wood with two species of wood decay fungi. The expectation was that the high resolution results con-cerning MC may contribute further improvement and standardization of the fungal modification processes for the treatment of wood resonance in musical instruments.
Materials and methods
Sample preparation and fungal incubation: 4 plates of 100 × 2.5 × 200 mm3 (R × T × L) were planed from Picea abies L., W
spruce
and 4 plates of the same dimensions from Acer pseudoplatanus L.,
Wsycamore planks. Material was from a tree with narrow annualular
rings, low LW fraction and low resin content, according to the criteria for quality resonance wood. Plates had no visible geometrical defects and were neighbors along the longitudinal direction. One plate from each species served as control and was climatized (20°C and 65% RH). The other three plates of Wspruce were incubated with P. vitreus
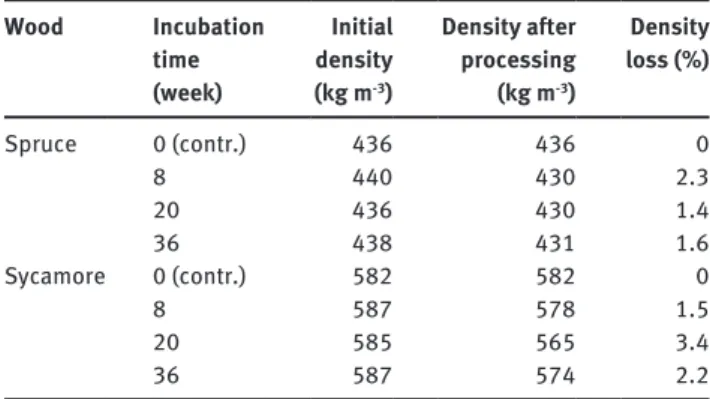
and the 3 Wsycamore with X. longipes, in different boxes, at 22°C and 70% RH according to the European Standard EN 113 (European Commit-tee for Standardization 1997). The experiments were stopped after 8, 20 and 36 weeks by sterilizing the wood with ethylene oxide. Table 1 shows the density data of the woods before and after fungal treatment in equilibrium at 65% RH.
After treatment, specimens of 20 × 2.5 × 20 mm3 (R × T × L) were
quarter-sawn from each plate. They were examined by X-ray
Relative humidity sensor
Controlled relative
humidity flow Outflow
Sample holders Wood samples x y z 20x2.5x20 mm3 Source Collimator Detector Sample x y z Detector Neutron beam direction Inflow Outflow Closing screws for the chamber lid
Relative humidity sensor
a
b
Figure 1 (a) Schematic overview of the neutron beamline and of the custom-made environmental chamber, (b) environmental chamber with open lid in the neutron imaging setup.
Table 1 Duration of fungal treatment and changes in wood density. Wood Incubation time (week) Initial density (kg m-3) Density after processing (kg m-3) Density loss (%) Spruce 0 (contr.) 436 436 0 8 440 430 2.3 20 436 430 1.4 36 438 431 1.6 Sycamore 0 (contr.) 582 582 0 8 587 578 1.5 20 585 565 3.4 36 587 574 2.2
cone-beam computer tomography (3D-CT), to verify the absence of artifacts due to preparation. All specimens were oven dried for a week at 50°C, and at 80°C for the last 2 h, and then stored in a dry desiccator over silica gel.
Experimental procedure in neutron imaging setup: NR was per-formed at the NEUtron Transmission RAdiography (NEUTRA) beam-line of the Paul Scherrer Institute (PSI), see Figure 1. The beambeam-line was fed by the Swiss Neutron Spallation Source (SINQ) and provides neutrons with a thermal spectrum, at an energy level of 25 meV (Leh-mann et al. 2001). The detector was of zinc sulfide containing 6 Li as neutron absorbing agent, with a thickness of 50 μm. The photons are led via a mirror onto a 16-bit CCD camera (2048 × 2048 pixels). The exposure time of NR was 34 s per image and the attained pixel size was in the magnitude of 44 μm/pixel.
The custom-made environmental chamber was an aluminum enclosure, with two windows made of thin high-purity aluminum plates in the front and back. Due to the low attenuation coefficient of aluminum (0.1 cm-1 compared to 3.44 cm-1 for hydrogen), the
inter-action of the aluminum plate with neutrons and the induced error in quantitative image analysis was minimal. RH in the chamber was controlled by means of a humidity generator device. The RH (set at the lowest value 2%) was measured by sensors inside the cham-ber and recorded. Specimens were installed, side by side, on two aluminum grip holders, and the width (L direction) and height (R direction) were positioned on xy-plane of image acquisition. After acquiring few initial images of the dry specimens, RH was rapidly elevated to 80%, which was maintained over a period of 8 h. During this time, NR were recorded each 10 min. As reference for quantita-tive analysis, the mass of specimens was measured at the beginning and end of each experiment.
Analysis of neutron images: NR was based on intensity meas-urements of a neutron beam transmitted through an object. MC (kg m-3)
at the time t can be calculated from:
dry MC( ) - ( )ln( ( ) / ) ( )(ln -ln ( ))dry t z I t I z I I t ρ ρ = ⋅Σ = ⋅Σ L L L L (1)
Where, ρL is the density of water, z is the specimen thickness, Σ is the
attenuation coefficient of water, I(t) is the intensity of the transmitted beam at time t and Idry is the intensity at initial (dry) state (explained
in detail in Sedighi Gilani et al. 2012). This means from ‘subtraction’ of current and initial images, the quantity of added moisture to the dry sample was calculated.
Swelling occurs in all three orthotropic directions of wood, stronger in the tangential than in the radial directions and weaker in the longitudinal direction (Skaar 1988). While the specimens expanded during moisture adsorption, the time resolved change in the geometry of specimen was documented with NR images. Swell-ing along the x-direction of the acquisition plane was determined as:
x 0 0 ( , )-L (y, t ) ( , ) x ( , ) x x L y t y t L y t ε = (2)
where εx(y, t) and Lx(y, t) correspond with the time dependent swell-ing strain and the dimension of the specimen, both along x-axis at height position y and time t. As images were acquired in the 2D plane, only the swollen area (LR) of the specimens was available for evalua-tion. In each image this area was measured after segmentation from the background with Otsu’s method (Otsu 1979).
Laboratory tests: To validate the reproducibility of the results from NR analysis in a larger group of specimens, different experiments were performed in the laboratory. Forty control and fungally incubated (8, 20 and 36 weeks) wood specimens with dimensions of 20 × 2.5 × 20 mm3 (R × T × L) were exposed to 80% RH in a climatic chamber at 20°C. Increase in mass and dimensions of the specimens were measured with a precision balance (Mettler Toledo, Switzerland, 0.0001 g) and caliper (PAV electronic, Switzerland, 0.01 mm) for 7 days, until they gained equilibrium MC (EMC). Also, sorption/desorption curves were measured in a DVS apparatus (TA instruments, Germany). It allows obtaining the precise isotherms over a stepwise variation of RH and a user set temperature range where isotherms were recorded. DVS tests were performed on 2 replicate specimens incubated for 36 weeks (W36w,
incub) and control (Wc) of Norway spruce and sycamore (total of eight
tests). They were exposed to ten relative humidity steps in adsorption (5, 15, 25, 35, 45, 55, 65, 75, 85, 95%) and ten in desorption. RH was
kept constant at each step, until moisture equilibrium was gained. For small tested wood specimens in DVS ( < 0.3 g dry mass), each step lasted between 2 h and 3 h, and for thin plates of wood tested in 80% RH cli-matic chamber, time of equilibrium lasted longer than 7 days. Contrary to the laboratory tests, the NR experiments represent the hygroscopic behavior of the material before gaining the equilibrium MC.
Results and discussions
Spatial distribution of moisture
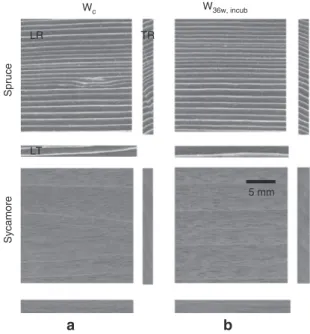
In Figure 2 the orthogonal X-ray CT appearance of the Wc and W36w, incub are shown in longitudinal-radial (LR), longitudinal-tangential (LT) and tangential-radial (TR) planes. LW layers can be distinguished from the EW by their lighter gray color. The very fine and parallel-aligned growth rings are typical for high quality resonance Wspruce. Wsycamore, however, the curly structure could have made the interpretation of the radiography (projection) images more difficult. Figures 3a and 4a show the NRs of the Wc and W36w, incub in the dry state and after 1.5 h, 4 h and 8 h of moisture adsorption at 80% RH. The random intensity dis-tribution pattern depends on the location of growth layers. Warm colors correspond to low neutron attenuation (low
Wc W36w, incub Spruce Sycamore b a LR 5 mm LT TR
Figure 2 X-ray computer tomography (3D-CT) showing the orthogo-nal appearance of untreated and treated wood in the LR, LT and RT planes. N.B., slices were from the center of test specimens. Top: (a) untreated control and (b) Norway spruce specimen after 36 weeks’ incubation with Physisporinus vitreus. Bottom: (a) untreated control and (b) sycamore specimen after 36 weeks’ incubation with Xylaria
MC), which changed to cold colors with moisture sorp-tion. More bluish colors in the location of sample holders are artifacts, due to the increased attenuation of neutron beam by aluminum.
For interpretation of the gray value intensity pattern and its spatial changes in time of exposure to the humid air, differences in density, porosity and moisture capac-ity of EW and LW layers must be taken into account. More extended distribution of cold colors in Wspruce, EW layers was due to thin tracheids walls, larger lumina, and a larger number of pits than in LW. It makes the EW layers more permeable to the vapor and the preferential paths for vapor transport (Zillig 2009). Changes in the intensity of the neutron beam was due to the ‘change’ of the water mass in the specimens. In Spruce, the extent of cold colors variation within the EW and LW layers in the Wc was more
pronounced, compared with the W36w, incub, which indicated a more significant difference between the hygroscopic properties of growth layers in Wc. This trend was not clearly observed in curly Wsycamore, as the growth layers were not perpendicular to the plane of image acquisition (LR plane), as apparent in X-ray orthogonal slices in Figure 2.
From Equation 1, the ‘absolute’ quantity of the MC can be determined by comparing the image of time t and the initial state. For this comparison, change in the dimen-sions of the specimens (swelling) should be registered. However, a faultless registering of the whole surface of the specimen in fine-grain resonance wood was challenging. Thus in Figures 3b and 4b, the profiles of the MC, only the illustrated region of interest (ROI) were compared. The vertical axis corresponds to the specimen height and the horizontal axis showed the MC, obtained by averaging the W36w, incub Intensity Initial 1.5 h 0 5 10 15 20 0.8 0.7 0.75 0.65 Control 36 weeks 4 h 0 5 10 15 20 8 h 0 5 10 15 20 0 30 60 90 120 150 0 30 60 90 120 150 MC (kg m-3) MC (kg m-3) MC (kg m-3) 0 30 60 90 120 150 Height position (mm) Height position (mm) Height position (mm) b a Wc
Figure 3 (a) Neutron transmission images showing the change of the intensity in control specimen of Norway spruce and specimen after 36 weeks’ incubation with Physisporinus vitreus, (b) profiles of the MC in ROI, (2 mm width in the center).
quantified moisture in ROIs at different sorption states. The moisture profiles are illustrated by black solid lines for Wc and red solid lines for W36w, incub. Vertical dashed lines indicate the average of the altered MCs across the growth layers (black for Wc and red for Wincub).
In spruce, MC profiles of Wc and W36w, incub were not sig-nificantly different. In contrast, the MC profile of W36w, incub showed a higher moisture capacity than Wc in sycamore, even after a few hours. The MC profile altered across the grain depends on the location of EW and LW layers. Figure 5 shows the average grain MC alteration, in columns of horizontal strip fillers for the Wc and diagonal patterns for W36w, incub. Also, variance of the grain MC alteration in the ROI is indicated by black solid lines for the Wc and red solid lines for W36w, incub. Moisture capacity of both wood species increased after fungal treatment. One main observation
was the lower variance of the grain MC in W36w, incub. This was interpreted as a less different moisture capacity of the EW and LW layers in W36w, incub, indicating a more homogeneous sorption behavior at growth ring scale. The variance of the grain MC alteration in Wspruce was higher than in Wsycamore. Less variable profiles of MC in Wsycamore may have been related to its diffuse-porous microstruc-ture when compared with Wspruce, as indicated in Figure 6. This figure, acquired at synchrotron XRT microscopy with TOMCAT beamline of PSI, compared the 3D structures and the anatomical features such as EW and LW cells, xylem rays, vessels and hyphae inside the cell lumina in Wspruce and Wsycamore, after 36 weeks’ incubation. However, the less variable profiles of MC may have been related to the mor-phology of the grains in the TR plane. As explained above, the orientation of ‘curly’ growth rings was not exactly W36w, incub Intensity Initial 1.5 h 0 5 10 15 20 0.7 0.65 0.6 0.55 Control 36 weeks 4 h 0 5 10 15 20 8 h 0 5 10 15 20 b a Height position (mm) Height position (mm) Height position (mm) Wc MC (kg m-3) 0 30 60 90 120 150 MC (kg m-3) 0 30 60 90 120 150 MC (kg m-3) 0 30 60 90 120 150
Figure 4 (a) Neutron transmission images for control specimen of sycamore and specimen after 36 weeks’ incubation with Xylaria longipes, (b) profiles of the MC in ROI, (2 mm width in the center).
perpendicular to the neutron beam, thus the radiography images projected a combination of EW and LW layers.
Temporal change of MC and swelling
From each NR, the total MC of the specimens was calcu-lated by adding the obtained MC from NR for each pixel, over the total area of each specimen. Figure 7a,b show the temporal increase of the mass MC (%) at 80% RH, after
0 60 120 180 240 300 360 0 10 20 30 40 50 60 Var (MC) Av. MC (kg m -3) Av. MC (kg m -3) Wc W36w, incub Spruce a b 0 60 120 180 240 300 360 0 10 20 30 40 50 60 1.5 h 4 h 8 h Var (MC) Sycamore
Figure 5 Average and variance of alternation in the grain MC in the ROI, in control and 36 weeks’ fungally incubated (a) spruce and (b) sycamore. Ray cell Radial Tangential Earlywood Latewood Physisporinus vitreus hyphae xylem rays Xylaria longipes hyphae Vessel
Figure 6 Full micro-tomography image of Norway spruce (left) and sycamore wood (right), after 36 weeks’ incubation with Physisporinus
vitreus and Xylaria longipes.
dividing the calculated quantity of the moisture from Equation 1 by the specific density of each specimen. Also, in Figure 7c and d, the swelling strains in the RL plane are compared. Both wood specimens were incubated for 8, 20 and 36 weeks with P. vitreus and X. longipes. The average difference of the MC was measured with the precision balance at the end of experiments. The calculated data from NR was < 7.1%. This error was in an acceptable range (Hassanein 2006) and confirmed the applicability of the explained procedure above for quantitative NR analysis.
The coinciding variation of the slope of MC and swell-ing curves confirms their relationship. After 4 h, this slope significantly decreased, indicating the higher capacity of both Wc and Wincub for moisture adsorption at the start of the experiment. Even though, none of the test specimens gained the equilibrium MC after 8 h. Spruce and sycamore showed different sorption capacities. After 8 h sorption, the MC in the control Wspruce reached 10.3% whereas in Wsycamore, the MC was 8.2% (20% lower). Likewise, swelling of the control Wspruce at the end of the experiment was 2.2%, whereas Wsycamore swelled 2.0%. After fungal incubation, moisture adsorption in both wood species increased, however, unex-pectedly, swelling occurred with a lower rate in the W36w, incub. In Figure 8, MCs after an 8 h sorption test are presented as black columns and the corresponding swelling strains are shown as red lines. The increasing trend of the moisture capacity and dimensional stability (i.e., reduced swelling) of W36w, incub is clearly visible as a function of incubation time.
Equilibrium MC in the laboratory
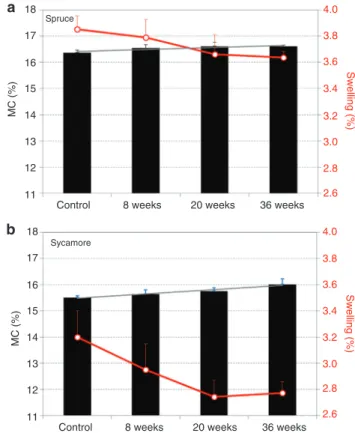
Figure 9 shows the averaged EMCs of the samples as black columns and corresponding swelling by red lines. The
positive slope of the EMCs trend line indicates the increase of the sorption capacity as a function of incubation time. Also, swelling of the Wincub was less than the controls and decreased with incubation time, which confirms the results from NR analysis.
Figure 10a and b show the results from DVS tests of the Wc and W36w, incub exposed to 10 RH steps in adsorption and 10 steps in desorption. The isotherms exhibited typical hysteresis (MC is higher in desorption than in sorption). Thick lines correspond to the hysteresis behavior of Wc,
Time (h) Time (h) Moisture content (% ) Swelling (%) Spruce a b c d 14 12 10 8 6 4 2 0 2.0 1.5 1.0 0.5 0 0 2 4 6 8 0 2 4 6 8 Spruce Sycamore Sycamore Control 8 weeks 20 weeks 36 weeks
Figure 7 Time resolved moisture adsorption (a-b) and corresponding swelling in the plane of image acquisition (c-d) for controls and speci-mens incubated for 8, 20 and 36 weeks with fungus.
14 12 Spruce a b Sycamore 10 8 6 MC (%) 4 2 2.4 2.2 2.0 1.8 1.6 Swelling (%) 1.4 1.2 1.0 2.4 2.2 2.0 1.8 1.6 Swelling (%) 1.4 1.2 1.0 0 14 12 10 8 6 MC (%) 4 2 0
Control 8 weeks 20 weeks 36 weeks
Control 8 weeks 20 weeks 36 weeks
Figure 8 MC of controls and fungally (8, 20 and 36 weeks) incubated Norway spruce (a) and sycamore wood (b) in black columns and cor-responding swelling in red lines after 8 h exposure to 80% RH.
18 17 Spruce a b Sycamore 16 15 14 MC (%) 13 12 4.0 3.8 3.6 3.4 3.2 Swelling (%) 3.0 2.8 2.6 11
Control 8 weeks 20 weeks 36 weeks 18 17 16 15 14 MC (%) 13 12 4.0 3.8 3.6 3.4 3.2 Swelling (%) 3.0 2.8 2.6 11
Control 8 weeks 20 weeks 36 weeks
Figure 9 EMC and swelling (red lines in secondary vertical axes) of controls and fungally treated Norway spruce (a) and sycamore wood (b).
and dashed lines indicate the behavior of W36w, incub. The slope of the isotherms for W36w, incub increased at RHs above 75%, whereas below that value, the hygroscopicity of both materials was comparable. For example in spruce, EMC of Wc at 65% RH was 11% that was 8% lower than in W36w, incub. EMC of Wc at 95% RH was 23.6%, while it was increased to 28.6% in W36w, incub. In Figure 10c and d, the first derivatives of EMCs, with respect to the change of RH are presented. It highlights the higher moisture capacity of both fungally treated woods compared with Wc at RHs above 75%.
These observations attribute to the degradation and change in the wood cell wall constituents after modifica-tion with white rot fungi. More specifically, spruce incu-bated with P. vitreus resulted in a preferential degradation of the pit membranes and delignifcation of the secondary walls (Schwarze 2007; Lehringer et al. 2011a,b). In syca-more, X. longipes causes cell wall erosion that starts com-monly in the secondary walls of libriform wood fibers (Schwarze et al. 2008). Partial degradation of the cell wall substances may increase the sorption capacity of wood by increasing the accessibility of cellulose fibrils to the water molecules. The contradictory behavior of the fungally treated wood, i.e., increase in the moisture capacity and dimensional stability can be explained by the hypothesis that the gained moisture is not totally bound to the cell
walls. Probably, a fraction of water molecules conden-sate in the developed voids induced during fungal decay. These voids are within the range of 2–5 nm (Flournoy et al. 1993), and their volume fraction must be correlated with the mass loss in the material after fungal treatment. Nev-ertheless, the differences in moisture capacity of the Wc and Wincub were more significant in spruce than in syca-more with a higher mass loss. Condensation in such cap-illaries, based on Kelvin equation may take place even if the ambient atmosphere is not fully saturated with water vapor (Skaar 1988). Thus the voids will act as micro-sinks for vapor condensation, which increase the equilibrium MC of the incubated woods at RHs above certain limits. This is confirmed by DVS test results, i.e., the higher sorp-tion capacity of the fungal treated wood after RH exceeded, e.g., 75%. Degradation of cellulose fibrils in the cell walls of fungal treated wood for periods longer than 8 weeks (Lehringer et al. 2011b) can be another explanation for the improved dimensional stability of the modified wood.
NR analysis showed that the alteration of MC across the grain was less significant in the Wincub (Figure 5). More abundant development of voids in the thick walls of LW after fungal treatment (Lehringer et al. 2010) may lead to a similar hygroscopic behavior as observed in EW, by increasing their porosity. It may also result in improved
23.6% 28.6% 0 5 10 15 20 25 30 0 10 20 30 40 50 60 70 80 90 100 MC (% ) RH (%) 0 10 20 30 40 50 60 70 80 90 100 RH (%) Control 36 weeks a Spruce 21.0% 23.2% bSycamore 0 0.2 0.4 0.6 0.8 1 5 15 25 35 45 55 65 75 85 95 85 75 65 55 45 35 25 15 5 5 15 25 35 45 55 65 75 85 95 85 75 65 55 45 35 25 15 5 Deriv. of MC (%/%) RH (%) Wc W36w,incub c Spruce RH (%) d Sycamore
Figure 10 Measured isotherm in dynamic vapor sorption apparatus for control and 36 weeks’ fungally incubated Norway spruce (left, a) and sycamore wood (right, b) and their first derivatives (bottom, c and d).
dimensional stability of Wincub, as LW generally showed higher swelling strains in sorption. This minimized the generation of internal stresses in the material that corre-sponded with different swelling/shrinkage of EW and LW (Jakiela et al. 2008; Neimsuwan et al. 2008).
Conclusions
Processing Norway spruce and sycamore wood with P. vitreus and X. longipes reduces the density, improves the dimensional stability and elevates the moisture sorption capacity. Moreover, the variance in sorption behavior of the EW and LW regions are reduced, thus the mesoscopic hygroscopic behavior of wood became more homogene-ous. The hygroscopicity changes after fungal incubation was successfully studies by thermal NR analysis. DVS tests and the mass gain of dry samples exposed to 80% RH confirm the NR results. It is possible that water molecules condensate in fungally induced nano-voids in the cell walls of incubated wood. Probably, the condensed water in the voids does not essentially affect the dimensional stability of wood. As a result, the new properties of the fungally treated spruce and sycamore wood make them more suitable for application as top and bottom-plates of violins.
Acknowledgments: We gratefully acknowledge the finan-cial support of Fischli foundation, and contribution of the team members of the Biotech-Violin project. Part of the experiments was carried out at the Paul Scherrer Institute, Villigen, Switzerland. We acknowledge the sup-port of Eberhard Lehmann and Jan Hovind from Neutra beamline, Sarah Irvine and Kevin Mader of the Tomcat beamline, Mathieu Plamondon for acquiring X-ray com-puter tomography acquisition at EMPA, Stephan Carl for development of the relative humidity generator machine and Markus Heeb and Daniel Heer for sample preparation.
References
Derome, D., Griffa, M., Koebel, M., Carmeliet, J. (2010) Hysteretic swelling of wood at cellular scale probed by phase-contrast X-ray tomography. J. Struct. Biol. 173:180–190.
European Committee for Standardization. European Standard EN 113. Wood preservatives: test method for determining the protec-tive effecprotec-tiveness against wood destroying basidiomycetes. Determination of toxic values. Brussels, Belgium: European Committee for Standardization 1997.
Flournoy, D.S., Paul, J.A., Kirk, T.K., Highley, T.L. (1993) Changes in the size and volume of pores in sweetgum wood during simultaneous rot by Phanerochaete chrysosporium burds. Holzforschung 47:297–301.
Gu, H., Zink-Sharp, A., Sell, J. (2001) Hypothesis on the role of cell wall structure in differential transverse shrinkage of wood. Holz Roh- Werks. 59:436–442.
Hassanein, R. (2006) Correction methods for the quantitative evaluation of thermal neutron tomography. Dissertation, ETH Zurich.
Hill, C.A.S., Norton, A.J., Newman, G. (2010) The water vapour sorp-tion properties of Sitka spruce determined using a dynamic vapour sorption apparatus. Wood Sci. Technol. 44:497–514. Hill, C.A.S., Ramsay, J., Keating, B., Laine, K., Rautkari, L., Hughes,
M., Constant, B. (2012) The water vapour sorption proper-ties of thermally modified and densified wood. J. Mater. Sci. 47:3191–3197.
Jakiela, S., Bratasz, L., Kozlowski, R. (2008) Numerical modeling of moisture movement and related stress field in lime wood subjected to changing climate conditions. Wood Sci. Technol. 42:21–37.
Kirk, T.K., Highley, T.L. (1973) Quatitative Changes in structural com-ponents of conifer woods during decay by white- and brown-rot fungi. Phytophatology 63:1338–1342.
Lehmann, E., Vontobel, P., Wiezel P.L. (2001) Properties of the radiography facility NEUTRA at SINQ and its potential for use as European reference facility, Nondestr. Testing Eval. 16:191–202.
Lehringer, C., Hillebrand, K., Richter, K., Arnold, M., Schwarze, F., Militz, H. (2010) Anatomy of bioincised Norway spruce wood. Int. Biodet. Biodegrad. 64:346–355.
Lehringer, C., Koch, G., Adusumalli, R.B., Mook, W.M., Richter, K., Militz, H. (2011a) Effect of Physisporinus vitreus on wood prop-erties of Norway spruce. Part 1: aspects of delignification and surface hardness. Holzforschung 65:711–719.
Lehringer, C., Saake, B., Zivkovic, V., Richter, K., Militz, H. (2011b) Effect of physisporinus vitreus on wood properties of Norway spruce. Part 2: aspects of microtensile strength and chemical changes. Holzforschung 65:721–727.
Ma, Q., Rudolph, V. (2006) Dimensional change behavior of Carib-bean pine using an environmental scanning electron micro-scope. Drying Technol. 24:1397–1403.
Mannes, D., Sonderegger, W., Hering, S., Lehmann, E., Niemz, P. (2009) Non-destructive determination and quantification of diffusion processes in wood by means of neutron imaging. Holzforschung 63:589–596.
Martínez-Iñigo, M., Immerzeel, P., Gutierrez, A., Carlos del Río, J., Sierra-Alvarez, R. (1999) Biodegradability of extractives in sapwood and heartwood from scots pine by sapstain and white rot fungi. Holzforschung 53:247–252.
Murata, K., Masuda, M., (2001) Observation of microscopic swelling behaviour of the cell wall. J. Wood Sci. 47:507–509.
Neimsuwan. T., Wang, S., Taylor, A.M., Rials, T.G. (2008) Statics and kinetics of water vapor sorption of small loblolly pine samples. Wood Sci. Technol. 42:493–506.
Otsu, N.A. (1979) A threshold selection method from grey-level histograms. IEEE T Syst. Man Cyb. 9:62–66.
Pandey, K.K., Pitman, A.J. (2003) FTIR studies of the changes in wood chemistry following decay by brown-rot and white-rot fungi. Int. Biodet. Biodegrad. 52:151–160.
Ray, M., Kleist, G., Murphy, R. (2005) Decay assessment in a hardwood handrail at the South Bank, London. J. Int. Wood Sci. 17:51–58. Sakagami, H., Matsumura, J., Kazuyuki, O. (2007) Shrinkage of
tracheid cells with desorption visualized by confocal laser scanning microscopy. IAWA J. 28:29–37.
Schwarze, F.W.M.R. (2007) Wood decay under the microscope. Fungal Biol. Rev. 1:133–170.
Schwarze, F.W.M.R., Schubert M. (2011) Physisporinus vitreus: a versatile white-rot fungus for engineering value added wood products. Appl. Microbiol. Biotechnol. 92:431–440.
Schwarze, F.W.M.R., Spycher, M., Fink, S. (2008) Superior wood for violins – wood decay fungi as a substitute for cold climate. New Phytol. 179:1095–1104.
Sedighi Gilani, M., Griffa, M., Mannes, D., Lehmann, E., Carmeliet, J., Derome, D. (2012)Visualization and quantification of liquid
water transport in softwood by means of neutron radiography. Int. J. Heat Mass Transfer. 55:6211–6221.
Skaar, C. (1988) Wood-water relations. Springer-Verlag Berlin, Germany.
Sonderegger, W., Hering, S., Mannes, D., Vontobel, P., Lehmann, E., Niemz, P. (2010) Quantitative determination of bound water diffusion in multilayer boards by means of neutron imaging. Eur. J. Wood Prod. 68:341–350.
Xie, Y., Hill, C.A.S., Hill, Xiao, Z., Mai, C., Militz, H. (2011) Dynamic water vapour sorption properties of wood treated with glutaraldehyde. Wood Sci. Technol. 45:49–61.
Zillig, W. (2009) Moisture transport in wood using a multi-scale approach, PhD Thesis, Catholic University of Leuven, Belgium.