HAL Id: hal-00298317
https://hal.archives-ouvertes.fr/hal-00298317
Submitted on 21 Nov 2006HAL is a multi-disciplinary open access
archive for the deposit and dissemination of sci-entific research documents, whether they are pub-lished or not. The documents may come from teaching and research institutions in France or abroad, or from public or private research centers.
L’archive ouverte pluridisciplinaire HAL, est destinée au dépôt et à la diffusion de documents scientifiques de niveau recherche, publiés ou non, émanant des établissements d’enseignement et de recherche français ou étrangers, des laboratoires publics ou privés.
Direct and indirect metabolic CO2 release by humanity
Y. T. Prairie, C. M. Duarte
To cite this version:
Y. T. Prairie, C. M. Duarte. Direct and indirect metabolic CO2 release by humanity. Biogeosciences Discussions, European Geosciences Union, 2006, 3 (6), pp.1781-1789. �hal-00298317�
BGD
3, 1781–1789, 2006 Metabolic human CO2 release Y. T. Prairie and C. M. Duarte Title Page Abstract Introduction Conclusions References Tables Figures ◭ ◮ ◭ ◮ Back CloseFull Screen / Esc
Printer-friendly Version Interactive Discussion Biogeosciences Discuss., 3, 1781–1789, 2006
www.biogeosciences-discuss.net/3/1781/2006/ © Author(s) 2006. This work is licensed
under a Creative Commons License.
Biogeosciences Discussions
Biogeosciences Discussions is the access reviewed discussion forum of Biogeosciences
Direct and indirect metabolic CO
2
release
by humanity
Y. T. Prairie1and C. M. Duarte2
1
D ´epartement des sciences biologiques, Universit ´e du Qu ´ebec `a Montr ´eal, P.O. Box 8888, succ. Centre-Ville, Montr ´eal, H3C 3P8, Canada
2
IMEDEA (CSIC-UiB), Instituto Mediterr ´aneo de Estudios Avanzados, C/ Miquel Marqu ´es 21, 07190 Esporles (Mallorca), Spain
Received: 26 October 2006 – Accepted: 16 November 2006 – Published: 21 November 2006 Correspondence to: C. M. Duarte ([email protected])
BGD
3, 1781–1789, 2006 Metabolic human CO2 release Y. T. Prairie and C. M. Duarte Title Page Abstract Introduction Conclusions References Tables Figures ◭ ◮ ◭ ◮ Back CloseFull Screen / Esc
Printer-friendly Version Interactive Discussion
EGU
Abstract
The direct CO2released by respiration of humans and domesticated animals, as well as the CO2 derived from the decomposition of their resulting wastes was calculated in order to ascertain the direct and indirect metabolic contribution of humanity to CO2 release. Human respiration was estimated to release 0.6 Gt C year−1and that of their
5
associated domestic animals was estimated to release 1.5 Gt C year−1, to which an indirect release of 1.0 Gt C year−1, derived from decomposition of the organic waste and garbage produced by humans and their domestic animals, must be added. These combined direct and indirect metabolic sources, estimated at 3.1 Gt C year−1, has increased 7 fold since pre-industrial times and is forecasted to continue to rise over the
10
21st century.
1 Introduction
Rapid increase in atmospheric CO2 has prompted intense research efforts at eluci-dating and quantifying the sources and sinks of CO2. The depictions of the global carbon budget consider the role of humans through the CO2 released from fossil fuel
15
combustion and changes in land use (IPCC, 2001), but does not explicitly estimate the metabolic CO2released by respiration by humans, as well as the CO2derived from the decomposition of their resulting wastes. In addition, humans maintain a large livestock population to feed themselves as well as a large number of domestic animals for other services, which release CO2both via direct respiration as well as via the decomposition
20
of their wastes. We assess here the magnitude of these combined direct and indirect metabolic CO2sources and their likely increase since pre-industrial times, to ascertain their role on the global CO2budget.
BGD
3, 1781–1789, 2006 Metabolic human CO2 release Y. T. Prairie and C. M. Duarte Title Page Abstract Introduction Conclusions References Tables Figures ◭ ◮ ◭ ◮ Back CloseFull Screen / Esc
Printer-friendly Version Interactive Discussion
2 Methods
Per capita respiration (R, in watts) and excretion (E, in watts) rates by humans and domestic animals were derived from body weight (W, in kg) using allometric relation-ships that depict standard metabolic and defecation rates as a power function of body weight as: R=3.89 W0.79 and defecation rate E=3.82 W0.63 (Peters, 1983). The per
5
capita respiratory CO2released by humans was also derived from direct respirometry measurements (Marrieb, 2000). Per capita organic waste production was extrapolated from Organisation for Economic Co-operation and Development figures (OECD, 2002). Human population size was derived from estimates of the past, present and projected estimates (Cohen, 1995; Population Division of the Department of Economic and
So-10
cial Affairs of the United Nations Secretariat, 2002), and the abundance of livestock was derived from 2004 FAO statistics (http://faostat.fao.org).
3 Results and discussion
The estimates of the metabolic CO2 release from human respiration obtained as the product of present human population size and per capita respiratory CO2 release
es-15
timated either from allometric relationships or from direct respirometric measurements were 0.6 Gt C year−1 and 0.57 Gt C year−1 (Table 1), respectively. We estimated that respiration by decomposers of the excreted organic matter releases an additional 0.29 Gt C year−1 (Table 1). Humans also produce non-metabolic organic waste (as garbage) amounting to about 0.1 Gt C year−1 , which must again be largely
decom-20
posed to CO2by bacterial respiration.
The population of domestic animals maintained by humans exceeds human popu-lation by three fold (Table 1). The combined respiratory CO2release by domesticated animals is estimated at 1.5 Gt C year−1, and decomposer respiration of their excreted products adds about 0.6 Gt C year−1. The total metabolic release by domesticated
25
animals of 2.1 Gt C year−1, must be considered an indirect human metabolic CO 2
re-BGD
3, 1781–1789, 2006 Metabolic human CO2 release Y. T. Prairie and C. M. Duarte Title Page Abstract Introduction Conclusions References Tables Figures ◭ ◮ ◭ ◮ Back CloseFull Screen / Esc
Printer-friendly Version Interactive Discussion
EGU
lease, for these animals only exist in such large numbers to provide food and service to humans.
The total direct and indirect metabolic CO2 release by humans amounts to an esti-mated 3.1 Gt C year−1(Table 1). This figure is a conservative estimate of the metabolic CO2 release associated to human activity, for humans now use about 30–40% of the
5
terrestrial (Vitousek et al., 1986) and 8% of the marine (Pauly and Christensen, 1995) primary production, most of which is eventually decomposed to CO2.
The calculated direct and indirect metabolic CO2 release by humans represents about half of the CO2 released from fossil fuel combustion, and nearly twice that re-leased from changes in land use (IPCC, 2001). Whereas the role of the CO2released
10
by fossil fuel combustion has been extensively discussed, that of the anthropogenic metabolic CO2 release has not. This is likely because anthropogenic metabolic CO2 release may be considered just an intensification of cycling process between the atmo-sphere and the bioatmo-sphere via enhanced crop and pasture production. However, the re-placement of natural ecosystems by pasture and crops represents a net human-derived
15
CO2emission through a decline in sink capacity, as essentially all of the production of crops and pastures is cropped and eventually decomposed to CO2. Acknowledging this to be a result of metabolic CO2release by humans provides a more direct identification of source components and a better appreciation of the consequences of demographic changes on this source component.
20
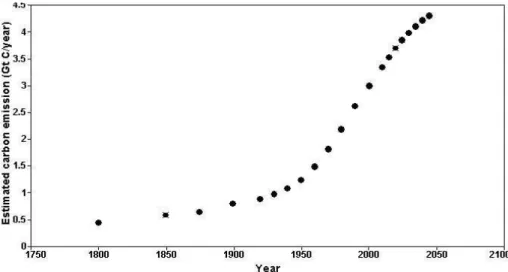
Whereas the increase in atmospheric CO2concentration resulting from different sce-narios of CO2 emissions from fossil fuel combustion have been discussed extensively (IPCC, 2001), all of them underestimate the likely increase in atmospheric CO2 con-centration by failing to account for demographics effects on the metabolic CO2release. The demographic effects on metabolic CO2release were examined by combining
esti-25
mates of past, present and future human population with the per capita rates of direct and indirect metabolic CO2release derived here. Direct and indirect metabolic CO2 re-lease by humans has been increasing through time from a calculated value of 0.44 Gt C year−1in 1800 to an expected 4.4 Gt C year−1 by year 2050 (Fig. 1), assuming that
BGD
3, 1781–1789, 2006 Metabolic human CO2 release Y. T. Prairie and C. M. Duarte Title Page Abstract Introduction Conclusions References Tables Figures ◭ ◮ ◭ ◮ Back CloseFull Screen / Esc
Printer-friendly Version Interactive Discussion per capita rates are maintained constant. The realized increase may well exceed this
estimate, since changes in diet and consumption habits are leading to a rapid increase in human body weight and food ingestion, and therefore per capita metabolic CO2 re-lease. In addition, the number of domestic animals per capita and per capita waste production are also increasing, and are expected to continue to do so in the future
5
(OECD, 2002; Tilman et al., 2002).
Metabolic CO2release can only augment as population size increases in the future. This is a component of the CO2 flux that must be recognized in future analyses of global CO2 dynamics and that must be considered to represents a component of the perturbed C cycle, as human population has increased, and will continue to increase,
10
greatly since pre-industrial time. Yet, the direct and indirect metabolic CO2 emissions by humans is not considered explicitly in the scenarios conducted by the IPCC (2001), and is not incorporated, therefore, into current strategies to mitigate the climatic con-sequences of greenhouse gas emissions. The absence of explicit consideration of metabolic human CO2emissions may be a symptom of a tendency to perceive humans
15
as separate entity to other species, which impacts on the biosphere involve their tech-nology, whereas the results presented here clearly indicate that human demography and metabolism are important factors involved in green house emissions. Whereas metabolic CO2 release maybe far less amenable to change than emissions derived from deforestation, cement production or fossil fuel use, different human choices can
20
affect human metabolic CO2 release. The indirect metabolic CO2 release may be re-duced through the promotion of behavioral changes to reduce the per capita consump-tion of meat and organic waste producconsump-tion, and the direct metabolic CO2release may be reduced by adjusting human ingestion to requirements, avoiding the excess food ingestion affecting much of the population in developed societies, and that represents
25
a health hazard as well, responsible for more than 1 in 10 deaths in the EU and USA (Banegas et al., 2003). In contrast, however, per capita food intake is forecasted to increase by about 10% from a present average value of 2803 Kcal year−1 person−1 to 3050 Kcal year−1 person−1 by 2030, increasing to 3500 Kcal year−1 person−1 by
BGD
3, 1781–1789, 2006 Metabolic human CO2 release Y. T. Prairie and C. M. Duarte Title Page Abstract Introduction Conclusions References Tables Figures ◭ ◮ ◭ ◮ Back CloseFull Screen / Esc
Printer-friendly Version Interactive Discussion
EGU
2030 in industrialized countries (FAO, 2002). In summary, human metabolic CO2 re-lease, direct and indirect, is an important and growing component of anthropogenic CO2 emissions. Explicit consideration of this component may help improve current emission scenarios and mitigation strategies.
Acknowledgements. This research is a contribution to the “Integrating the aquatic with the
ter-5
restrial component of the global carbon budget” Working Group supported by the National Cen-ter for Ecological Analysis and Synthesis, a CenCen-ter supported by NSF (Grant #DEB-94-21535), the University of California at Santa Barbara, and the State of California. Y. T. Prairie and C. M. Duarte were supported by the sabbatical fellowship program from the Spanish Ministry of Education and Science.
10
References
Banegas, J. R., L ´opez-Garc´ıa, E., Guti ´errez-Fisac, J. L., Guallar-Castill ´on, P., and Rodr´ıguez-Artalejo, F.: A simple estimate of mortality attributable to excess weight in the European Union, Eur. J. Clin. Nutr., 57, 201–208, 2003.
Cohen, J. E.: How Many People Can the Earth Support?, New York, USA, W. W. Norton, 532 15
p., 1995.
IPCC: Climate change 2001: The Scientific basis, New York, USA, Cambridge Univ. Press, 892 p., 2001.
Marrieb, E. N.: Human Anatomy and Physiology, 5th edition, New York, USA, Ben-jamin/Cummings, 1237 p., 2000.
20
OECD: Workshop on Waste Prevention: Toward Performance Indicators, Paris, France, OECD, 2002.
FAO: World agriculture: towards 2015/2030, Summary report, Food and Agriculture Organiza-tion of the United NaOrganiza-tions, Rome, Italy, 2002.
Pauly, D. and Christensen, V.: Primary production required to sustain global fisheries, Nature, 25
374, 255–257, 1995.
Peters, R. H.: The ecological implications of body size, New York, USA, Cambridge University Press, 1983.
BGD
3, 1781–1789, 2006 Metabolic human CO2 release Y. T. Prairie and C. M. Duarte Title Page Abstract Introduction Conclusions References Tables Figures ◭ ◮ ◭ ◮ Back CloseFull Screen / Esc
Printer-friendly Version Interactive Discussion
Population Division of the Department of Economic and Social Affairs of the United Nations Secretariat: World Population Prospects: The 2002 Revision,http://esa.un.org/unpp, 2002. Tilman, D., Cassman, K. G. , Matson, O. A., Naylor, R., and Polasky, S.: Agricultural
sustain-ability and intensive production practices, Nature, 418, 671–673, 2002.
Vitousek, P., Ehrlich, P. R., Ehrlich, A. H., and Matson, P.: Human appropriation of the products 5
BGD
3, 1781–1789, 2006 Metabolic human CO2 release Y. T. Prairie and C. M. Duarte Title Page Abstract Introduction Conclusions References Tables Figures ◭ ◮ ◭ ◮ Back CloseFull Screen / Esc
Printer-friendly Version Interactive Discussion
EGU
Table 1. Estimates of direct and indirect metabolic CO2 release by humans and associated animals. Figures correspond to 2003.
Weight Population Respiratory Excretory Total kg (millions) Gt C yr−1 Gt C yr−1 Gt C yr−1 Direct Humans 70 6100.00 0.57 0.28 0.28 Indirect Cows 891 1349.00 0.94 0.31 1.26 Goats 89 740.00 0.08 0.04 0.12 Sheeps 50 1050.00 0.08 0.04 0.12 Horses 794 58.00 0.04 0.01 0.05 Pigs 200 1000.00 0.22 0.09 0.31 Chickens 2.1 15 090.00 0.09 0.08 0.17 Buffalos 350 165.90 0.06 0.02 0.08 Turkeys 11.5 242.90 0.01 0.00 0.01 Geese 5.2 238.80 0.00 0.00 0.01 Ducks 2.6 917.70 0.01 0.01 0.01 Camels 140 19.40 0.00 0.00 0.00 Cats 2 1100.00 0.01 0.01 0.01 Total 2.14
Non-metabolic Waste production 0.10
BGD
3, 1781–1789, 2006 Metabolic human CO2 release Y. T. Prairie and C. M. Duarte Title Page Abstract Introduction Conclusions References Tables Figures ◭ ◮ ◭ ◮ Back CloseFull Screen / Esc
Printer-friendly Version Interactive Discussion