HAL Id: hal-00318830
https://hal.archives-ouvertes.fr/hal-00318830
Submitted on 1 Jan 2002
HAL is a multi-disciplinary open access
archive for the deposit and dissemination of
sci-entific research documents, whether they are
pub-lished or not. The documents may come from
teaching and research institutions in France or
abroad, or from public or private research centers.
L’archive ouverte pluridisciplinaire HAL, est
destinée au dépôt et à la diffusion de documents
scientifiques de niveau recherche, publiés ou non,
émanant des établissements d’enseignement et de
recherche français ou étrangers, des laboratoires
publics ou privés.
Geomagnetic field fluctuations during the passage at the
Earth’s orbit of the tail of the 15?16 July 2000 ejecta
P. Francia, S. Lepidi, K. Yumoto
To cite this version:
P. Francia, S. Lepidi, K. Yumoto. Geomagnetic field fluctuations during the passage at the Earth’s
orbit of the tail of the 15?16 July 2000 ejecta. Annales Geophysicae, European Geosciences Union,
2002, 20 (8), pp.1143-1152. �hal-00318830�
Annales Geophysicae (2002) 20: 1143–1152 c European Geophysical Society 2002
Annales
Geophysicae
Geomagnetic field fluctuations during the passage at the Earth’s
orbit of the tail of the 15–16 July 2000 ejecta
P. Francia1, S. Lepidi2, and K. Yumoto3
1Dipartimento di Fisica, Universit`a dell’Aquila, Via Vetoio, 67010 Coppito-L’Aquila, Italy 2Istituto Nazionale di Geofisica e Vulcanologia, Castello Cinquecentesco, 67100 L’Aquila, Italy 3Department of Earth and Planetary Sciences, Kyushu University, Fukuoka, 812-81, Japan
Received: 1 October 2001 – Revised: 8 March 2002 – Accepted: 15 April 2002
Abstract. In this work we present the analysis of the
geo-magnetic field fluctuations observed at different ground sta-tions (approximately along two latitudinal arrays, separated by several hours in local time) during the passage at the Earth’s orbit of the tail of the 15–16 July 2000 coronal ejecta. The time interval of interest is characterized by northward in-terplanetary magnetic field conditions and several changes in the solar wind dynamic pressure. We found at all stations, both in the local morning and in the local evening, simul-taneous and highly coherent waves at the same discrete fre-quencies (∼1.8 and ∼3.6 mHz) and suggest a possible inter-pretation in terms of global compressional modes driven by an impulsive variation of the solar wind pressure. Along the array situated in the morning sector, at the highest latitudes, the higher frequency mode seems to couple with the local field line resonance; on the other hand, along the array situ-ated in the evening sector, the characteristics of the observed fluctuations suggest that the highest latitude station could be located at the footprint of open field lines. Our results also show that solar wind pressure variations observed during the recovery phase of the storm do not find correspondence in the geomagnetic field variations, regardless of local time and latitude; conversely, some hours later continuous solar wind pressure variations find a close correspondence in the geo-magnetic field variations at all stations.
Key words. Magnetospheric physics (solar
wind-magneto-sphere interaction; MHD waves and instabilities)
1 Introduction
The geomagnetic effects of the passage at the Earth’s orbit of solar wind (SW) regions, characterized by variable interplan-etary magnetic field (IMF) or plasma parameters, have been studied with great interest in the last few years; in particular, the SW sources of geomagnetic storms, the storm-substorms
Correspondence to: P. Francia
(patrizia.francia@aquila.infn.it)
relationship and the primary role of the north-south compo-nent of the IMF have been well discussed by Kamide et al. (1998) and Gonzalez et al. (1999).
Much attention has also been given to the study of low-frequency fluctuations of the geomagnetic field excited by SW pressure variations (Takahashi, 1998), in particular dur-ing quiet geomagnetic conditions, i.e. when the IMF is north-ward and transient effects such as the onset of a substorm current system and the intensification of the ring current can be neglected. When excited by SW pressure impulsive varia-tions, the magnetosphere behaves as a cavity oscillating at its own eigenfrequencies, which depend on its dimensions and physical characteristics (Radoski, 1974; Kivelson and South-wood, 1985, 1986). Samson et al. (1992) and Walker et al. (1992) extended the cavity model by considering the mag-netosphere as an open-ended waveguide in which compres-sional modes driven by the SW propagate in the antisunward direction. At auroral latitudes, modes at discrete frequen-cies ∼1.2–1.4, 1.8–2.0, 2.4–2.6 and 3.2–3.4 mHz have been observed in several studies and interpreted in terms of lo-cal field line resonances excited by the global compressional modes (Samson et al., 1991, 1992; Harrold and Samson, 1992; Walker et al., 1992; Ziesolleck and McDiarmid, 1994, 1995; Mathie et al., 1999). At low latitude, statistical analy-ses (Ziesolleck and Chaumalaun, 1993; Francia and Villante, 1997; Villante et al., 2001) have shown that modes at these discrete frequencies are characteristic features of the power spectra of the ground magnetic field fluctuations. In addition, studies of individual events reported evidence of oscillations at the cavity/waveguide mode frequencies, which were as-sociated with SW pressure pulses and extended to a major portion of the Earth’s magnetosphere, confirming the global character of these fluctuations (Shimazu et al., 1995; Villante et al., 1998; Lepidi et al., 1999). It was observed that, at au-roral latitudes, low-frequency pulsations show a clear morn-ing/afternoon asymmetry, with an higher occurrence rate in the morning (Rostoker and Sullivan, 1987; Ziesolleck and McDiarmid, 1995; Chisham and Orr, 1997; Mathie et al., 1999) and that afternoon pulsations are driven dominantly by
1144 P. Francia et al.: Geomagnetic field fluctuations during the July 2000 ejecta passage sporadic impulses in the SW (Rostoker and Sullivan, 1987).
Consistent with the theory by Mann et al. (1999), who in-vestigated the energization of waveguide modes by magne-tosheath flows on the magnetopause flanks, and with the ob-servations by Mathie et al. (1999) and Matthie and Mann (2000), the observed morning/afternoon asymmetry can be explained in terms of a greater stability of the postnoon mag-netopause to shear-flow instabilities than the dawn flank; in this sense, pulsations driven by magnetopause instabilities during intervals of enhanced SW speed occur predominantly in the morning, while impulsively driven pulsations may ex-tend over a wide range of local times. It is interesting to note that at low latitude, the occurrence of pulsations at cav-ity/waveguide mode frequencies is statistically higher in the afternoon (Villante et al., 2001); this feature has been inter-preted in terms of SW pressure pulses associated with coro-tating structures, which more frequently impinge on the post-noon magnetopause.
Impulsive SW pressure increases impacting the Earth’s magnetosphere can be considered as a source of global res-onant oscillations; on the other hand, it is also possible to observe that more continuous and low amplitude variations of the SW pressure can find a correspondence in the ground magnetic field variations (Ogilvie and Burlaga, 1974; Sibeck et al., 1989). Recently, in a statistical study, Francia et al. (1999) analyzed some events occurring during northward IMF conditions and showed that the geomagnetic field hori-zontal component H at a low-latitude station (L’Aquila) re-sponds very well to the SW pressure variations on a time scale of few minutes. The amplitude of the geomagnetic response was found to be linearly related to the change in the square root of the SW dynamic pressure, and its aver-age amplitude (∼13 nT/(nPa)1/2) is comparable with the val-ues found by Russell et al. (1994) and Russell and Ginskey (1995) at low and subauroral latitudes in the analysis of the sudden impulse (SI) response to the passage of interplane-tary shocks. Moreover, the amplitude of the response was found to depend on local time, with greater values around local noon and midnight and a pronounced minimum dur-ing the local morndur-ing. A similar local time dependence, al-though characterized by a greater excursion between maxi-mum and minimaxi-mum values, was also found by Russell and Ginskey (1995) in the analysis of SIs at subauroral latitudes (near 55◦).
The great variety of recent studies on these subjects indi-cates that the occurrence and the global character of the ge-omagnetic response to both impulsive and continuous stim-ulations from the SW, as well as the local time and latitudi-nal dependence of the properties of the observed phenomena, are outstanding problems. In this context, we present a case study of the ground response to SW pressure variations oc-curring during a long duration period of northward IMF in the recovery phase of the major geomagnetic storm of 15–16 July 2000; in particular, we analyzed the geomagnetic field fluctuations observed at several ground stations along two ar-rays spanning from low to auroral latitudes and separated by several hours in magnetic local time. We found a very strong
Table 1. IGRF 2000 corrected geomagnetic latitude, MLT midnight
in UT and L value for the stations
Station CGM lat MLTMN L (◦N) (UT) SOD, Finland 63.9 21:03 5.24 NUR, Finland 56.9 21:24 3.40 BFE, Denmark 52.0 22:17 2.69 NGK, Germany 48.0 22:17 2.27 BDV, Czech Republic 44.5 22:16 1.99 CTS, Italy 41.0 22:27 1.77 AQU, Italy 36.3 22:23 1.56 CHD, Russia 65.0 15:09 5.67 ZYK, Russia 59.9 14:49 4.03 MGD, Russia 53.8 14:41 2.90 PTK, Russia 46.4 14:09 2.10 MSR, Japan 37.6 14:59 1.60 ONW, Japan 31.5 15:00 1.40
similarity of the geomagnetic field variations at all the sta-tions, independent of latitude and magnetic local time, which indicates the global character of the response of the magneto-sphere, when excited by variations of the SW pressure. Our results also show that the geomagnetic response to the ex-ternal stimulations is not always clearly detectable, depend-ing on magnetospheric conditions; in particular, an impul-sive variation of the SW pressure, occurring when the IMF northward conditions persist for several hours, triggers along both arrays simultaneous and highly coherent pulsations at the same discrete frequencies, which can be interpreted in terms of global compressional modes; also, continuous SW pressure variations occurring some hours later find a close correspondence in geomagnetic field variations, regardless of local time and latitude; conversely, we do not observe any clear common geomagnetic response to the larger SW pressure variations occurring some hours earlier, during the recovery phase of the storm.
2 Experimental results
We used 1-min values of the geomagnetic field horizontal component H measured along two meridional arrays sepa-rated by approximately 6–8 hours in magnetic local time (Ta-ble 1). The first array consists of seven geomagnetic stations in Europe spanning over the latitude range between ∼36◦N and ∼64◦N at approximately (within ∼1.5 h) the same mag-netic local time: the Italian stations of L’Aquila (AQU) and Castello Tesino (CTS) and five INTERMAGNET stations. The second array consists of six stations along the 210 MM (within 1 hour) and spans almost the same latitudinal interval between 31.5◦N and 65◦N. For the SW and IMF
measure-P. Francia et al.: Geomagnetic field fluctuations during the July 2000 ejecta passage 1145
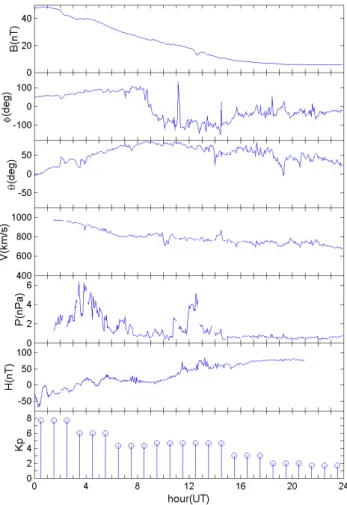
Fig. 1. ACE measurements, ground observations from AQU and Kpindex on 16 July 2000. From top to bottom are shown the IMF
strength and its longitude and latitude in the ecliptic angular coor-dinates, the SW flow speed and dynamic pressure, the variations of the horizontal geomagnetic field component H at AQU and the Kp
index.
ments, we used the 64-s and 16-s averages, respectively, from the ACE spacecraft at the L1 point (∼247 REin the radial
di-rection).
The 15–16 July 2000 ejecta arrived at the ACE position at about 19:00 UT on 15 July 2000 and was characterized by an unusually strong (with values up to ∼60 nT) southward directed IMF and by an extremely high SW velocity. The high rate of particles caused spacecraft anomalies, and reli-able SW data are availreli-able only from 16 July, when the ejecta still engulfed the Earth.
In Fig. 1, we show the H component of the geomag-netic field at AQU, the Kp index values and the simultane-ous IMF and plasma data (smoothed by means of 3-min run-ning averages with a step size of 1 min) on 16 July 2000. As can be seen, the IMF strength decreased progressively throughout the day and its direction turned northward (θ > 0) from ∼01:00 UT (in the preceding hours, the strong south-ward component caused an intense geomagnetic storm with the Dst index reaching 300 nT). The SW data show
sev-eral gaps; however, we can see that the velocity was still
Fig. 2. Variations of the horizontal geomagnetic field H component
at the different stations from 03:00 UT to 17:00 UT on 16 July 2000. Left and right panels correspond to the European and the Asiatic array, respectively.
very high, with values slowly decreasing from ∼1000 km/s to ∼700 km/s, while the dynamic pressure was character-ized by several large amplitude variations until ∼15:00 UT. On the ground at AQU, during the local morning, the mag-netic field was still disturbed due to the previous southward IMF conditions (a clear signature of a bay before 01:00 UT can be noted), but it was slowly recovering to its prestorm values; as for the Kp index, its value changed from 8− at
the beginning of the day to 4+ in the time interval 06:00– 09:00 UT, to 5− between 09:00 and 15:00 UT and then de-creased to 3 and 2− in the following hours. We can ob-serve that the H component shows wave activity from the very early morning, in correspondence with the large varia-tions of the SW pressure observed by ACE from ∼03:00 UT. At ∼07:20 UT, the waves became more regular and quasi-monochromatic oscillations are observed for several cycles until ∼08:10 UT; minor amplitude pulsations are also de-tected from 09:00 UT. A very evident feature emerging from Fig. 1 is that, between ∼11:00–15:30 UT, the oscillations ap-pear superimposed on longer period variations and the whole pattern, although time-delayed, closely resembles the large SW pressure variations observed by ACE between ∼10:30– 15:00 UT. Conversely, it can be noted that, during the local morning, the H component pattern does not show any re-semblance to the strong SW pressure changes observed in the time interval 03:00–07:40 UT.
In order to investigate the spatial extent of the observed geomagnetic field variations, we also examined the
geomag-1146 P. Francia et al.: Geomagnetic field fluctuations during the July 2000 ejecta passage
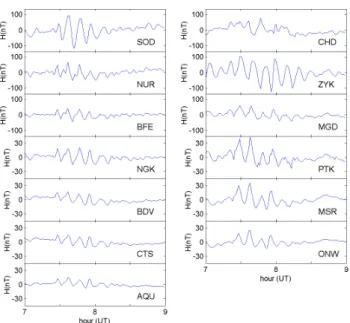
Fig. 3. Oscillations of the horizontal geomagnetic field H
compo-nent in the time interval 07:00–09:00 UT at the different stations.
netic data at the other ground stations in the time interval 03:00–17:00 UT (Fig. 2). The quasi-monochromatic fluctu-ations observed at AQU during the 07:20–08:10 UT time in-terval are clearly detected both along the European and the 210 MM array (except perhaps at the highest station CHD), located in the local morning and in the local afternoon, re-spectively, and their amplitude increases with increasing lat-itude, as can be expected for fluctuations having a common external source. Also, the pattern of the continuous varia-tions observed at AQU between 11:00–15:30 UT (i.e. in the afternoon and in the pre-midnight sector along the European and the 210 MM array, respectively) is evident at the dif-ferent stations, although at the highest latitudes, it is par-tially masked by strong, higher frequency fluctuations. Note that the SW pressure variations observed between 03:00– 07:40 UT do not find any clear correspondence in the H variations, nor at the European or the 210 MM stations (in the morning and postnoon sector, respectively), except at the highest station CHD, where the H variations seem to follow, with some delay, the SW pressure changes.
In Fig. 3, we plot the regular oscillations on the H com-ponent in the time interval 07:00–09:00 UT at the different stations. It can be noted that the onset of the pulsations, at ∼07:20 UT, is abrupt and simultaneous at all stations; as pre-viously noted, at CHD, the pulsations are less evident and are masked by the pattern of the H variations correspond-ing to the SW pressure variations observed from ACE be-tween ∼06:40–07:40 UT. A spectral analysis of the oscilla-tions in the 07:00–09:00 UT time interval was performed us-ing the maximum entropy method of the order of m = 20 of the prediction error filter (with a frequency resolution of about 0.14 mHz). We found that at all stations the power spectra show peaks at discrete frequencies, namely at 1.8 and 3.6 mHz (Fig. 4); some evidence for a third peak, less
Fig. 4. Power spectra of the horizontal geomagnetic field H
com-ponent in the time interval 07:00–09:00 UT at the different stations.
clear than the previous ones, also emerges at 2.6 mHz. These frequencies are close to those detected at auroral latitudes (Mathie et al., 1999 and references therein) which are gen-erally interpreted in terms of field line resonances set up by the compressional magnetospheric waveguide modes. Along the European array, the power of the 1.8 mHz peak monoton-ically increases with increasing latitude from AQU to SOD; the 3.6 mHz peak shows a similar behaviour only up to the latitude of NUR, where its power is maximum; then at SOD it has a lower power content and appears shifted to a slightly lower frequency (3.5 mHz). Along the 210 MM array, the power of both the 1.8 mHz and the 3.6 mHz peaks increases with latitude up to ZYK (although at PTK, the 3.6 mHz peak is broader and shifted to a lower frequency) and then de-creases at the latitude of CHD, where the 1.8 mHz peak is also partially masked by the higher power content at lower frequencies. For the two-hour interval 07:00–09:00 UT, we
P. Francia et al.: Geomagnetic field fluctuations during the July 2000 ejecta passage 1147
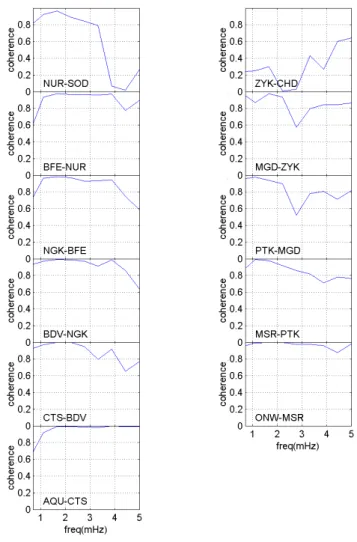
Fig. 5. Coherence between the horizontal geomagnetic field H
component in the time interval 07:00–09:00 UT at pairs of adjacent stations.
also computed the coherence of the H component between couples of adjacent stations (with 8◦of freedom, i.e.
averag-ing four 30-min intervals). It can be seen from Fig. 5 that in Europe, for fluctuations up to 4 mHz, the coherence is very high (>0.8) from AQU to NUR, while between NUR and SOD it shows an abrupt decrease at frequencies higher than 3.3 mHz; in Asia, the coherence is high up to ZYK, although at latitudes between PTK and ZYK, it shows a pronounced minimum around ∼2.7 mHz (note from the corresponding spectra in Fig. 4 that the power peak at this frequency disap-pears), while between ZYK and CHD it is low in the whole frequency range.
From the previous results, it is evident that along the 210 MM array, the 1.8 mHz and the 3.6 mHz modes show similar characteristics: their power increases with increasing latitude and their coherence remains high up to the latitude of ZYK (∼60◦); at CHD (65◦), although the two power peaks are still present, their power is lower and the corresponding fluctuations are decoupled from those detected at the other stations. On the other hand, in Europe, the two modes show different characteristics: the 1.8 mHz fluctuations are highly
Fig. 6. Spectral ratio G and phase difference λ between the
hori-zontal geomagnetic field H component in the time interval 07:00– 09:00 UT at pairs of adjacent stations (assuming the lower latitude station as the input).
coherent over the whole latitudinal range (∼36◦–64◦) and their power increases monotonically with increasing latitude; conversely, the higher frequency (3.6 mHz) fluctuations are coherent up to NUR (∼57◦), where their power maximizes; then, between NUR and SOD (∼64◦), the coherence strongly decreases and at SOD, the frequency is slightly lower and the power decreases. These features might be signatures of a field line resonance at ∼3.6 mHz between NUR and SOD (Southwood, 1974; Chen and Hasegawa, 1974; Waters et al., 1995), which takes energy from the coupling with the mag-netospheric compressional mode. The evaluation of the spec-tral ratio G (or gain factor) and the phase difference between the H components at two adjacent stations can be used as an additional method to investigate this possibility (Baransky et al., 1985; Waters et al., 1991; Menk et al., 2000). In general, this method requires that the spatial separation between the stations should be small enough to maintain adequate coher-ence in the wave fields (Waters et al., 1995), but also large enough to resolve the variation of the phase difference; in our study, the separations between pairs of adjacent stations (from 3◦ to 8◦, and in particular, 7◦ for the couple NUR-SOD) are larger than in the study by Waters et al. (1995);
1148 P. Francia et al.: Geomagnetic field fluctuations during the July 2000 ejecta passage
Fig. 7. The square root of the SW pressure and the H component at
the different stations in the time interval 11:20–13:51 UT (SW data are shifted for the time delay of 37 min).
however, Menk et al. (1999), using station pairs spaced up to ∼6◦, have shown that, for some events, resonance signa-tures can also be obtained for the most widely spaced station pairs. In Fig. 6, we show the spectral ratio and the phase dif-ference for couples of adjacent stations, assuming the lower latitude station as the input; we do not show the two param-eters for the stations ZYK-CHD, among which the signals are decoupled. We can note that for latitudes up to NUR in Europe and ZYK in Asia, both the gain and the phase dif-ference do not exhibit any significant frequency dependence; moreover, the spectral ratio G is greater than 1, indicating the latitudinal increase in the amplitude of the fluctuations. Conversely, between NUR and SOD, both parameters show around 3 mHz, in correspondence to the sharp decrease in the coherence (Fig. 5), the predicted behavior for resonant phe-nomena: the spectral ratio decreases smoothly from G >1 to G <1 and the phase difference reaches minimum values. Thus, along the European array, the 3.5–3.6 mHz compres-sional mode seems to couple with the local field line reso-nance between NUR and SOD, while along the Asiatic array the pulsations characteristics seem to indicate a dominantly compressional mode up to ZYK.
We also analyzed the close correspondence between the geomagnetic field H component and the SW pressure vari-ations observed at all stvari-ations around 12:00 UT, i.e. just af-ter the local magnetic noon and in the local evening along the European and the 210 MM arrays, respectively. In or-der to quantitatively investigate this aspect, we estimated, for
Table 2. The parameters of the linear fit between the H
compo-nent at the different stations and the square root of the SW dynamic pressure Station ρ R(nt/(nPa)1/2) SOD, Finland 0.71 53±4 NUR, Finland 0.71 42±4 BFE, Denmark 0.69 32±3 NGK, Germany 0.77 31±2 BDV, Czechoslovakia 0.84 26±1 CTS, Italy 0.85 25±1 AQU, Italy 0.87 21±1 CHD, Russia 0.55 27±3 ZYK, Russia 0.75 31±2 MGD, Russia 0.85 28±1 PTK, Russia 0.87 21±1 MSR, Japan 0.87 26±1 ONW, Japan 0.88 18±1
different time delays, the correlation coefficient ρ between the H component at each station in the time interval 11:20– 13:51 UT and the square root of the SW pressure. We used 6-min running averages (with a step size of 1-min) of both the SW and geomagnetic data to rule out the shortest period variations and then detrended the geomagnetic data to elim-inate the long-term variations. At all stations, we found the highest values of ρ coefficients for a time delay of 37 min, which is comparable to the SW estimated transit time along the radial direction between ACE and the subsolar point of the bowshock (∼31 min, at an average speed of ∼800 km/s) plus a few minutes due to the propagation to the ground (sim-ilar results on the time delay between spacecraft and ground observations were also found in the analysis by Francia et al., 1999); in Fig. 7, we show the square root of the SW pressure (the data have been shifted for the time delay of 37 min) and the H component at the different stations in the time interval of interest. The similarity of the variations detected at all the stations, as well as their close correspondence with the SW pressure variations, are really striking.
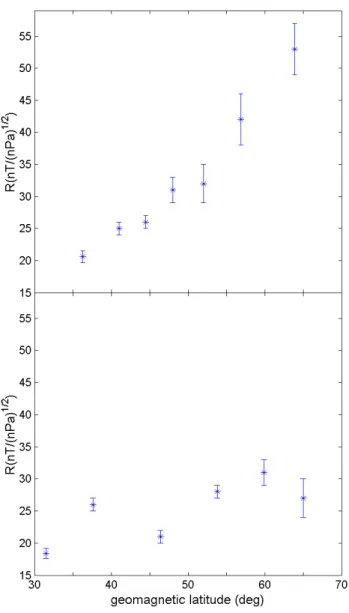
Table 2 gives the values of the correlation coefficient at each station and the corresponding geomagnetic response R computed as the slope of the least-squares linear approxima-tion between H and the square root of the SW pressure val-ues. It can be noted that the correlation is high for all stations, except for the highest latitude station along the 210 MM ar-ray. As made clear in Fig. 8, along the European array, the amplitude of the response increases monotonically with the geomagnetic latitude of the station and the growth seems more steep beyond ∼55◦ (L ∼3). In particular, it can be seen that the value of the response at AQU (21 nT/(nPa)1/2) is slightly higher than the value found previously just after the local noon (17.5 nT /(nPa)1/2) in the statistical analysis of
P. Francia et al.: Geomagnetic field fluctuations during the July 2000 ejecta passage 1149
Fig. 8. The ground response R versus the geomagnetic latitude of
the stations for the European array (upper panel) and the Asiatic array (lower panel).
Francia et al. (1999) and that at the subauroral station NUR, it is higher (42 nT/(nPa)1/2) than the geomagnetic response level (between 20–30 nT/(nPa)1/2) observed after local noon by Russell and Ginskey (1995) in the statistical analysis of SIs at subauroral latitudes. Figure 8 also shows that, along the 210 MM array, situated in premidnight sector, the latitu-dinal dependence of the response is not clearly defined: in particular, some evidence for a latitudinal increase in the re-sponse (although less steep than along the European array) emerges up to ZYK; however, an anomalous high response is observed at MSR, with a value (26 nT/(nPa)1/2) much higher than observed previously at approximately the same latitude during the local evening (∼14 nT/(nPa)1/2) in the statistical study of Francia et al. (1999). Also, the response at MGD is much higher with respect to the value found for the same local time by Russell and Ginskey (1995) at subauroral lati-tudes.
We noted previously the lack of a geomagnetic response
Fig. 9. The square root of the SW pressure and the H component at
CHD in the time interval 04:50–08:10 UT (SW data are shifted for the time delay of 37 min).
to the continuous SW pressure variations observed between 03:00–07:40 UT, not only along the European array in the local morning (when the amplitude of the response at mid-latitudes should be minimum, Francia et al., 1999), but also at the 210 MM stations after the local noon (when its ampli-tude at mid-latiampli-tudes should be high, Francia et al., 1999); this feature seems to indicate that the magnetosphere, which is still recovering from a major geomagnetic storm, does not clearly respond to the continuous SW pressure varia-tions. We noted, however, that some correspondence with the SW pressure variations emerges at CHD from ∼05:00 UT (Fig. 9); for this station we computed the correlation coeffi-cient between the H component variations in the time in-terval 04:50–08:10 UT and the SW pressure variations and found that the highest value (ρ = 0.54) is also obtained, in this case, for a delay time of 37 min, and that the ampli-tude of the response, 41±5 nT/(nPa)1/2, is higher than the value obtained at the same station in the premidnight sec-tor. The estimate of a delay time of 37 min between the SW pressure and the CHD geomagnetic variations in the time interval 04:50–08:10 UT, also suggests that the quasi-monochromatic fluctuations observed at all stations from ∼07:20 UT could be triggered by the sudden change in the SW pressure at ∼06:40 UT. On this point, we note that from a spectral analysis of the SW pressure (not shown), no ev-idence emerges for waves at the same discrete frequencies observed on the ground, so the geomagnetic oscillations are not directly driven by periodic pressure variations.
3 Summary and discussion
This paper is focused on the study of the geomagnetic effects related to the impact on the magnetopause of SW regions characterized by several pressure variations during north-ward IMF conditions. In particular, we analyzed the geo-magnetic field variations observed on 16 July 2000, in cor-respondence to the passage at the Earth’s orbit of the tail of the 15–16 July coronal ejecta; during the analyzed time
in-1150 P. Francia et al.: Geomagnetic field fluctuations during the July 2000 ejecta passage terval, the magnetosphere was recovering from a major
ge-omagnetic storm (with the Dst index reaching 300 nT ). For
this study, we used geomagnetic field data from several sta-tions located approximately along two latitudinal arrays, in Europe and in Asia, both spanning from low to auroral lati-tudes and separated by approximately 6–8 h in magnetic local time.
A very strong similarity of the geomagnetic field varia-tions at all the stavaria-tions, independent of latitude and mag-netic local time, emerges, suggesting that the magnetosphere, when excited by variations of the SW pressure, exhibits a global response. In particular, we find that highly coher-ent fluctuations at the same discrete frequencies (1.8 and 3.6 mHz) are observed simultaneously at the different sta-tions along the two arrays (situated in the local morning and in the local afternoon), in correspondence to an impul-sive variation of the SW pressure; the frequencies of the ob-served fluctuations correspond, within the statistical uncer-tainty (∼0.14 mHz), to the frequencies of the magnetospheric cavity/waveguide modes (Samson et al., 1991, 1992; Harrold and Samson, 1992; Walker et al., 1992; Ziesolleck and Mc-Diarmid, 1994, 1995; Mathie et al., 1999). We note that the SW speed in the period of interest is very high (∼800 km/s), so we could expect the magnetopause to be unstable to shear-flow instabilities on both flanks and to amplify the waveg-uide modes set up by the SW pressure variation (Mann et al., 1999; Mathie and Mann, 2000).
Along the European array, situated in the local morning, the 1.8 mHz mode is highly coherent, without any signifi-cant phase difference, and its power increases with increas-ing latitude through the whole latitudinal extension, as can be expected for a dominantly compressional mode. As for the 3.6 mHz mode, we find it interesting to observe that its characteristics appear to change from the latitude of NUR (∼57◦), where its amplitude is maximum; indeed, the co-herence between different couples of adjacent stations, very high at lower latitudes, between NUR and SOD, strongly de-creases. The results of a cross-spectral analysis conducted between the stations of NUR and SOD, with the evaluation of the spectral ratio and phase difference, indicate at about 3 mHz the characteristic behaviour of local field line reso-nant phenomena (Waters et al., 1991; Menk et al., 2000). In this sense, we suggest a coupling between the global magne-tospheric compressional mode at 3.6 mHz and the local field line resonance at latitudes of the order of 60◦.
Along the Asiatic array, located in the local afternoon, up to the latitude of ZYK (60◦), the power of both modes
increases with increasing latitude, and the fluctuations are highly coherent and do not show any significant phase dif-ference, indicating that the compressional modes do not cou-ple with local field line resonances. We also found that at the highest latitude station CHD (65◦), the power is lower and the fluctuations are decoupled from those detected at lower latitudes. Previous studies have shown that the fluc-tuation power level is maximum at the latitude of the cusp (Matthews et al., 1996; Yagova et al., 2002) and that the cor-relation between fluctuations at auroral and polar cap
lati-tudes is really poor (Yagova et al., 2002); in this sense, our results seem to indicate that ZYK could be close to the au-roral oval, whose position depends on geomagnetic activity, expanding to lower latitudes as activity increases (Kamide, 1988), and that CHD could be located at the footprint of open field lines. It is remarkable that in the same hours, the SW pressure shows several variations that find a correspondence in the H component variations only at CHD; this finding seems to suggest that, in the recovery phase of a major storm, the response of the geomagnetic field to SW pressure varia-tions is generally masked by the effects of magnetospheric storm-substorm current systems, so it can be detected only at the footprint of the outermost field lines, which are close to the magnetopause.
Some hours later, i.e. just after the local noon along the Eu-ropean array and in the premidnight sector along the 210 MM array, there is another time interval during which the SW pressure shows large variations; in this case, they find a close correspondence with the H component variations at all sta-tions, indicating a global response to the external continu-ous stimulations. Along the 210 MM array, the ground re-sponse does not show a clear latitudinal dependence. Con-versely, along the European array, the amplitude of the re-sponse grows monotonically with the geomagnetic latitude from ∼21 nT/(nPa)1/2to ∼53 nT/(nPa)1/2; this result could be explained by taking into account that at higher latitudes, the geomagnetic field lines are closer to the current sys-tems, both in the high-latitude ionosphere and on the mag-netopause, which vary with varying SW pressure and are re-sponsible for the variation of the ground H component in the dayside sector (Russell and Ginskey, 1995; Francia et al., 1999). The latitudinal increase of the response becomes more steep at a latitude of ∼55◦, roughly corresponding to the position of the plasmapause during disturbed magneto-spheric conditions (Chappell et al., 1970).
We note that the response at AQU is slightly higher than the one found at the same local time and station in a previous statistical analysis (Francia et al., 1999); also, at subauroral latitudes, the response, both just after local noon (at NUR) and before midnight (at MGD), is considerably higher than that found statistically at the same latitudes by Russell and Ginskey (1995); these results could be understood by taking into account that the event analyzed in this study occurs dur-ing summer, when the ionospheric conductivity is maximum.
Acknowledgements. This research activity at L’Aquila is supported
by MURST and GIFCO/CNR. The authors thank A. De Sanctis (INGV) for providing geomagnetic data from CTS; P. Hejda, G. Schultz, O. Rasmussen, K. Pajunpaa and J. Kultima for geomag-netic data from the INTERMAGNET stations BDV, NGK, BFE, NUR and SOD; D. J. McComas and N. Ness for ACE data; the CPMN Group (Kyushu University) and STEL Group (Nagoya Uni-versity) for the 210 MM magnetic observations.
Topical Editor G. Chanteur thanks K. Takahashi and F. Menk for their help in evaluating this paper.
P. Francia et al.: Geomagnetic field fluctuations during the July 2000 ejecta passage 1151
References
Baransky, L. N., Borovkov, J. E., Gokhberg, M. B., Krylov,S. M., and Troitskaya, V. A.: High resolution method of direct measure-ment of the magnetic field lines eigenfrequencies, Planet. Space Sci., 33, 1369–1374, 1985.
Chappell, C. R., Harris K. K., and Sharp, G. W.: The reaction of the plasmapause to varying magnetic activity, particle and fields in the magnetosphere, McCormac, B. M. (Ed.), Dordrecht, D. Reidel, 148, 1970.
Chen, L. and Hasegawa, A.: A theory of long period metic pulsa-tions, 1, steady state excitation of field line resonance, J. Geo-phys. Res., 79, 1024–1037, 1974.
Chisham, G. and Orr, D.: A statistical study of the local time asym-metry of Pc 5 ULF wave characteristics observed at midlatitudes by SAMNET, J. Geophys. Res., 102, 24 339–24 350, 1997. Francia, P. and Villante, U.: Some evidence of ground power
en-hancements at frequencies of global magnetospheric modes at low latitude, Ann. Geophysicae, 15, 17–23, 1997.
Francia, P., Lepidi, S., Villante, U., Di Giuseppe, P., and Lazarus, A. J.: Geomagnetic response at low latitude to continuous solar wind pressure variations during northward interplanetary mag-netic field, J. Geophys. Res., 104, 19 923–19 930, 1999. Harrold, B. G. and Samson, J. C.: Standing ULF modes of the
mag-netosphere: a theory, Geophys. Res. Lett., 19, 1811–1814, 1992. Gonzalez, W. D., Tsurutani, B. T., and Clua de Gonzalez, A. L.: Interplanetary origin of geomagnetic storms, Space Science Rev., 88, 529–562, 1999.
Kamide, Y.: Electrodynamic processes in the Earth’s ionosphere and magnetosphere, Kyoto Sangyo Univ. Press, 1988.
Kamide, Y., Baumjohann, W., Daglis, I.A., et al.: Current under-standing of magnetic storms: storm-substorm relationship, J. Geophys. Res., 103, 17 705–17 728, 1998.
Kivelson, M. and Southwood, D.: Resonant ULF waves: a new interpretation, Geophys. Res. Lett., 12, 49–52, 1985.
Kivelson, M. and Southwood, D.: Coupling of global magneto-spheric MHD eigenmodes to field line resonances, J. Geophys. Res., 91, 4345–4351, 1986.
Lepidi, S., Francia, P., Villante, U., Meloni, A., Lazarus, A. J., and Lepping, R. P.: The Earth’s passage of the April 11, 1997 coronal ejecta: geomagnetic field fluctuations at high and low latitude during northward interplanetary magnetic field conditions, Ann. Geophysicae, 17, 1245–1250, 1999.
Mann, I. R., Wright, A. N., Mills, K. J., and Nakariov, V. M.: Ex-citation of magnetospheric waveguide modes by magnetosheath flows, J. Geophys. Res., 104, 333–353, 1999.
Matthews, D. L., Ruohoniemi, J. M., Dudeney, J. R., Farrugia, C. F., Lanzerotti, L. J., and Friis-Christensen, E.: Coniugate cusp-region ULF pulsation responses to the solar wind event of May 23, 1989, J. Geophys. Res., 101, 7829–7841, 1996. Mathie, R. A., Mann, I. R., Menk, F. W., and Orr, D.: Pc5 ULF
pulsations associated with waveguide modes observed with the IMAGE magnetometer array, J. Geophys. Res., 104, 7025–7036, 1999.
Mathie, R. A. and Mann, I. R.: Observations of Pc5 field line res-onance azimuthal phase speeds: a diagnosis of their excitation mechanism, J. Geophys. Res., 105, 10 713–10 728, 2000. Menk, F. W., Orr, D., Clilverd, M. A., Smith, A. J., Waters, C. L.,
Milling, D. K., and Fraser, B. J.: Monitoring spatial and temporal variations in the dayside plasmasphere using geomagnetic field line resonances, J. Geophys. Res., 104, 19 955–19 969, 1999.
Menk, F. W., Waters, C. L., and Fraser, B. J.: Field line resonances and waveguide modes at low latitudes. 1. Observations, J. Geo-phys. Res., 105, 7747–7761, 2000.
Ogilvie, K. W. and Burlaga, L. F.: A discussion of interplanetary postshock flows with two examples, J. Geophys. Res., 79, 2324– 2330, 1974.
Radoski, H. R.: A theory of latitude dependent geomagnetic mi-cropulsations: the asymptotic fields, J. Geophys. Res., 79, 595– 603, 1974.
Rostoker, G. and Sullivan, B. T.: Polarization characteristics of Pc5 magnetic pulsations in the dusk hemisphere, Planet. Space Sci., 35, 429–438, 1987.
Russell, C. T. and Ginskey, M.: Sudden impulses at subauroral lat-itudes: response for northward interplanetary magnetic field, J. Geophys. Res., 100, 23 695–23 702, 1995.
Russell, C. T., Ginskey, M., and Petrinec, S. M.: Sudden impulses at low latitude stations: steady state response for northward inter-planetary magnetic field, J. Geophys. Res., 99, 253–261, 1994. Samson, J. C., Greenwald, R. A.,Ruohoniemi, J. M., Hughes, T. J.,
and Wallis, D. D.: Magnetometer and radar observations of MHD cavity modes in the Earth’s magnetosphere, Can. J. Phys., 69, 929–937, 1991.
Samson, J. C., Harrold, B. G., Ruohoniemi, J. M., Greenwald, R. A., and Walker, A. D. M.: Field line resonances associated with MHD waveguides in the magnetosphere, Geophys. Res. Lett., 19, 441–444, 1992.
Shimazu, H., Araki, T., Kamei, T., and Hanado, H.: A symmetric appearence of Pc5 on dawn and dusk side associated with solar wind dynamic pressure enhancement, J. Geomag. Geoelect., 47, 177–189, 1995.
Sibeck, D. G., Baumjohann, W., Elphic, R. C., Fairfield, D. H., Fennell, J. F., Gail, W. B., Lanzerotti, L. J., Lopez, R. E., Luehr, H., Lui, A. T. Y., Maclennan, C. G., McEntire, R. W., Potemra, T. A., Rosenberg, T. J., and Takahashi, K.: The magnetospheric response to 8-minute period strong amplitude upstream pressure variations, J. Geophys. Res., 94, 2505–2519, 1989.
Southwood, D. J.: Some features of field line resonances in the magnetosphere, Planet. Space Sci., 22, 482–491, 1974.
Takahashi, K.: ULF waves: 1997 IAGA division 3 reporter review, Ann. Geophysicae, 16, 787–803, 1998.
Villante, U., Francia, P., Lepidi, S., De Lauretis, M., Pietropaolo, E., Cafarella, L., Meloni, A., Lazarus, A. J., Lepping, R. P., and Mariani, F.: Geomagnetic field variations at low and high latitude during the January 10–11, 1997 magnetic cloud, Geophys. Res. Lett., 25, 2593–2596, 1998.
Villante, U., Francia, P., and Lepidi, S.: Pc5 geomagnetic field fluc-tuations at discrete frequencies at a low latitude station, Ann. Geophysicae, 19, 321–325, 2001.
Walker, A. D. M., Ruohoniemi, J. M., Baker, K. B., Greenwald, R. A., and Samson, J. C.: Spatial and temporal behavior of ULF pulsations observed by Goose Bay HF radar, J. Geophys. Res., 97, 12 187–12 202, 1992.
Waters, C. L., Menk, F. W., and Fraser, B. J.: The resonance struc-ture of low latitude Pc3 geomagnetic pulsations, Geophys. Res. Lett., 18, 2293–2296, 1991.
Waters, C. L., Samson, J. C., and Donovan, E. F.: The temporal variation of the frequency of high latitude field line resonances, J. Geophys. Res., 100, 7987–7996, 1995.
Yagova, N., Lanzerotti, L., Villante, U., Pilipenko, V., Lepidi, S., Francia, P., Papitashvili, V., and Rodger, A.: ULF Pc5-6 mag-netic activity in the polar cap as observed along a geomagmag-netic meridian in Antarctica, J. Geophys. Res., in press, 2002.
1152 P. Francia et al.: Geomagnetic field fluctuations during the July 2000 ejecta passage
Ziesolleck, C. W. S. and Chamalaun, F. H.: A two-dimensional ar-ray study of low-latitude Pc5 geomagnetic pulsations, J. Geo-phys. Res., 98, 13 703–13 713, 1993.
Ziesolleck, C. W. S. and McDiarmid, D. R.: Auroral latitude Pc5 field line resonances: quantized frequencies, spatial
character-istics and diurnal variations, J. Geophys. Res., 99, 5817–5830, 1994.
Ziesolleck, C. W. S. and McDiarmid, D. R.: Statistical survey of auroral latitude Pc5 spectral and polarization characteristics, J. Geophys. Res., 100, 19 299–19 312, 1995.