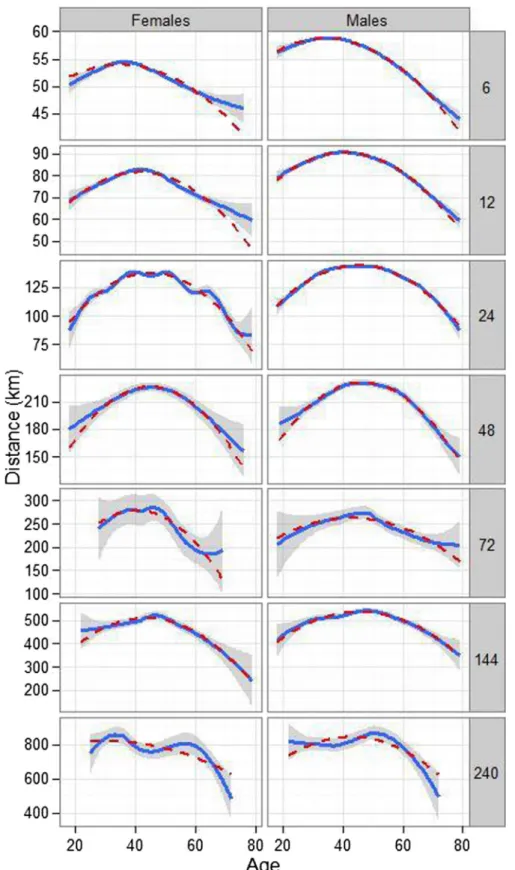
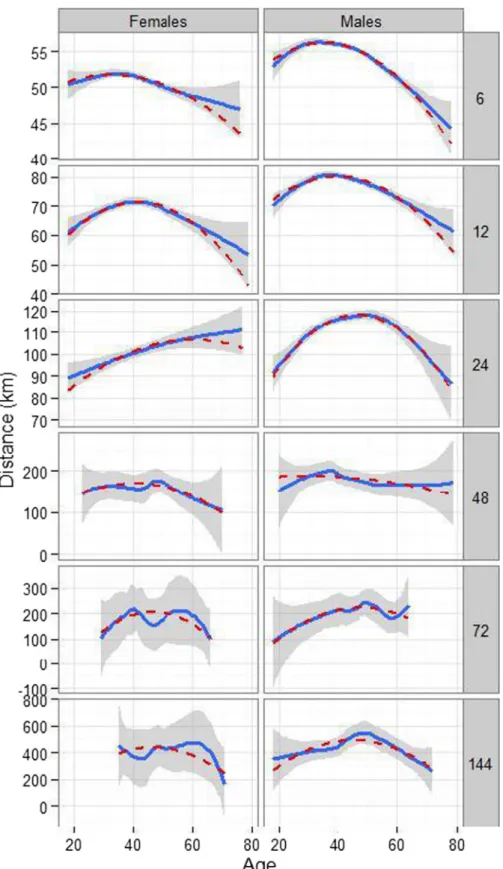
What is the age for the fastest ultra-marathon performance in time-limited races from 6h to 10days?
Texte intégral
Figure


Documents relatifs
For each of them the shower arrival direction is obtained and for the subset with the core located inside the array (internal events) the impact point has been
Although those study designs enable to research the effect of pain upon specific cognitive functions (e.g., working memory), researching the presence of pain when performing
Our interest in such a model arises from the following fact: There is a classical evolution process, presented for example in [5], to grow a binary increasing tree by replacing at
In fact, individual history -health & chronic diseases- or personal lifestyle -periodic training conditions, smok- ing, alcohol, etc.- drive the trajectory, meaning that it may
How- ever, Lepers [10] focused on the overall top ten finishers, and it would be interesting to examine if the sex differ- ence in performance for the best swimmers, the best
Conclusions: The gender difference in ultra-cycling performance decreased over the 2001 to 2012 period in the 720-km Swiss Cycling Marathon for the annual top three cyclists and
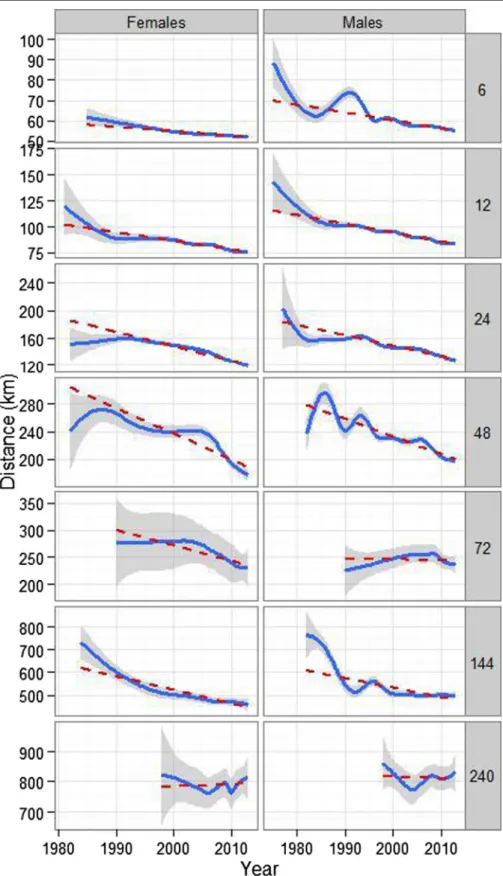
The main findings were for both women and men that (i) the fastest finishers improved their running speeds across years in 50 km and 100 km, but not in 200 km and 1,000 km, (ii) the
The main results of the present study are: (i) the MVC decreases, which were by as much as 35–40% after the race, recovered within 9 days (25–6%), (ii) the aetiology of fatigue
