HAL Id: halshs-03033239
https://halshs.archives-ouvertes.fr/halshs-03033239
Submitted on 1 Dec 2020
HAL is a multi-disciplinary open access archive for the deposit and dissemination of sci-entific research documents, whether they are pub-lished or not. The documents may come from teaching and research institutions in France or abroad, or from public or private research centers.
L’archive ouverte pluridisciplinaire HAL, est destinée au dépôt et à la diffusion de documents scientifiques de niveau recherche, publiés ou non, émanant des établissements d’enseignement et de recherche français ou étrangers, des laboratoires publics ou privés.
Designing Preference Voting
Philipp Harfst, Damien Bol, Jean-François Laslier
To cite this version:
Philipp Harfst, Damien Bol, Jean-François Laslier. Designing Preference Voting. Electoral Studies, Elsevier, 2021, 69, �10.1016/j.electstud.2020.102262�. �halshs-03033239�
Designing Preference Voting
1 Philipp Harfst2 Damien Bol3 Jean-François Laslier4 November, 2020 AbstractElectoral systems in which voters can cast preference votes for individual candidates within a party list are increasingly popular. To the best of our knowledge, there is no research on whether and how the scale used to evaluate candidates can affect electoral behavior and results. In this paper, we analyze data from an original voting experiment leveraging real-life political preferences and embedded in a nationally representative online survey in Austria. We show that the scale used by voters to evaluate candidates makes differences. For example, the possibility to give up to two points advantages male candidates because male voters are more likely to give ‘zero points’ to female candidates. Yet this pattern does not exist in the system in which voters can give positive and negative points because male voters seem reluctant to actively withdraw points from female candidates. We thus encourage constitution makers to think carefully about the design of preference voting.
Keywords: Electoral system; Proportional representation; Preference voting; Approval voting; experiment; Austria
1
Please refer to the final version of this paper, which will be published in Electoral Studies.
2 Technische Universität Dresden, Germany. 3 King’s College, London, UK.
Introduction
A majority of countries in Europe and Latin America, as well as many in other parts of the world, use proportional representation (PR) to elect national representatives (Bormann and Golder 2013). In these systems, individuals can usually cast a vote for a party list. A growing number of countries also gives them the possibility to express a preference for candidates within the list. These preference votes are then used to decide the set of elected candidates, which sometimes differs from the list ordering decided by the party. This option naturally feels more democratic, as voters have larger expressive possibilities, and effectively have a greater impact on the final electoral outcome (Colomer 2011; Karvonen 2010). Facing growing political distrust, many constitution makers throughout the world have thus decided to reform electoral systems to introduce preference voting, or to increase the influence of preference-voting results on who is elected (Bedock 2017; Dalton 2004; Renwick and Pilet 2016). For example, in 2003 Belgium reformed its electoral system to give twice as much weight to preference votes relative to the list ordering.
There is a large literature on the effects of electoral systems on voting behavior and election results (for a compilation of the most influential papers on the topic, see Farrell and Shugart 2012). For a long time, most studies have focused on the inter-party consequences of electoral systems such as how they affect the number of elected parties (Duverger 1951; Lijphart 1994), or polarization (Cox 1990; Matakos, Troumpounis, and Xefteris 2016). More recently, in parallel to the rapid proliferation of PR systems with preference voting throughout the world, scholars in the field have turned their attention to the intra-party consequences of election systems such as how they affect the type of candidates recruited by parties (André, Depauw, and Deschouwer 2014; Shugart, Valdini, and Suominen, 2005), the nature of their work (André, Depauw, and Martin 2015; Crisp et al 2004), or the focus of the campaigns (Bowler and Farrell 2011; Sudulich and Trumm 2019). However, this strand of literature usually focuses on the effect of the very possibility for voters to cast a preference vote compared to closed-list PR systems, i.e., those in which voters can only vote for a party list, without entering into the details of the preference-voting system.
To the best of our knowledge, there are very few studies that focus on the precise method used to cast preference votes, such as the scale of points that voters can use to support candidates. This question is crucial, and not only for intellectual curiosity: although this is rarely discussed, democracies do use different scales. For example, in Belgium, voters can decide to approve as many candidates as they want; in Switzerland and Luxembourg, they can give up to two points; and in
Latvia and in the Soviet Union (in the 1980s), they can give them a positive or negative point. This last scale is particularly interesting, as it could be one that naturally fits the evolution of public opinion in certain countries that is heading to an increase in skepticism towards politicians (Norris 2011) and in affective polarization between ideological camps (Boxel, Gentzkow, and Shapiro 2020). Therefore, given that different scales co-exist in reality and that they are under-researched, it is of upmost importance to evaluate the consequences of preference-vote designs for electoral behavior and results, as well as their respective advantages, as for constitution makers to design electoral institutions in a way that is informed by scientific evidence.
To achieve this goal, we conducted an original voting experiment embedded in a nationally representative online survey in Austria, a country that uses PR with preference voting. A few months after the 2017 national election, we reproduced the ballot of the election in terms of party list and candidates, and asked participants to vote as if they were in the ballot box again. The experiment thus relied on real-life political preferences, which ensures its realism. We are interested in rules where voters evaluate each candidate on their list independently. The treatment randomly assigned to participants was the scale used to evaluate the candidates within the chosen party list.5 We considered three such scales:
The one with possibility to approve or not each of the candidate [0,1], that we label Approval Voting AV[0,1];6
The one with the possibility to give negative on top of positive points [-1,0,1], that we label Evaluative Voting EV[-1,0,1];
The one with the possibility to give up to two points [0,1,2], that we label Evaluative Voting EV[0,1,2].
5 In our experiment, we gave the possibility to subjects to give a preference vote to each of the candidate of the party list. Note that in reality in most preference-voting systems, the number preference vote is limited to one (e.g., Netherlands or Brazil). We decided not to put any limit for a pragmatic reason related to statistical power. Letting subjects cast a single vote would have given us only limited information about their preference since we were not in the position to decide on the number of subjects (the experiment was embedded in a survey conducted by a separate organization, see below). Yet, we believe our experiment can still inform the reality of elections held systems in which preference voting is limited in the sense that we can think our experimental design as a series of elections in which the subjects choose to support or not each of the candidates appearing on the list. Moreover, a recent experiment with Dutch subjects shows that most voters do not substantially alter their vote when they are granted with the possibility to cast multiple preference votes (Nagtzaam and van Erkel (2017)
6 Strictly speaking, approval voting is an electoral system in which voters decide to approve or not each of the competing candidates (not only those from their favorite party list), and in which a single candidate, the one with most approvals, is elected. Approval voting has attracted a lot of scholarly attention because it is often considered as producing outcomes closer to voters’ preferences, although it is almost never used in reality (Laslier and Sanver 2010). The electoral system used in Austria (and many other countries using PR with preference voting) can be seen as a derivative of approval voting in the sense that voters decides to approve one candidate within their favorite party list, and those with the most approvals are elected.
With the data generated by this experiment, we can assess how these three preference-voting scales affect the fate of candidates. Although the scales can be considered as mere linear transformations of each other (although there are two categories in AV[0,1] and three in the two others), we find that some candidates receive more preference votes under some scales. This suggests that the numbers associated to categories matter in the eyes of voters and can distort preference votes. We investigate the sources of these differences in two ways. First, we examine whether some of the 120 candidates included in the experiment are (dis)advantaged by some scales depending on their personal characteristics appearing on the ballot or not (gender, age, and academic title). We show that male candidates are better off under the one with the possibility to give two points because some voters seem to be reluctant to give the maximum number of points to female candidates.
Second, we analyze whether these effects are driven by certain subsets of the electorate. We follow the literature on affinity voting and hypothesize that voters are more likely to favor candidates with whom they share characteristics like gender (Sanbonmatsu 2002) or other socio-demographics (Cutler 2002). We find some evidence for affinity voting, and more importantly for the purpose of this paper, some evidence for interaction between affinity voting and the scale. For example, we find that evaluate voting scales gave advantages to male candidates. The reason lies in affinity voting, and the propensity of male voters to give the minimum number of votes to female candidates and the maximum number to male candidates. Yet this effect is weaker under the evaluative voting system in which voters can give negative points. Male voters seemed reluctant to give ‘minus one’ to female candidates, which attenuates their disadvantage. Taken together, our findings have important implications for constitution makers: the details in the design of preference voting can give an unfair advantage to candidates based on their gender, or other personal characteristics.
Preference voting in the literature
PR systems in which voters can cast preference votes to individual candidates within party lists are increasingly common in democracies throughout the world (Renwick and Pilet 2016). These preference-voting systems naturally feel more democratic than closed-list systems because voters have more influence over the electoral results and the identity of the candidates seating in parliament (Colomer 2011; Karvonen 2010). People’s self-reported satisfaction level, as well as actual voter turnout, is substantially higher in countries using these systems (Farrell and McAllister 2006; Sanz 2017). Also, when they are asked which system they like the most, about two thirds of
individuals say that they prefer preference voting to a closed-list system (Laslier et al. 2015). A reason is probably that preference-voting results are quite influential, even beyond the election of parliamentary representatives. In many countries, a candidate who receives a high preference score is also likely to become minister or be appointed to a leading position within the party (André et al. 2017; Bol et al. 2018; Folke, Persson, and Rickne 2016; Meriläinen and Tukiainen 2018). Preference voting can thus serve to hold individual politicians’ accountable (Folke and Rickne 2020).
However, preference-voting systems can also have undesired effects. Since voters can vote for individual candidates and the election of these candidates depends at least partially on these votes, there is some level of intra-party electoral competition (Carey and Shugart 1995, for a counter argument see Cheibub and Sin 2020). Candidates, even those from the same party, are effectively in competition with one another for the popular votes. This means that they have incentives to engage into corruption and patronage to differentiate themselves from other co-partisan candidates or to finance their individual electoral campaigns (Chang and Golden 2005; Ames 1995). Studying the functioning of preference voting is thus of tremendous importance.
How do individuals decide for whom to cast a preference vote? Vote choice in general is a function of partisan preferences, in the sense that individuals tend to vote for the candidates of the party they like the most, to which they feel the closest ideologically, or the one that they believe is best for some important issues like the economy (Campbell et al 1960). Partisan preferences are deeply interiorized by individuals, so that it is impermeable to external stimuli and remains stable throughout a lifetime (Bartels 2002; Schickler and Green 1997).
Yet with preference voting, all the candidates for whom one can potentially vote are from the same party.7 In a context of limited partisanship, voters tend to rely on the personal characteristics of candidates to make up their mind (McDermott 1997).8 These include their gender (Golder et al. 2017; McElroy and Marsh 2010), physical appearance (Berggren, Jordahl, and Poutvaara 2017; Rosar, Klein, and Beckers 2008), or geographical roots (Bol et al. 2016; Jankowski 2016). Evidence
7 We do not consider here the possibility of panachage. This possibility is effectively rarely used (but examples include Luxembourg and Switzerland) and raises further questions that are out of the scope of this paper.
8 Note that a context in which there is a particularly salient issue that divides parties, in the sense that some candidates are in favor of it whereas some are not, like Brexit in the United Kingdom, voters can use preference votes to favor the candidates who are on the same side of the issue than them (Blumenau et al 2017). Yet, in more normal contexts, defecting from the official party line does not seem to increase the probability for a candidate to receive more preference votes (Folke and Rickne 2020).
suggests the existence of a phenomenon called ‘affinity voting’, in which voters favor candidates with whom they share personal characteristics, supposing that these candidates would best serve their interests. These characteristics include gender (Dolan 2008; Sanbonmatsu 2002), ethnic background (McDermott 1998), socio-demographics at large (Cutler 2002), and pure facial resemblance (Bailenson et al. 2008). In turn, these shortcuts may or may not serve as effective heuristics in the perspective of choosing the candidates that is best for them (Lupia 1994; Popkin 1991).
Nevertheless, there is very little research on the effect of the method or scale used for preference voting in PR systems on voting behavior, and particularly how it interacts with the personal characteristics of the candidates. A reason could be that cross-national observational studies on the topic are made very difficult due to the variety of systems used in reality. Most countries seem to have a unique preference-voting method. For example, in local elections in Italy, voters can cast up to two votes, but only if they vote for candidates of different genders. This is a very specific system that is not used anywhere else in the world (Baltrunaite et al. 2019). In Belgium and the Netherlands, two countries that share a remarkedly similar political system, the preference-voting method is substantially different. In Belgium, voters can approve any of the competing candidates, but can also decide to approve the entire party list (which is different from approving each candidate of the list). In the Netherlands, this last possibility does not exist, and voters can only approve one single candidate in the entire party list (Nagtzaam and van Erkel 2017). Because most countries differ on multiple dimensions of the preference-voting method, cross-national observational studies can hardly disentangle the effects of each of these dimensions.
To our knowledge, the very few studies on the topic that use an experimental design ask individuals to vote for real candidates or parties under various methods or scales, and then evaluate how electoral behavior and results change with these methods/scales. With this design, they leverage real-life political preferences, which increases the external validity of the results. Note however that none of them did so in in the context of PR with preference voting. Baujard et al. (2017) for example asked a sample of French voters to evaluate the candidates to the 2012 presidential election using various scales including those covered in the present study such as the one in which voters can give a negative point. They show that although these scales affect the way subjects evaluate some of the candidates, the aggregate result remains unchanged. This is because (1) there is only one candidate elected in a presidential election, and (2) in this highly salient election subjects have strong preferences in favor or against a few candidates, and these preferences are not altered by
differences in preference scales. Darmann, Grundner, and Klamler (2017) conducted a similar voting experiment in the state of Styria in Austria in 2015. They asked subjects to evaluate the main Austrian political parties using several preferential-voting scales. They also find that, although some scales advantage some of the parties, they do not change the aggregate result.9
The voting experiment conducted for the present paper builds on the experiments presented above but brings three key contributions to the study of preference voting. First, the context is truly one of PR with preference voting. We asked subjects to vote for individual candidates within a party list using various preference-voting scales. This is important because just like in real life, the candidates among whom they had to choose shared the same partisan affiliation, which forced them to rely on other heuristics than partisanship such as candidates’ personal characteristics. It is reasonable to think that these preferences are more likely to be affected by differences in scales than deeply interiorized partisan preferences. Also, PR with preference voting implies that several candidates are elected to form the parliament. The scales are thus more likely to make differences in the final electoral result, not in terms of party composition but in terms of who is seating. Even if they do not change whether the most popular candidates are elected, they can change the fate of less-known candidates.
Second, by virtue of the design, the experiment includes 120 real candidates. Contrary to other experimental studies that only analyze attitudes towards a few candidates, we are able to evaluate patterns in votes depending candidates’ personal characteristics like their age, gender, and academic title. Third, our voting experiment is conducted on a representative sample of the voting-age population in Austria, instead of an ad hoc or self-selected sample of subjects. This is important because it means that our treatment effects can be generalized beyond the group of individuals willing to volunteer to participate in these types of studies, who are probably those who are the most interested in politics or scientific experimentation.
Experimental design
We conducted a voting experiment with a nationally representative sample of Austrian adults in August 2018. It was embedded in a web-based survey organized by Statistik Austria, and part of the
9 Other similar voting experiments focusing on the comparison between one preference-voting method and another one like a closed-list system include Alòs-Ferrer and Granić (2012); Baujard et al (2014); Bol et al (2016); Blumenau et al (2017); Nagtzaam and van Erkel (2017).
PUMA scheme.10 For the experiment, we created a ballot similar to the one of the legislative election that took place in October 2017.11 In this election, Austria uses a PR system with preference voting: voters first choose one party, and can then approve one of the candidates listed in the corresponding party list. Parties receive a number of seats that is proportional to their vote share, and the candidates with most preference votes receive these seats.12 Thus, in our experiment, we first asked subjects to vote for one of the main Austrian parties. We included the eight parties with more than 0.5% of the votes in the 2017 election (ÖVP, SPÖ, FPÖ, NEOS, PILZ, GRÜNE, GILT and KPÖ). In a second stage, we showed on the screen the first 15 candidates who appeared on the 2017 national-constituency list of the chosen party, and asked subjects to cast a preference vote for each of them. Note that the total number of candidates included in the experiment is 120 (15 candidates x 8 parties), but each subject only saw the 15 candidates of the party they picked in the first stage.13 In order to account for any list-ordering effect, we randomized the position of the candidates on the list for each subject.
The experimental treatment is the preference-voting method. One third of the subjects (randomly selected) had to decide whether to approve each of the candidates.14 In other words, they could give them either 0 or 1 point.This scale is common in PR system with preference voting. For example, it is the one used in Belgium and Brazil. We call it AV[0,1]. Another third of the respondents (randomly selected) could give 0, 1, or 2 points to the candidates. This is a scale that is used in Switzerland and Luxembourg for example. We call it EV[0,1,2]. Finally, the last third of the respondents could give a positive, a negative, or no point to the candidates. This is a
10 See https://www.puma-plattform.at/en/home/ for details about the scheme. A detailed description of the experiment that follows APSA’s standards is provided in A1.
11 Note that the online format of the experiment has a clear advantage here: we were able to reproduce a ballot similar to a real-election ballot on the subjects’ screen, while randomly manipulating some of the aspects of this ballot. This would not have been possible with a telephone survey for instance.
12 Like in most PR with preference voting systems, the election of candidates does not only depend on the results of the preference vote, it also depends on the list ordering of the candidates as decided by the party. Yet, from the perspective of a voter, the existence of list ordering does not change that a preference vote increases the probability of a candidate to be elected. Note also that a specificity of the system used in legislative elections in Austria is that voters can express a preference vote in three party lists, one for each constituency level (national, state, and sub-state). For practical reasons, we focus in the experiment on the national constituency.
13 The key advantage of relying on real instead of hypothetical candidates is that we leverage real political preferences, which increases the external validity of our results. The disadvantage is that we cannot experimentally manipulate the personal characteristics of the candidates and disentangle the effect of each of them. To address this issue, we include all of the observable personal characteristics of the candidates in the same regression, as to estimate the unique effect of each of them.
14 Note that unlike other voting experiments of the same kind, each subject had to vote according to one of the three scales, instead of all of them one after the other (Baujard et al 2017; Darmann, Grundner, and Klamler 2017). We believe our design is superior as it shuts down possible contamination effects between treatments. Asking subjects to vote according to different methods one after the other could create biases in results, for example because some could be willing to report different votes with different methods to please the experimenter (or the way round, trying to be consistent across methods).
voting method used in Latvia, and in the 1980s in the Soviet Union. We call it EV[-1,0,1]. In each treatment, voters could only proceed to the next page when they manually filled in evaluations for each of the party’s 15 candidates. In order to ensure the simplicity of the experiment and thus subjects’ understanding, we decided not to give a detailed explanation of how preference votes would be counted to elect representatives in these three scales. We only informed voters that the total sum of points decides on the election of individual candidates. We can reasonably expect that Austrian voters are familiar with the concept of preference voting, and that they thought that just like in the 2017 election, the more points they gave to a candidate, the more likely this candidate would have been elected. A2 shows the results of a balance test. The assignment of treatments is neither substantially nor statistically related to observable characteristics of experimental subjects (age, gender, education, political knowledge, interest in politics, left-right self-placement, and party choice).
The sample is composed of 617 eligible Austrian voters that are representative of the adult population of the country in terms of age, gender, and education.15 Among them, 456 declared having voted in the 2017 election, are thus included in the analysis. A3 shows the descriptive statistics, and A4 a comparison with census data from Austria on key socio-demographics. The differences between the sample and the population of interest are small, although we find that young and highly-educated voters are slightly over-represented. A5 reports the distribution of parties’ vote share in the sample and in the 2017 election. We observe that the largest difference between the two is for the ÖVP (-10 points) and the FPÖ (4 points). The scores of other parties are fairly close to the 2017’s benchmark. The discrepancies we observe are probably due to the timing of the survey that was conducted eight months after the election. It is reasonable to think that some voters changed their partisan preferences after the formation of a politically controversial ÖVP-FPÖ coalition and/or some of the decisions that this government made in the meantime. Given that the paper focuses on preference votes for candidates, and not on party votes (actually the treatment was assigned after subjects selected a party), it is not useful to weight the data according to the 2017 election. It would bias the results without increasing the external validity.
15 The sample is only composed of 617 subjects because Statistik Austria only sent the voting experiment to a random subsample of the overall survey sample.
Results
In this section, we present the results of the voting experiment in three steps. First, we describe how experimental subjects used the three scales to cast their preference vote in order to evaluate whether voters use them as if they were mere linear transformations of each other or not. Second, we check how candidates’ personal characteristics affect the number of votes received on each of the three scales, as well as their propensity to receive the minimal and maximum number of points available. To do so, we focus on three characteristics, i.e. gender, age and academic title (BA, Master, PhD, or Professor), that are among the most visible ones, as they either directly appear on the ballot (academic title, age16), or can be easily inferred from names on the ballot paper (gender). A6 reports the descriptive statistics of the 120 candidates included in the experiment on these three characteristics. Note that we cannot assess the effect of (perceived) ethnic background since only seven of the 120 candidates have a name that suggests a non-Austrian one. Finally, in the third and last step, we explore whether the differences observed in the second step are driven by some groups of the electorate. In particular, we follow the literature on affinity voting, and check whether voters are favoring the candidates with whom they share some characteristics, and how this interacts with the preference-voting scale. In particular, we check (1) whether male (female) voters are likely to give more points to male (female) candidates, (2) whether old (young) voters are likely to give more points to old (young) candidates, and (3) whether voters with (without) a university degree are likely to give more points to candidates with (without) an academic title.
How voters used the preference-voting scales
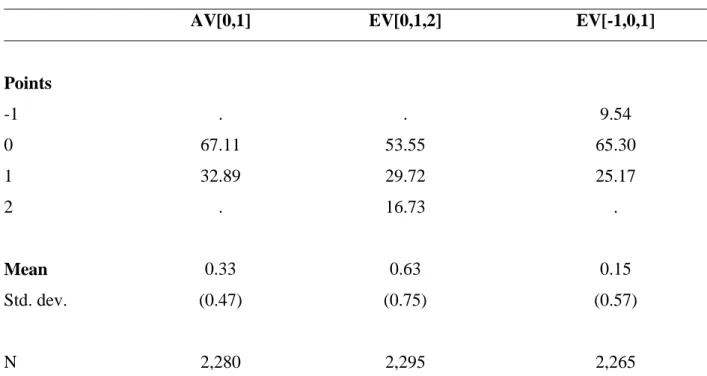
Table 1 presents the proportion of times subjects used each point of the scales, as well as the average number of points received by candidates. As the scales are different, we can expect to find large discrepancies. Yet, it shows that the use of the ‘one point’ and ‘zero point’ options is relatively similar across experimental conditions. First, voters overwhelmingly used these two options even in experimental conditions in which they could use others (more than 80% of the time). Second, about the same proportion of voters gave one point in AV[0,1] and EV[0,1,2] (33 and 30% respectively). Similarly, voters used ‘zero points’ at about the same rate in AV[0,1] and EV[-1,0,1] (67% and 65% respectively).
Table 1. Use of the scales
AV[0,1] EV[0,1,2] EV[-1,0,1]
Points -1 . . 9.54 0 67.11 53.55 65.30 1 32.89 29.72 25.17 2 . 16.73 . Mean 0.33 0.63 0.15 Std. dev. (0.47) (0.75) (0.57) N 2,280 2,295 2,265
Note: Entries are percentages or averages. Standard deviations are in parentheses. The N corresponds to the number of
subjects in each experimental condition times the number candidates appearing on the party list (=15).
The other points on the scales reveal largest discrepancies. First, few voters used the extreme category in EV[0,1,2] and even fewer did so in EV[-1,0,1]. 17% of candidates received ‘two points’ in the former, and only 10% received ‘minus one point’ in the latter. Yet, we believe that the number of negative evaluations is substantial given that we are dealing with preferences for candidates on the party list initially chosen by the voter. Second, although voters seem to use the extreme category at the expense of the ‘zero point’ one in EV[0,1,2] (only 54%), they seem to use it at the expense of the ‘one point’ one in EV[-1,0,1] (only 25%). In particular the comparison between EV[-1,0,1] and EV[0,1,2] suggests that voters did not simply use the scales as mere linear transformations of each other. There seems to be some psychological bias depending on the number that is associated to the category.
Finally, it is important to note the presence of these extreme categories is naturally reflected in the average of number of points received by candidates. The average is the largest in EV[0,1,2] (0.63, sd = 0.75) and the smallest in EV[-1,0,1] (0.15, sd = 0.57). It is important to keep these averages in mind while we compare the effect of personal characteristics on the number of points received by
candidates. The effects can only be compared across experimental conditions with regard to the averages and standard deviations.
Which candidates were advantaged by which scales?
To answer this question, we group candidates by three personal characteristics: gender, age and academic title. We measure gender based on the first name of the candidate, and academic title based on the information put on the ballot. In Austria, candidates add their academic title on the ballot when they have a bachelor’s, master’s or doctoral degree or a professorial title. We measure age based on the date of birth of candidate. Age is a continuous variable but in order to make it comparable to the other two, we split it up in three groups: those who are younger than the 1st quartile of the age distribution of candidates (33.5 years old), those who are older than the 3rd quartile (55 years old), and the rest.
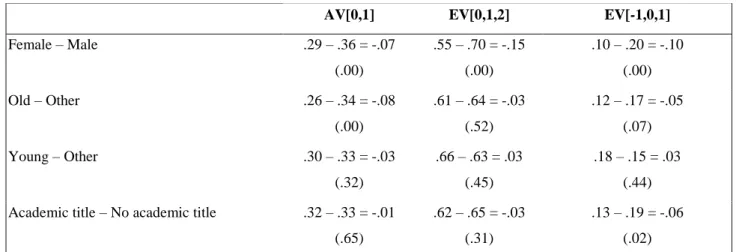
Table 2 presents some bivariate analysis: the average number of points received by each group of candidates by experimental condition. It shows some interesting patterns regarding the popularity of some candidates, as well as how this interacts with the preference-voting scale. First, female candidates received less points than their male counterparts under all three scales. The difference is the largest for EV[0,1,2] and EV[-1,0,1], -0.15 and -0.10 respectively, which are the equivalent of around a fifth of the standard deviation of the distribution of points received by the candidates under these two scales (see Table 1). The difference is smaller for AV[0,1], but it is still -0.07, i.e. 15% of the standard deviation.
Table 2 Number of points received by candidates (bivariate analysis)
AV[0,1] EV[0,1,2] EV[-1,0,1]
Female – Male .29 – .36 = -.07 (.00) .55 – .70 = -.15 (.00) .10 – .20 = -.10 (.00) Old – Other .26 – .34 = -.08 (.00) .61 – .64 = -.03 (.52) .12 – .17 = -.05 (.07) Young – Other .30 – .33 = -.03 (.32) .66 – .63 = .03 (.45) .18 – .15 = .03 (.44) Academic title – No academic title .32 – .33 = -.01
(.65)
.62 – .65 = -.03 (.31)
.13 – .19 = -.06 (.02)
Note: Entries are the average number of points received by candidates with a certain characteristic (example: female)
compared to candidates with another characteristic (example: male). P-values of difference in means t-tests are in parentheses (2-tailed), N = 2,280 (AV[0,1]), 2,295 (EV[0,1,2], and 2,265 (EV[-1,0,1]). Old candidates are those older than 55 years old (3rd quartile), young candidates are those younger than 33.5 years old (1st quartile).
Second, old candidates received slightly less points than other candidates under both AV[0,1] and EV[-1,0,1], -0.8 and -0.05. respectively, which are 17% and 9% of the standard deviation. By contrast, young candidates did not receive less or more points than other candidates. Similarly, the candidate with an academic title only receive slightly less points than candidates without under EV[-1,0,1], -0.06 (11% of the standard deviation).
The result of the bivariate analysis needs to be considered with caution. Because we rely on real candidates, we did not randomize their personal characteristics. There might thus be some underlying patterns that are confounding the results. For example, male candidates might have received more points than female candidates because they are higher in the parties’ internal hierarchy. To have a better idea of the unique effect of each characteristic, we conduct a multivariate analysis, for which we estimate an OLS regression predicting the number of points received by a candidates based on their personal characteristics (age, gender, academic title), the experimental condition, and an interaction between the two. Because the number of points is not perfectly comparable across experimental conditions, we reproduce the analysis with two alternative dependent variables: receiving the maximum number of points on the scale (0-1) and receiving the minimum number of points on the scale (0-1). For these two variables, we use a logit regression. In all three models, we cluster standard errors by candidates and subjects.
We also add some control variables. At the level of the candidate, we control for the incumbency status (member of the national government or parliament or not), and the original position on the party-list in the 2017 Austrian election (as a measure of their popularity).17 For each of these variables, we also add an interaction with the treatment. At the level of the voter, we control for age, gender, education, party choice18, self-declared political interest, self-declared left-right positioning, and political knowledge (based on the number of correct answers to seven quiz questions about politics in Austria). The descriptive statistics of all these variables can be found in A3 and A6.
Figures 1-3 present the quantities of interest, whereas the full regression results are in A7.19 Figure 1 confirms the results of the bivariate analysis presented above: (1) female candidates received less points than their male counterpart, and this difference is particularly large in EV[0,1,2] and EV[-1,0,1], and (2) old candidates and those with an academic title received less points than others under EV[-1,0,1]. What is interesting is that these effects hold even after controlling for other characteristics of candidates.20
17 We acknowledge is not optimal as the effect of the rank on the candidate’s probability of receiving a preference vote is not linear (Devroe and Wauters 2020). Yet we do not have enough candidates to include a set of dummy variables capturing each rank separately (#1, #2, #3…).
18 Note that the variable party choice can be seen as a candidate-level as well as a voter-level variable because each candidate belongs to only one party, while each voter only votes for one party.
19 A8 presents the results of the same regressions in removing the candidates who can be considered as
Spitzencandidates in the 2017 election (that is those at the top of the list). Table A9a and Figure A9b replicate the results of the OLS regression presented in Figure 1 but using standard errors clustered at the respondent level. Results in all cases are similar.
20 Note that the full regression results of A7 reveal that the differences between scales are not statistically significant (see the interactions between the experimental conditions and the personal characteristics of candidates). Although small, we believe the differences between scales are far from being trivial given the design of the study.
Figure 1. Number of points received by candidates (multivariate analysis)
Note: Entries are differences in predicted number of points received between candidates with a certain characteristic (example: female) and candidates with another characteristic (example: male), net of other characteristics. The results are derived from the OLS regression presented in A7. Horizontal bars are 95%-confidence intervals.
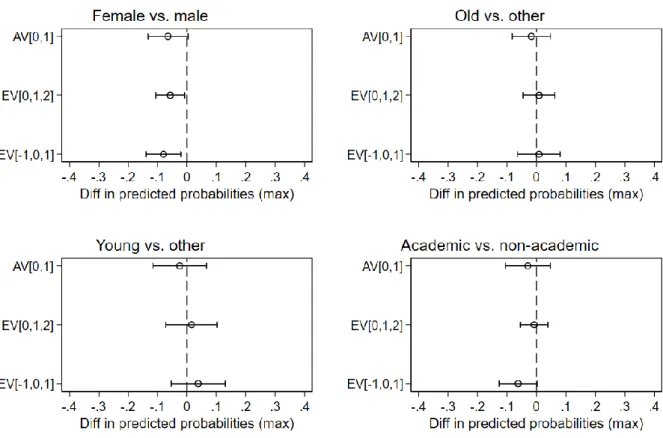
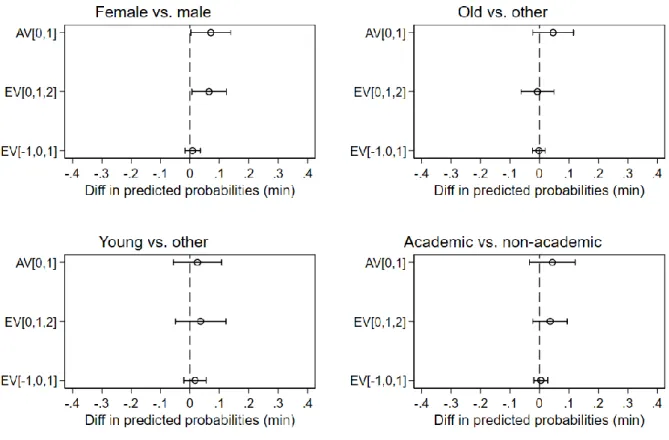
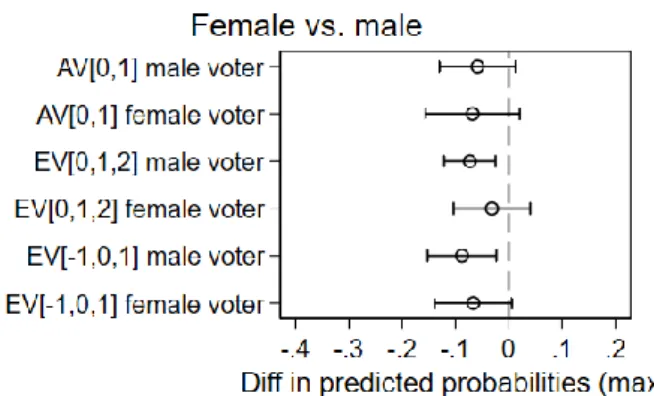
Figures 2 and 3 presents the results from a different angle. They show that female candidates were less likely to receive the maximum number of points (‘two points’ or ‘one point’) than their male counterparts under both EV[0,1,2] and EV[-1,0,1], by 6 and 8% points respectively. Yet, they were only more likely to receive the minimum number of points under EV[0,1,2] (by 6% points). Under EV[-1,0,1], they were as likely as male candidates to receive ‘minus one point’. Similarly, old candidates and those with an academic title were less likely to receive the maximum number of points under this scale, but as likely as others to receive the minimal number of points. Estimates point that the preference-voting scale EV[-1,0,1] leads to some interesting patterns: voters seemed to be reluctant to use the ‘minus one point’ on this scale, which could lead to less discrimination, especially against female candidates. This suggests that the negative charge associated to the category ‘minus one point’ affects patterns of preference votes under this scale. By contrast, the difference in propensity to give the maximum and minimum number of points between male and female candidates is relatively moderate under AV[0,1].
Figure 2. Propensity to receive the maximum number of points (multivariate analysis)
Note: Entries are differences in predicted probabilities of receiving the maximum number of points between candidates
with a certain characteristic (example: female) and candidates with another characteristic (example: male), net of other characteristics. The results are derived from the logit regression presented in A7. Horizontal bars are 95%-confidence intervals.
Figure 3. Propensity to receive the minimum number of points (multivariate analysis)
Note: Entries are differences in predicted probabilities of receiving the minimum number of points between candidates with a certain characteristic (example: female) and candidates with another characteristic (example: male), net of other characteristics. The results are derived from the logit regression presented in A7. Horizontal bars are 95%-confidence intervals.
Which groups in the electorate drive the differences between scales?
As a final step, we replicate the OLS and logit regressions presented above, but in adding triple interactions between candidates’ characteristics, experimental conditions, and voters’ characteristics. In order to keep the analysis as simple as possible, we restrict ourselves to voters’ characteristics that are similar to candidates’ characteristics. In doing so, we effectively test the ‘affinity voting’ hypothesis. To be clear, we reproduce the OLS and logit regressions presented above, in adding a triple interaction with one voter characteristic at a time. Figures 4 to 6 show the quantities of interest, whereas the full results are presented in Tables A10 to A12.
Figure 4 presents the results when we add the triple interaction between candidates’ characteristics and the gender of voters. It provides evidence for affinity voting in the behavior of male voters, but it also shows that the pattern is stronger under some preference-voting scales. Male voters gave less
points to female candidates compared to their male party fellows under all three scales, but especially under EV[0,1,2]. Although the probability to give the maximum number of points is similar across all three scales (male voters being more likely to give the maximum number of points to male candidates and the minimum number of points to female candidates), there are differences when it comes to the probability to give the minimum number of points: male voters seemed reluctant to give ‘minus one point’ to female candidates under EV[-1,0,1], but did not seem to have any problem giving them ‘zero points’ under AV[0,1] and, particularly, EV[0,1,2].
Figure 4. Affinity voting between male/female voters and male/female candidates
Note: Entries are differences in predicted number of points/probabilities of giving the max/min number of points on the
scale between male and female candidates, net of other characteristics. The results are derived from the OLS/logit regressions presented in A10. Horizontal bars are 95%-confidence intervals.
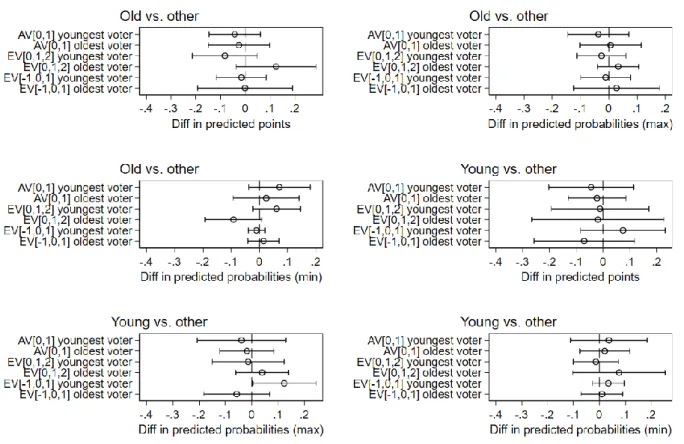
Figures 5 presents the results when we add a triple interaction with the age of voters. In general, we also find evidence for affinity voting, in the sense that the oldest voters gave more points to old candidates than youngest voters (and vice versa).21 Yet, we also find differences between scales,
21 In the regression, we use a continuous measure of age. Yet, in Figure 5, we take the empirical minimum and maximum in the experimental sample to define oldest and youngest voters. Oldest voters are 74 years old (note that
with affinity voting being more pronounced under EV[0,1,2]. Again, this effect is driven by the probability to give the minimum number of points: young (old) voters seemed reluctant to give the minimum number of points to old (young) voters under EV[-1,0,1] (and to some extent under AV[0,1], but not under EV[0,1,2].
Figure 5. Affinity voting between young/old voters and old/young candidates
Note: Entries are differences in predicted number of points/probabilities of giving the max/min number of points on the scale between old and young candidates, net of other characteristics. The results are derived from the OLS/logit regressions presented in A11. Horizontal bars are 95%-confidence intervals.
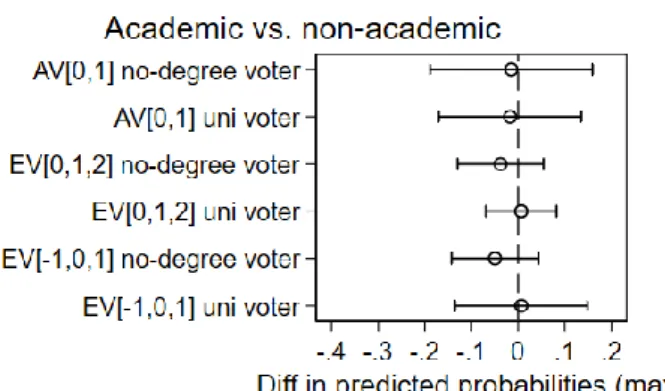
Finally, Figures 6 presents the results when we re-estimate the regression with a triple interaction including voters’ education. Again, we find evidence for affinity voting. Voters who have a university degree gave more points to candidates with an academic title (and vice versa for voters without any school degree), especially under EV[0,1,2], which once more seems to be driven by the reluctance of voters to give the minimum number of points under both EV[-1,0,1] and AV[0,1]. Yet, the results are less clear cut than for age and gender.
there was a single voter with 110 years, but it does not seem realistic), and youngest are 16. In Austria voting age is indeed 16 years old.
Figure 6. Affinity voting between educated/non-educated voters and candidates with/without academic title
Note: Entries are differences in predicted number of points/probabilities of giving the max/min number of points on the
scale between candidate with and without an academic title, net of other characteristics. The results are derived from the OLS/logit regressions presented in A12. Horizontal bars are 95%-confidence intervals.
Conclusion
Many countries that use a PR system also use a system of preference voting, in which voters can vote for individual candidates within their favorite party list. Although there is a vast literature on the advantages and drawbacks for the functioning of elections and democracy of preference voting compared to closed list PR systems, we know very little about the effects of the type of preference voting. Several types indeed co-exist in democracies throughout the world, and yet, this institutional specificity has been overlooked in the literature.
To fill this gap, we conducted a web-based voting experiment with a nationally representative sample from Austria, a country that uses preference voting. We made the subjects cast a preference vote in recreating the ballot of the 2017 national election that occurred just a few months before the experiment. The originality is that we randomized the scale under which they could cast a
preference vote: either approval voting (approving candidates with one point or not) or evaluative voting (EV[0,1,2] with the possibility to give up to two points to candidates; or EV[-1,0,1] with the possibility to give negative as well as positive points). On the ballot, we showed them real candidates that genuinely competed in the 2017 election. We thus leveraged real political preferences to increase the realism of the study. In total, 120 candidates were included in the experiment, which allows us to test how personal characteristics (age, gender, and academic title) affect the number of points they received, and how this interacts with the scale under which the subjects casted their vote.
Our findings confirm our intuition that the scale of preference voting matters for electoral results. We find that some groups of candidates were advantaged by some scales. Female candidates, but also to some extent old candidates and those with an academic title, were hit by evaluative voting systems. These effects were (partly) attenuated in the system in which voters can give positive and negative points. Voters seemed to be reluctant to give ‘minus one point’ to candidates they only dislike because of socio-demographic characteristics. Actively removing candidates from the list appears to represent a higher hurdle than just not supporting someone.
We believe that the effects are informative of the reality of elections in various contexts. First, although we conducted the experiment in a single country, i.e. Austria, we did it with a representative sample of the population, instead of a convenient sample of say students. Second, Austria is an interesting case-study to examine preference voting: the country uses such a system in real-life, which means that citizens are used to cast preference votes. Then, we can reasonably think that the behavior of subjects is more meaningful than it would have been if the experiment would have been conducted in a country that does not use preference voting. In such a country, the behavior of subjects would have been mostly hypothetical. Yet, we cannot discard the possibility that there is something specific about Austria and its political culture that would harm the generalizability of the findings to other countries. Third, in the experiment, we leveraged real-life political preferences in using actual candidates in the ballot instead of fictitious candidates unknown from the subjects. This is yet another important element that increases the realism of the design. Third, although we let subjects vote for as many candidates as they wanted, which is not a very common preference-voting system (for an exception, see Belgium and Latvia), which could have increased subjects’ inclination to base their preference vote on easily accessible characteristics of the candidates like gender, age, and education level, it is important to note that we employed scales that are used in real-life. For these reasons, we do believe that our results are meaningful and
informative. Yet, we acknowledge that the extent to which the differences between scales can affect final electoral results depends on other contextual factors like how much the election of individual candidates also hinges on their rank on the party list or solely on the number of preference votes that they obtained. Overall, we believe our paper opens new avenues for research on the type of preference voting and how it can affect elections and democracy.
References
Alòs-Ferrer, C. & Granić D.-G. (2012) Two Field Experiments on Approval Voting in Germany. Social Choice and Welfare, 39(1), 171-205.
Ames, B. (1995). Electoral Strategy Under Open-List Proportional Representation. American Journal of Political Science, 39(2), 406-433.
André, A., Depauw, S., & Deschouwer, K. (2014). Legislators’ Local Roots: Disentangling the Effect of District Magnitude. Party Politics, 20(6), 904-917.
André, A., Depauw, S., & Martin, S. (2015). Electoral Systems and Legislators’ Constituency Effort: The Mediating Effect of Electoral Vulnerability. Comparative Political Studies, 48(4), 464-496.
André, A., Depauw, S., Shugart, M. S., and Chytilek, R. (2017). Party Nomination Strategies in Flexible-List Systems: Do Preference Votes Matter? Party Politics, 23(5), 589-600.
Bailenson J. N., Iyengar, S., Yee, N. and Collins, N. A. (2008). Facial Similarity Between Voters and Candidates Causes Influence. Public Opinion Quarterly, 72(5), 935-961
Bartels, L. (2002). Beyond the Running Tally: Partisan Bias in Political Perceptions. Political Behavior, 24(2), 117-150.
Baltrunaite, A., Casarico, A., Profeta, P., & Savio, G. (2019). Let the Voters Choose Women. Journal of Public Economics, 180, 104085.
Baujard, A., Gavrel, F., Igersheim, H., Laslier, J.-F., & Lebon, I. (2017). How Voters Use Grade Scales in Evaluative Voting. European Journal of Political Economy, 55, 14-28.
Baujard, A., Igersheim, H., Lebon, I., Gavrel, F., & Laslier, J.-F. (2014). Who's Favored by Evaluative Voting? An Experiment Conducted during the 2012 French Presidential Election. Electoral Studies, 34, 131-145.
Bedock, C. (2017). Reforming Democracy: Institutional Engineering in Western Europe. Oxford University Press.
Berggren, N., Jordahl, H., & Poutvaara, P. (2017). The Right Look: Conservative Politicians Look Better and Voters Reward It. Journal of Public Economics, 146: 79-86.
Blumenau, J., Eggers, A. C., Hangartner, D., & Hix, S. (2017). Open/Closed List and Party Choice: Experimental Evidence from the UK. British Journal of Political Science, 47(4), 809-827. Bol, D., Blais, A., Gillard, X, Nunze, L. & Pilet, J.-B. (2018). Voting and Satisfaction with
Bol, D., Harfst, P., Blais, A., Golder, S., Laslier, J.-F., Stephenson, L. & Van der Straeten, K. (2016). Addressing Europe’s Democratic Deficit: An Experimental Evaluation of the Pan-European District Proposal. Pan-European Union Politics, 17(4), 525-545.
Bormann, N.-C., & Golder, M. (2013). Democratic Electoral Systems Around the World, 1946– 2011. Electoral Studies, 32(2), 360-369.
Bowler, S., & Farrell, D. M. (2011). Electoral institutions and campaigning in comparative perspective: Electioneering in European Parliament elections. European Journal of Political Research, 50(5), 668-688.
Boxell, L., Gentzkow, M., & Shapiro, J. M. (2020). Cross-Country Trends in Affective
Polarization. Stanford Mimeo, available at:
http://web.stanford.edu/~gentzkow/research/cross-polar.pdf.
Campbell, A., Converse, P.E., Miller, W.E., & Stokes, D.E. (1980). The American Voter. University of Chicago Press.
Chang, E. C. C., & Golden, M. A. (2007). Electoral Systems, District Magnitude and Corruption. British Journal of Political Science, 37(1), 115-137.
Carey, J. M., & Shugart, M. S. (1995). Incentives to Cultivate a Personal Vote: A Rank Ordering of Electoral Formulas. Electoral Studies, 14(4): 417-439.
Cheibub J. A., & Sin G. (2020). Preference Vote and Intra-party Competition in Open List PR Systems. Journal of Theoretical Politics, 32(1), 70-95.
Colomer, J. (2011). Personal Representation: The Neglected Dimension of Electoral Systems. ECPR Press.
Cox, G. W. (1990). Centripetal and Centrifugal Incentives in Electoral Systems. American Journal of Political Science, 34(4), 903-935.
Crisp, B. F., Escobar-Lemmon, M. C., Jones, B. S., Jones, M. P., & Taylor-Robinson, M. M. (2004). Vote-Seeking Incentives and Legislative Representation in Six Presidential Democracies. Journal of Politics, 66(3), 823-846.
Cutler, F. (2002) The Simplest Shortcut of All: Sociodemographic Characteristics and Electoral Choice. Journal of Politics, 64(2), 466-490.
Dalton, R. J. (2004). Democratic Challenges, Democratic Choices: The Erosion of Political Support in Advanced Industrial Democracies. Oxford University Press.
Darmann, A., Grundner, J., & Klamer, C. (2017). Election Outcomes under Different Ways to Announce Preferences: An Analysis of the 2015 Parliament Election in the Austrian Federal State of Styria. Public Choice, 173, 201-2016.
Devroe, R, & B. Wauters (2020). Does High on the Ballot Means Highly Competent? Explaining the Ballot Position Effect in List-PR System. Acta Politica 55(3): 454-471.
Duverger, M. (1951). Les Partis Politiques. Armand Colin.
Dolan, K. (2008). Is There a ‘Gender Affinity Effect’ in American Politics? Political Research Quarterly, 61(1), 79-89.
Farrell, D. M., & Shugart, M. S. (2012). Electoral Systems: Six-Volume Set. Sage.
Farrell, D. M., & McAllister, I. (2006). Voter Satisfaction and Electoral Systems: Does Preferential Voting in Candidate‐ Centred Systems Make a Difference? European Journal of Political Research, 45(5), 723-749.
Folke, O., & Rickne, J. (2020). Who Wins Preference Votes? An Analysis of Party Loyalty, Ideology, and Accountability to Voters. Journal of Theoretical Politics, 32(1), 11-35.
Folke, O., Persson, T., & Rickne, J. (2016). The Primary Effect: Preference Votes and Political Promotions. American Political Science Review, 110(3), 559-678.
Golder, S., Stephenson, L., Van der Straeten, K., Blais, A., Bol, D., Harfst, P., & Laslier, J.-F. (2017). Votes for Women: Electoral Systems and Support for Female Candidates. Politics & Gender, 13(1), 107-131.
Jankowski, M. (2016). Voting for Locals: Voters’ Information Processing Strategies in Open-List PR Systems. Electoral Studies, 43(3), 72-84.
Karvonen, L. (2010). The Personalisation of Politics: A Study of Parliamentary Democracies. ECPR Press.
Laslier, J.-F., Blais, A., Bol, D., Golder, S., Harfst, P., Stephenson, L., & Van der Straeten, K. (2015). The EuroVotePlus Experiment. European Union Politics, 16(4), 601-615.
Laslier, J.-F., & Sanver, R. (2010). Handbook of Approval Voting. Springer.
Lijphart, A. (1994). Electoral Systems and Party Systems. Oxford University Press.
Lupia, A. (1994). Shortcuts Versus Encyclopedias: Information and Voting Behavior in California Insurance Reform Elections. American Political Science Review, 88(1), 63-76.
Matakos, K., Troumpounis, O., & Xefteris, D. (2016). Electoral Rule Disproportionality and Platform Polarization. American Journal of Political Science, 60(4), 1026-1043.
McDermott, M. L. (1997). Voting Cues in Low-Information Elections: Candidate Gender as a Social Information Variable in Contemporary United States Elections. American Journal of Political Science, 41(1), 270-283.
McDermott, M. L. (1998). Race and Gender Cues in Low-Information Elections. Political Research Quarterly, 51(4), 895-918
McElroy, G., & Marsh, M. (2010). Candidate Gender and Voter Choice: Analysis from a Multimember Preferential Voting System. Political Research Quarterly, 63(4), 822-833. Meriläinen, J. & Tukiainen, J. (2018). Rank Effects in Open-list Elections. Public Choice, 177,
87-109.
Nagtzaam, M. A. M., & van Erkel, P. F. A. (2017). Preference Votes without Preference? Institutional Effects on Preference Voting: An Experiment. Journal of Elections, Public Opinion and Parties, 27(2), 172-191.
Norris, P. (2011). Democratic Deficit: Critical Citizens Revisited. Harvard University Press.
Popkin, S. L. (1991). The Reasoning Voter. Communication and Persuasion in Presidential Campaigns: The University of Chicago Press.
Renwick, A., & Pilet, J.-B. (2016). Faces on the Ballot: The Personalization of Electoral Systems in Europe. Oxford University Press.
Rosar, U., Klein, M., & Beckers, T. (2008). The Frog Pond Beauty Contest: Physical Attractiveness and Electoral Success of the Constituency Candidates at the North Rhine‐ Westphalia State Election of 2005. European Journal of Political Research, 47(1), 64-79.
Sanbonmatsu, K. (2002) Gender Stereotypes and Vote Choice. American Journal of Political Science, 46(1), 20-34.
Sanz, C. (2017). The Effect of Electoral Systems on Voter Turnout: Evidence from a Natural Experiment. Political Science Research and Methods, 5(4), 689-710.
Schickler, E., & Green, D. P. (1997). The Stability of Party Identification in Western Democracies: Results from Eight Panel Studies. Comparative Political Studies, 30(4): 450-483.
Shugart, M. S., Valdini, M. E., & Suominen, K. (2005). Looking for Locals: Voter Information Demands and Personal Vote-Earning Attributes of Legislators under Proportional Representation. American Journal of Political Science, 49(2), 437-449.
Sudulich, L., & Trumm, S. (2019). A Comparative Study of the Effects of Electoral Institutions on Campaigns. British Journal of Political Science, 49(1), 381-399.
ONLINE APPENDIX
A1. Full report of the experiment (following APSA standards) Subjects and Context
The experiment was conducted in August 2018 as one of PUMA Survey V.3’s22
two modules. Modules for that survey were selected on the basis of a public call for proposals and an external anonymous review. The questionnaire we used was pre-tested in a two step procedure: (1) a group of Bachelor and Master students and (2) a group of experts. Both groups were recruited from University of Salzburg’s Department of Political Science. Group (1) was asked to evaluate a first version of our online questionnaire on SoSci Survey (www.soscisurvey.de); group (2) was
composed of departmental staff holding at least a Master’s degree and was asked to provide a written statement on the questionnaire. The final survey was administered by PUMA and implemented by Marketagent.com online reSEARCH, Mühlgasse 59, A-2500 Baden, Austria. PUMA surveys are financed by the Austrian Ministry of Education, Science and Research.
Between August 1, 2018 and August 10, 2018 617 respondents were recruited using Marketagent’s online access panel. The survey’s subject pool included all persons eligible to vote in the National Council election on October 15, 2017, that is all Austrian citizens 16 years and older on election day. A comparison of our sample’s available demographics with the Austrian population is provided in A4. There are no notable deviations from representativeness.
Allocation Method and Treatments
The treatment (either EV[0,1], AV[0,1,2] or AV[-1,0,1] scale) was assigned to individuals on a random basis. An independence test (see A2) provides evidence of random assignment. Participants were not aware of the experimental situation and did not know about the other two treatments. The accompanying text asked experimental subjects to imagine a reform of Austria’s electoral system, introducing [SCALE_AV, SCALE_EV_1, SCALE_EV_2] and to proceed by using this scale to award points to the first fifteen candidates of their party’s list in 2017. The original text23 reads as follows:
“Stellen Sie sich nun bitte vor, die österreichische Wahlordnung würde bezüglich der
Vorzugsstimme auf der Bundesliste so geändert, dass Sie einzelne Kandidatinnen und
Kandidaten mit [0 oder 1 // 0,1, oder 2 // -1, 0 oder 1] Punkten bewerten können. Zur Ermittlung des Ergebnisses würden die Punkte zusammengezählt. Gewählt wären
diejenigen Kandidatinnen und Kandidaten, die die höchste Gesamtsumme an Punkten auf sich vereinigen.
Wir zeigen Ihnen im Anschluss 15 Kandidaten von der Bundesliste jener Partei, die Sie bei der Nationalratswahl am 15. Oktober 2017 gewählt haben.
Bitte klicken Sie auf den „Weiter“-Button, um fortzufahren.”
There was neither deception nor post-experiment debriefing, interview, or questionnaire.
22 see https://www.puma-plattform.at/fileadmin/user_upload/p_puma/Modulberichte_PUMA_Survey_V.3.pdf 23 The full questionnaire can be accessed online on the PUMA website:
A2. Balance test EV[0,1,2] EV[-1,0,1] Interest in politics -0.004 -0.014 (0.053) (0.053) Left-right self-placement -0.074 -0.074 (0.078) (0.079) Education level -0.027 -0.045 (0.069) (0.068) Political knowledge -0.058 0.011 (0.077) (0.077) Gender -0.217 -0.019 (0.255) (0.253) Age 0.007 0.002 (0.008) (0.008)
Party: SPÖ (ref) (ref)
Party: ÖVP 0.387 0.468 (0.356) (0.363) Party: FPÖ -0.154 0.200 (0.360) (0.358) Party: Grüne -0.062 -0.386 (0.555) (0.605) Party: NEOS -0.270 0.176 (0.128) (0.463)
Party: List Peter Pilz 0.179 0.306
(0.575) (0.577) Party: GILT 14.306 12.940 (620.398) (620.398) Party: KPÖ 0.607 0.005 (1.262) (1.445) Constant 0.425 0.290 (0.640) (0.645) N 431
Note: Entries are coefficient estimates from a multinomial logit predicting the experimental condition (base outcome =
A3. Descriptive statistics (voters)
N Mean Std. Dev.
Interest in politics (0: min, 10: max) 456 5.68 2.74
Left-right self-placement (0: left, 10: right) 431 4.81 1.92 Education level (1: primary school, 7: university degree) 456 2.99 1.80
Political knowledge (0: min, 7: max) 456 3.60 1.84
Gender (0: male, 1: female) 456 0.49 0.50
A4. Representativeness of the sample Sample Population N % % Gender male 303 49.1 49.2 female 314 50.9 50.8 Age 15 to 19 years 42 6.8 22.7 20 to 29 years 105 17.0 15.1 30 to 39 years 105 17.0 15.8 40 to 49 years 131 21.2 16.2 50 to 59 years 108 17.5 18.1 60 to 69 years 86 13.9 13.0
More than 69 years 40 6.5 16.0
Education
primary school 122 19.8 18.0
Vocational training 219 35.5 34.2
secondary school 216 35.0 30.3
university degree 60 9.7 17.5
Note: the sample is composed of eligible voters (16 years old or more). The % in the population column are the closest
information we could find. For age, it the percentage of Austrians in the category among those who are 15 or above. For education, it is the proportion of Austrians in the category who are 25 or above. Sources: Statistik Austria (2019, p.28) for gender and age, Statistik Austria (2020, p.99) for education.
A5. Comparison of vote choice in sample and population
Party Sample 2017 election (population) Difference
SPÖ 28.5 26.9 1,6
ÖVP 21.7 31.5 -9,8
FPÖ 29.8 26.0 3,8
GRÜNE 5.3 3.8 1,5
NEOS 7.7 5.3 2,4
LISTE PETER PILZ 5.0 4.4 0.6
GILT 1.1 1.0 0.1
KPÖ 0.9 0.8 0.1
Note: Entries are percentages (first two columns) and percentage points (third column). Official National Council
A6. Description statistics (candidates)
Variable N Mean Std. Dev.
Gender (0: male, 1: female) 120 0.48 0.50
Age (21 years old, 71 years old) 120 44.29 12.64
Incumbent (0: no, 1: yes) 120 0.18 0.38
Academic title (0: no, 1: yes) 120 0.52 0.50
A7. Full regression results (multivariate analysis) OLS: candidate points Logit: max points Logit: min points
AV[0,1] (ref) (ref) (ref)
EV[0,1,2] 0.445*** -0.681** -0.427+ (0.070) (0.247) (0.244) EV[-1,0,1] -0.101+ 0.073 -2.351*** (0.056) (0.227) (0.305) Gender -0.068* -0.301+ 0.329* (0.034) (0.163) (0.160) EV[0,1,2] * gender -0.065 -0.205 -0.068 (0.044) (0.193) (0.139) EV[-1,0,1] * gender -0.031 -0.166 -0.228 (0.033) (0.141) (0.184) Candidate old -0.035 -0.081 0.218 (0.036) (0.157) (0.169) EV[0,1,2] * candidate old 0.045 0.154 -0.246+
(0.041) (0.186) (0.149) EV[-1,0,1] * candidate old 0.028 0.129 -0.242
(0.033) (0.163) (0.189)
Candidate young -0.030 -0.119 0.118
(0.044) (0.222) (0.198) EV[0,1,2] * candidate young 0.014 0.246 0.026
(0.084) (0.345) (0.206) EV[-1,0,1] * candidate young 0.035 0.331+ 0.070
(0.049) (0.177) (0.249) Incumbent 0.161*** 0.743*** -0.648*** (0.047) (0.215) (0.192) EV[0,1,2] * incumbent 0.057 0.016 0.203 (0.060) (0.224) (0.189) EV[-1,0,1] * incumbent -0.023 -0.127 0.561* (0.042) (0.181) (0.252) Academic title -0.031 -0.135 0.202 (0.039) (0.181) (0.184) EV[0,1,2] * academic title -0.012 0.068 -0.057
(0.042) (0.190) (0.158) EV[-1,0,1] * academic title -0.035 -0.223 -0.144
(0.030) (0.147) (0.190)
List position -0.019*** -0.093*** 0.095***
(0.004) (0.022) (0.022) EV[0,1,2] * list position -0.017*** -0.055* -0.020
(0.005) (0.025) (0.018) EV[-1,0,1] * list position -0.006+ -0.049* -0.078*** (0.003) (0.021) (0.021)
Party: SPÖ (ref) (ref) (ref)
(0.074) (0.292) (0.262) Party: FPÖ -0.010 0.241 0.202 (0.072) (0.294) (0.265) Party: Grüne -0.104 -0.620 0.368 (0.098) (0.514) (0.412) Party: NEOS 0.056 0.365 0.049 (0.085) (0.330) (0.330)
Party: List Peter Pilz 0.038 -0.128 -0.073
(0.093) (0.447) (0.391)
Party: GILT 0.345** 0.958+ -0.842*
(0.107) (0.512) (0.335)
Party: KPÖ 0.223+ 0.780+ -0.763
(0.124) (0.426) (0.574) Voter: interest in politics 0.027*** 0.114*** -0.089** (0.007) (0.030) (0.031) Voter: left-right self-placement 0.006 -0.008 -0.006
(0.010) (0.044) (0.048)
Voter: education level -0.009 -0.045 0.042
(0.009) (0.032) (0.037) Voter: political knowledge 0.026* 0.100* -0.090+
(0.011) (0.042) (0.049) Voter: gender 0.123*** 0.348** -0.524*** (0.030) (0.120) (0.141) Voter: age -0.002+ -0.001 0.010* (0.001) (0.004) (0.004) Constant 0.241* -1.159* 0.422 (0.111) (0.497) (0.484) N 6465 6465 6465
Notes: Entries are coefficient estimates from OLS/logit regressions predicting the number of points received by
candidates/probability to receive the max (min) point of the scale. Standard errors clustered by candidates and subjects are in parentheses; + p < 0.1, * p < 0.05, ** p < 0.01, *** p < 0.001.