HAL Id: hal-02956543
https://hal.archives-ouvertes.fr/hal-02956543
Submitted on 2 Oct 2020
HAL is a multi-disciplinary open access
archive for the deposit and dissemination of sci-entific research documents, whether they are pub-lished or not. The documents may come from teaching and research institutions in France or abroad, or from public or private research centers.
L’archive ouverte pluridisciplinaire HAL, est destinée au dépôt et à la diffusion de documents scientifiques de niveau recherche, publiés ou non, émanant des établissements d’enseignement et de recherche français ou étrangers, des laboratoires publics ou privés.
Scaling Laws in Urban Geography. Linkages with Urban
Theories, Challenges and Limitations
Olivier Finance, Elfie Swerts
To cite this version:
Olivier Finance, Elfie Swerts. Scaling Laws in Urban Geography. Linkages with Urban Theories, Challenges and Limitations. Theories and Models of Urbanization. Geography, Economics and Com-puting Sciences, Springer Verlag (Germany), pp.67-96, 2020, Lecture Notes in Morphogenesis book series, 978-3-030-36656-8. �hal-02956543�
Scaling laws in urban geography
Linkages with urban theories, challenges
and limitations
Olivier Finance
1 3and Elfie Swerts
2 31 | UMR 7362 Laboratoire Image Ville Environnement, Université de Strasbourg, Strasbourg (France)
2 | FORS – Swiss Centre of Expertise in the Social Sciences, Université de Lausanne, Lausanne (Switzerland)
3 | UMR 8504 Géographie-cités, Paris (France)
Contact:
olivier.finance@live-cnrs.unistra.fr elfie.swerts@fors.unil.ch
Abstract
Scaling laws are simple, easily usable and proven relevant models used in geography for validating various urban theories. These non-linear relationships may reveal physical constraints on the structure and evolution of complex systems, and underline the relationship between urban functions, size of cities and innovation cycles. In this contribution, we examine to what extent scaling laws are transferable towards urban theories and in which specific fields of urban geography these models may be relevant. We thus focus on the accuracy of scaling laws when exploring structures and processes of systems of cities, the diffusion of innovation, metropolization and intra-urban dynamics. We therefore use several examples taken in different regions of the world, embedded in various historical, political and economic contexts. However, in some cases, care must be taken not to over-interpret the results obtained from scaling laws and not to give scaling laws more explanatory power than they can describe. We illustrate this point by providing recommendations relying for instance on the sensitivity of measurements to the delineation of each object of the system under study and to the definition of the system itself. These recommendations can help to get robust results in order to understand the generic evolutionary mechanisms in urban systems.
Introduction
As various social sciences, geography benefits from inter- and multi-disciplinarity through cross-disciplines interrelationships. Geography and spatial analysis feed other disciplines with their specific relation towards space as input of analysis; in the opposite way, quantitative
geography often benefits from approaches previously developed in other fields. The search for regularities in geographical systems sometimes revisit models and (statistical) laws firstly developed in other fields, as with the clear parenthood between Newton’s law of universal gravitation and Tobler’s first law of geography1 (Tobler, 1970). Theoretical implications and
interpretations evidently differ in those cases, as well as in the application of scaling laws.
Scaling laws are among these models assimilated and revisited by geographers. These statistical power-law relationships link an attribute distributed among elements under consideration and the size of each of these elements. In other words, they allow to observe if there is a regular elevation of a quantity while considering bigger elements in size, not only considering a proportionality assumption (linear shape of the relationship) but also sublinearly or superlinearly. It is the shape of the relationship which is under study: does the attribute variate "faster" or "slower" than proportionally with the size of the elements when bigger elements are considered?
Scaling laws first emerged in biology, from the systematic observation that the energy expended by living organisms is a function of their size, and that this energy does not vary linearly but according to a law of scale interpreted as economies of scale (West et al., 1997, 1999). Scaling laws are now broadly used in geography especially in urban quantitative geography. They combine and slowly overpass some other typical statistical methodologies previously used in the field as Zipf’s law or rank-size rule (Zipf, 1949). With scaling laws, a one dimension approach (comparing population value and population rank of elements, especially cities) is now replaced by a two dimension one (based both on an attribute distributed among elements, and their population). The rank-size rule is of course still useful for geographers to study the hierarchical structure of an entire set of cities, yet scaling laws now permit to confront diverse urban attributes to this hierarchical structure of the system.
A lot of urban attributes have actually be found as scaling either linearly, sublinearly or superlinearly with city size, as diverse as morphological ones (for example the length of roads, the built area or the total area of green spaces; Levinson, 2012; Bettencourt, 2013; Louf & Barthelemy, 2014; Arcaute et al., 2015; Rybski et al., 2016; Cottineau et al., 2017), wages and incomes in diverse geographical contexts (Um et al., 2009; Paulus & Pumain, 2011; Arcaute et al., 2015; Cottineau et al., 2018; Sarkar et al., 2018) or economic ones (as the distribution of some activities among cities of an urban system; for example, the magnitude of research and scientific activities scales superlinearly with city size both in terms of jobs and patents filed; Pumain et al., 2006; Bettencourt et al., 2007b; Arcaute et al., 2015).
This contribution will focus on several aspects of the use of scaling laws in urban geography. It deals with the relevance and limitations of scaling laws to explore urban theories. In these urban theories, the city is understood in dynamic terms, as a product of interdependence and interactions that take place at different temporal and spatial scales (Pumain, 1982; Batty, 2013). Scaling laws, like other statistical, mathematical and physical models, make it possible through abstraction, to compare the dynamics of cities and the different systems they form. Thereby, they allow to highlight the regularities of cities and urban systems, as well as some of their specificities. Among these regularities, some are strongly linked to the size of cities and can therefore be studied by scaling laws (Pumain, 2004; Batty, 2013; Arcaute et al., 2015;
1 “Everything is related to everything else, but near things are more related than distant things” (Tobler,
Barthelemy, 2016). Thus, a remarkable regularity is the way economic activities are spatially distributed in systems of cities and the way this distribution evolves in space and time. This distribution is strongly linked with city size.
In this context, this chapter questions to what extent scaling laws make it possible to test these urban theories, to highlight the invariants and specificities of geographical structures and dynamics by testing theories with empirical case studies. In doing so, they also question the general limitations that have to be kept in mind while using this methodology in geography. Section 1 focuses on the process of adoption of scaling laws in geography and on the various theoretical interpretations that can be given to results obtained through this methodology. Through the Section 2, the relevance of scaling laws is highlighted when studying geographical structures, dynamics and theories. Each point is illustrated with chosen examples taken in the litterature. Other examples are used is the Section 3 to highlight and discuss some limitations of scalings laws in geography and more specifically key-points which should not be forgotten when using them in urban studies to get robust results. Section 4 concludes.
1. Origins of scaling laws and their adoption in
geography
Scaling laws have been transposed from biology to social sciences in the 1990’s, as in urban geography. After some words on the use of scaling laws in biology (subsection 1.1), the specific analytical framework in which scaling laws have been adopted - systems of cities - will be presented (subsection 1.2). Various opposing interpretations of these scaling laws have been theorized in this framework, mainly by Pumain and Bettencourt research groups. These various interpretations are here reminded (subsection 1.3).
1.1. Scaling laws in biology: the metabolic rate of
organisms
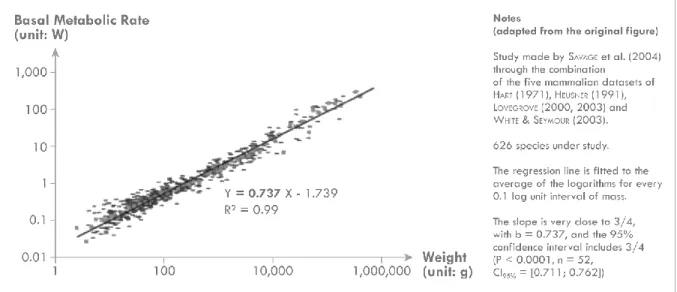
One of the major application of scaling laws in biology has been the confrontation between energy consumption per unit of time and the body mass of living organisms, i.e. the metabolism versus the size. Results of systematic analyses on several orders of magnitude in terms of size of animals or mammalians (West et al., 1997, 1999; Savage et al., 2004) show that the metabolic rate of an organism of mass m is proportional to m power ~0.75, the minimal rate of energy expenditure per unit of time by endothermic animals at rest (Basal Metabolic Rate) (Figure 1). In other words, bigger animals in terms of body mass expand a lesser quantity of energy than smaller ones compared to the proportionality assumption. This economy of energy is function of a power-law relationship, and this scaling law is obeyed with remarkable precision (R² = 0.99 in the relationship exposed in Figure 1).
Figure 1 | Basal Metabolic Rate versus size for mammalian species (adapted from Savage et al., 2004)
As reminded by Pumain (2012), West takes the example of ants that are able to lift one hundred times their own weight, which a human being would be incapable of. Can we then say that ants are stronger than human beings? "To say so would amount to saying that if an ant could reach the size (or weight) of a man it would be 100 times stronger (…). Yet the change in scale from the ant to the man is not a linear function of weight" (Pumain, 2012). In fact, this strength varies according to a power law. "It is only when an appropriate form of relationship is used (...) that it is possible to obtain an evaluation that does not defy intuition: human strength is then more or less equivalent to that of an ant" (ibid.).
The metabolic rate of organisms therefore scales sublinearly with size with a three quarter exponent, which is explained by West et al. (1997) by "a general model that describes how essential materials are transported through space-filling fractal networks of branching tubes". Three assumptions are emphasised in this general model to explain this sublinearity. First, a space-filling fractal-like branching pattern is required in order the biological networks to supply the entire volume of the organism. Moreover, terminal units (the final branches of the network) are size-invariant. The system has at last to be optimized to minimize the energy required to distribute resources (West et al., 1997). The sublinear scaling regime observed is therefore the consequence of the combination of physical and geometric constraints encompassed in these three assumptions.
As the objects that are observed in geography don’t share all the properties of those in these studies in ecology, there are no reasons that the same sublinearity is found when using scaling laws in urban geography. Nevertheless, urban systems appear to be strongly shaped by scaling laws.
1.2. Urban systems shaped by scaling laws
The scaling laws have been transferred in geography within the specific analytical framework of systems of cities (Berry, 1964) which allow to understand the city in an evolutionary way, at different temporal and spatial scales. Systems of cities result from the different forms of exchange and interaction that occur between cities at varying distances, resulting from their
mutual dependence, complementarity, cooperation and competition. They are carried out through various types of networks such as infrastructure, migration, trade or information (Bretagnolle et al., 2009). Resulting functional regularities are then observed at several levels of observation, from the intra city-level to the systems they form.
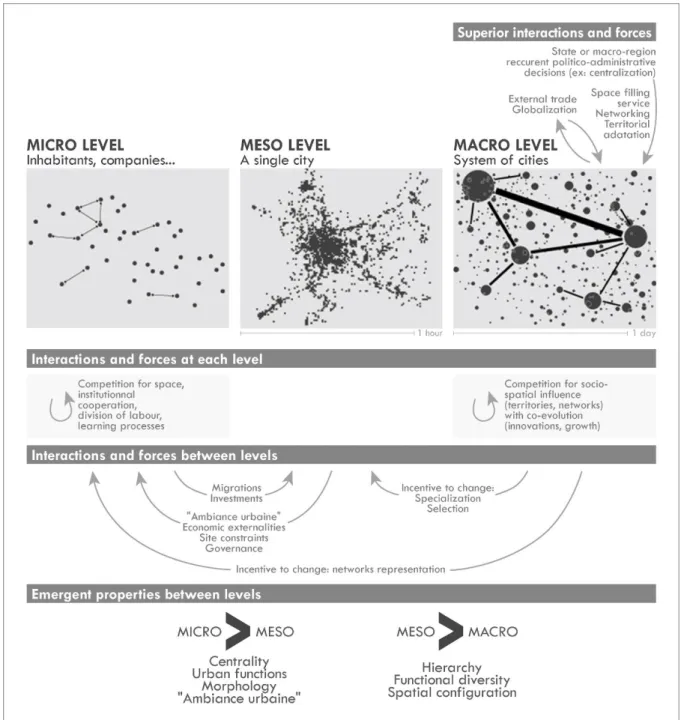
Geography is not the only discipline that considers cities as a relevant level of observation, economics being an example. The specificity of geography is to consider different levels of observation of urban entities: cities can be considered as "systems within city systems" (Berry, 1964), an interpretation of the city which has even been refined to consider three distinct but interrelated levels of observation. Cities can first be studied through elementary units constituting a first micro-level of observation, which are individuals, companies or institutions that live together in a city. Their actions and exchanges build and shape individual cities, observable at a meso level. This level of observation is that of the city entity as a whole, defined as a coherent geographical entity, either morphological or functional. A morphological city is defined as a set of continuous urban buildings, whereas a functional one is defined as the whole area over which the city exerts a strong influence and attractiveness, for example by including places in strong interrelationship with an urban core through commuting flows. This second meso level of observation is covered by a third macro level, that of the system of cities, "composed of a large number of cities and towns that interact under unified control" (Bretagnolle et al., 2009). These systems are traditionally considered to extend within national borders, but with the increase in long-distance interactions, their actual limits may overpass them (at the European scale for example).
Systems of cities are strongly shaped by a hierarchy of size and functions, either economic, political, administrative or social (Christaller, 1933; Berry, 1964; Pred, 1977; Pumain, 1997), due to interactions both at each single level and between micro, meso and macro levels (Figure 2). Interactions between levels (cooperation or concurrence for example) produce strong interdependencies in the evolution of cities, both in their demographic, social or economic dimensions (Pumain et al., 2009), resulting for example in a strong co-evolution of their socio-economic profiles (Paulus, 2004). Some profiles can nevertheless diverge from the general trend through effects of selection at diverse stages of their history, related to faster than expected development of some business sectors in some cities due to their location near a reservoir, a border or metropolises. This selection can lead to a self-reinforcing effect of economic specialization through economics of location, and the marks of this specialization can be observed even after the decline of what has led to this specialization.
As in various other complex multi-level systems, emergent properties link the three levels of observations (bottom part of Figure 2). A city (meso level) can for example be seen "as a collective entity whose specific properties, although mostly produced by intentional agents at the individual level, cannot be simply explained or predicted from these intentions, nor derived by summing the characteristics of its inhabitants" (Bretagnolle et al., 2009). From the micro to the meso levels, the emergent properties are as diverse as centrality, morphology or urban functions. Analogously, the hierarchical structure of systems of cities, the diversity of functions among cities or a specific spatial configuration emerge at the macro level.
Figure 2 | Multi-level organisation of systems of cities, interactions and emergences between levels (adapted from Pumain et al., 2007 and 2009)
Scaling laws in urban geography are useful to detect some of these emergences at the macro level, by helping to catch how some urban attributes are distributed in an urban system by comparing this distribution to the hierarchical distribution of city sizes. Similarly to other disciplines, scaling laws in urban geography are power-law relationships connecting attributes to size according to the following formalization:
Y = Y0Nβ
where Y is an urban attribute, N the size of each city (usually its population), β the power exponent and Y0 a normalization constant. For convenience, the relationship is usually
log(Yi) = a0 + β log(Ni) + ɛi
where a0 is a general constant and ɛi the residual. β therefore corresponds to the slope of the
linear trendline obtained on a bi-logarithmic scatterplot or on log-transformed values of the attribute and the size (hereinafter referred to as "the β parameter" or the "scaling parameter"). β is usually computed through Ordinar Least Squares (OLS) regression; the quality of fitting is quantified by the coefficient of determination R² and the 95% confidence interval (CI95%)
helps to validate the regime of scaling (Leitão et al., 2016). If CI95% is totally included in the
interval [0.95; 1.05], the scaling regime is considered as linear; the scaling regime is considered either as sublinear or superlinear when CI95% is entirely below 0.95 or above 1.05.
If an overlap is observed, conclusions are mixed or uncertain. Thus, various scaling regimes are observed in urban geography contrary to the previous example in biology. Their interpretation need some geographical-oriented theories that are detailed in the next subsection.
1.3. Diverse theories to interpret urban scaling laws
The transfer of such a theory from experimental to social sciences and especially in urban geography required an adaptation. Consequently, this step is not only a diffusion from biology to geography, with an adoption in geography of a model elaborated in another field; it is much more a transfer as both the objects studied and the concepts and theories developed to explain the form, dynamics, and long-term evolution of these objects are different. Sublinearity is still observed for some urban attributes, but linearity and superlinearity can also be observed in urban geography. Various theoretical interpretations are given by physicists and geographers to explain these three scaling regimes.
A first interpretation is given by Bettencourt (2013) and Bettencourt et al. (2007a). An important contribution of this first interpretation is to provide a linkage between the value of scaling law exponents and growth processes via a mathematical model (Bettencourt et al. 2009). Their interpretation of sublinear regimes is linked with economies of scale: urban attributes that are liable to achieve scale economies would show scaling exponents smaller than one. They expect these sublinear regimes to represent infrastructure variables, such as the number of gas stations (Bettencourt et al., 2007a). Sublinearity evidences constraints on development, which translate into a restriction of growth that takes on a logistic function. The existence of linear regimes is linked with individual basic needs, independent from city size, such as water consumption. In the case of linear regimes, unlimited exponential growth can be observed. Third, superlinear regimes of scaling are understood by increasing returns to network interactions. Socio-economic variables such as Gross Domestic Product are expected to scale superlinearly with city size (Bettencourt et al., 2007a). In this case of superlinearity, "constraint then tends to produce development that is all the more marked where the system is already large" (Pumain, 2012), that is what economists call agglomeration economies or increasing returns (Feldman & Florida, 1994).
This general interpretation is criticized by Pumain (2012) as "physicists in this case conclude to a “singularity in finite time” of the growth curve of cities, a quantitative explosion which then translates into an abrupt decline in growth if there is no innovation to provide new resources and alter the energy patterns in the system". This interpretation "concluding that there is an increase in the “pace of life” in relation to city size, seems to us to miss all the social
organisation that builds up through a city’s history”. Moreover, it assumes ergodicity; yet "this hypothesis is not consistent with an evolutionary theory of urban systems integrating the spatial distribution of labour and the hierarchical diffusion of innovation". This interpretation is rejected as it has been shown that on the very long term, the growth of cities is more of less exponential. Each city cannot reach any possible state in the system, as each kind of city (in terms of size) is not able to catch any kind of innovation at random times.
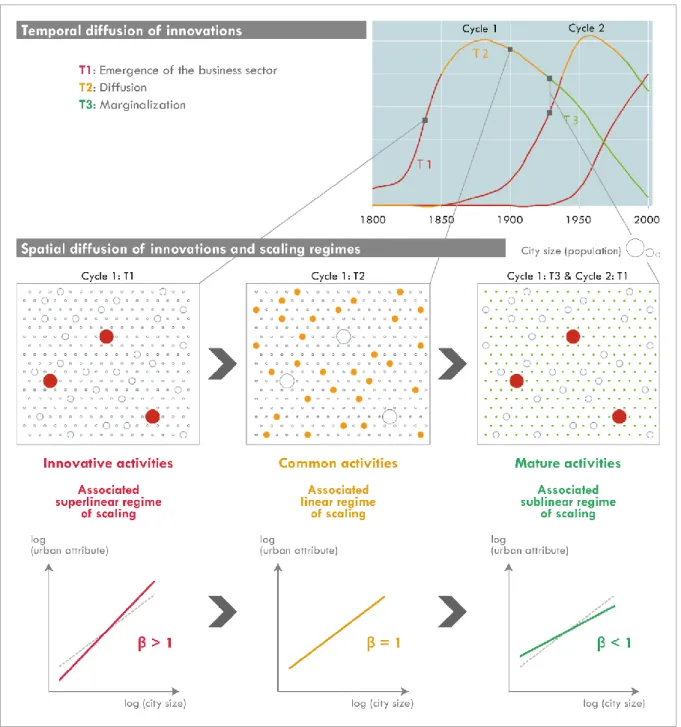
This concept of innovation is at the core of another interpretation produced by Pumain et al. (2006): an evolutionary theory for interpreting urban scaling laws, linking together innovation, distribution of activities and the hierarchical properties of urban systems. They clearly oppose to Bettencourt’s group assumptions considering that "on average different cities are scaled up versions of each other" (Bettencourt et al., 2008). Empirically based on the distribution of economic activities among cities of a given system, this theory is evolutionary as the observations about the way cities co-evolve are considered both taking into account the spatial (hierarchical) structures of urban systems and time. It provides a "linkage between the concepts of urban functions, city size and innovation cycles" (Pumain et al., 2006). Three types of exponents of the power function linking the size of cities to the variable applied to the activities they host are then identified. When the exponent is close to 1, activities are distributed proportionally to the city size (population) in the system. When the exponent is greater than 1, activities are relatively concentrated in the upper-part of the urban hierarchy, and conversely among the smaller units when β is below 1. In this proposal, superlinear regimes characterize innovative business sectors emerging at the top of the urban hierarchy. In parallel with the emergence of new innovation cycles, the process of hierarchical diffusion leads to the propagation of innovations towards smaller towns in the system, leading the scaling regime for a given activity to become first linear (and the activity to become common), then sublinear when other innovation waves occur (and the activity mature) (Figure 3).
Figure 3 | Diffusion of innovations in space and time and scaling laws (adapted from Pumain et al., 2006)
This theory reinterprets the principle of hierarchical diffusion of innovations as formulated by Hägerstrand (1968). It is strongly linked to the evolution cycle of products (and services): initially when the product/service emerges, it is innovative and is first captured by large cities that have the capacity to develop it and benefit from it despite the high costs of production. In a second stage, that of trivialization, the product or service (then called "adapted") spreads to smaller cities because of the lower production and acquisition costs. Finally, if a product or service is replaced by a new one, or in case of obsolescence, its diffusion continues and attached employment reaches and concentrates in a few small specialized cities. This process may also depend on the choice of cities to create an innovative product or to adopt an innovative sector of activity, because of an environment, intrinsic to the city or cities of the same region, conducive to the development of these innovations. This leads to the formation
of specialised cities, for which location factors can be more independent of city size (e.g. when it comes to exploiting "resource deposits" for extractive activities, tourism, or even scientific research when it is concentrated in relatively small but highly specialised cities, such as in Europe Oxford, Cambridge or Heidelberg).
The hierarchical processes of diffusion of innovations tend to strengthen the pre-existing urban hierarchy. They explain the persistence of the relative weight of large cities, which benefit from the advantages of capturing the benefits generated by innovations, a relative diversification of their economies and a more complex organization resulting from their previous adaptations. Conversely, cities that specialize in an innovative sector of activity initially experience an increase of their weight in the system as a result of the spillover effects of innovation. However, they may subsequently present difficulties in adapting to new innovations due to their excessive specialisation. They are thus weakened by their dependence on the evolution of product cycles (this has been the case in France, for example, in the industrial cities of northern France).
From a dynamic point of view, business sectors with a scaling exponent greater than 1 therefore correspond to innovative activities, which at the stage of their emergence are captured by large cities. As they become more commonplace, they spread throughout the system and the value of their scaling exponent tends to 1. Their distribution is then approximately proportional to city size. Activities at the end of a cycle are then concentrated in a few small specialized cities, and the exhibitors of the laws of scale of these sectors are then less than 1. We mainly rely on this second theory to interpret scaling exponents computed in various geographical contexts and about various urban attributes in the next section, showing how scaling laws can be fundamental in geography.
2. Scaling laws and geographical theories,
structures and dynamics
Scaling laws are useful at the macro level to describe the distribution of an urban attribute among cities of a system while taking into account its hierarchical structure. Focusing on the level of systems of cities, we recall how scaling laws can be used as a concentration index of urban attributes among cities and their global added-values compared to other indexes (subsection 2.1). We show that scaling laws are much more than simple concentration indexes by testing the evolutionary theory for interpreting scaling laws (Pumain et al., 2006) detailed in the previous subsection. The relationship between distribution of activities and the hierarchical position of cities makes it possible to question the processes of diffusion and concentration of such activities within urban systems as metropolization (subsection 2.2). Once these regularities explored, it makes it possible to highlight outliers, i.e. cities that deviate from the expected pattern, to further enlighten the factors that generate such singularities (subsection 2.3). Yet results also allow to test both the center-periphery gradient emerging in each city at the meso level, when various definitions of the city are used, and more generally, the impact of the variation in city definitions on the interpretation of the results of scaling laws (section 2.4).
2.1. Urban hierarchy and concentration
While analysing the distribution of an urban attribute among cities of an urban system, scaling laws allow to measure its degree of concentration along the urban hierarchy. Several types of measurements can be used to assess the concentration of a variable in an urban system, such as the Gini index or the rank-size rule. Their comparison remind the added-value of scaling laws compared to these other methods (paragraph 2.1.1.). Yet once included in an evolutionary theory of systems of cities, scaling laws are much more than a concentration index (paragraph 2.1.2.).
2.1.1. Added-value compared to Gini index and rank-size
rule
Scaling laws are more efficient than some other methods allowing to measure the distribution of an attribute in a system of cities. Scaling laws are compared to the Gini index2 and the
rank-size rule3 in Figure 4 to compare the distribution of Localized Foreign Direct Investment stocks
(LFDI stocks, i.e. employment in every foreign-controlled economic establishment in 2008, aggregated at the functional city level - the ‘aires urbaines’) in the French system of cities, to the one of total employment at the establishment level.
2 The Gini index is based on the Lorenz curve which summarizes the distribution of an attribute among
elements (the cumulative frequency of the elements is plotted on the x-axis and the cumulative frequency of the attribute is plotted on the y-axis). The value of the Gini index corresponds to the area between the line of perfect equality (dotted line on Figure 4) and the Lorenz curve computed for a given attribute. The index varies from 0, a situation of perfect homogeneity, to 1, the maximal inequality or heterogeneity of distribution.
3 Zipf and some of his predecessors (Auerbach, 1913; Zipf, 1949) have formulated an empirical law,
the rank-size rule or Zipf’s law, used in urban geography to illustrate the general hierarchical regularity of city size found in each system of cities in the world. This regularity is expressed as an inverse geometric progression between the population Pi of a city and its rank Ri, as Pi = K / Rα, where K and α
are constants, α being the slope of the trendline on a bi-logarithmic graph. α is found to not pull away strongly from 1 (see meta-analysis by Cottineau, 2017; see also an application of Zipf’s law on diverse urban systems by Pumain et al., 2015).
Figure 4 | Comparison of the Gini index, the rank-size rule and scaling laws to
compare the distribution of total employment and LFDI stocks in the French system of cities
With a higher Gini index, LFDI stocks appear to be generally more concentrated than total employment. But there is no evidence on which cities have been specifically selected by foreign investors, either metropolises, small cities or even at random positions in the system. With a steeper slope while considering a rank-size rule, LFDI stocks appear once again to be more concentrated than total employment; but as assessed by the bottom part of Figure 4, as cities are separately ordered according to their rank for each attribute, a given rank on one attribute may not necessarily represent the same city as the same given rank of the other attribute. Some cities find themselves dozens of ranks above or below in terms of LFDI stocks compared to total employment, but the rank-size rule cannot reveal it by itself. Moreover, the rank-size rule, when computed on the 355 ‘aires urbaines’ on the LFDI stocks, is skewed by the shape of the tail. Therefore two values of the slope α are computed (from rank 1 to rank 100 or to rank 355) for each attribute; in both cases, LFDI stocks are more concentrated than total employment, even if the comparison can be impacted by the diverging position of a given city on each curve. Scaling laws overcome this difficulty (right part of Figure 4) by considering another variable on the x-axis: the size of each city (in this case its population). Then, two cities of same size or twice the same city on two scatterplots have exactly the same position on the x-axis. The comparison between two distributions (in this case LFDI stocks and total employment) is consequently much more rigorous while using scaling laws than the rank-size rule.
Using scaling laws, conclusions towards a higher concentration of LFDI stocks are verified. Contrary to the two other methodologies, scaling laws clearly allow to assess a higher concentration of LFDI stocks in the highest part of the urban hierarchy (the scaling regimes are either linear or sublinear for total employment, significantly superlinear for LFDI stocks, which means that biggest cities concentrate even more LFDI stocks than expected under a proportionality assumption). The high variability in the relationship when the smallest cities are
considered (note that it is related to the curved shape of the rank-size rule) implies some other factors that the urban hierarchy to explain the distribution of LFDI stocks in the French system of cities (specialization, proximity to investors or to market potential, etc.; Finance, 2016).
The concentration of transnational investment in selective places had already been stated; the use of scaling laws here demonstrates it more rigorously than with other methods and with more restraint than studies on World Cities (Taylor, 2004). Transnational investors don’t select the sole metropolises but tend to have a higher presence in the upper-part of the urban hierarchy according to a law of scale (Finance, 2016).
2.1.2. More than a simple concentration index
As detailed in the previous section, scaling laws are a better concentration index than Gini or the rank-size rule. When the scaling regime is sublinear or superlinear, it can be concluded that the attribute under study is first concentrated, and that this more-than-proportionally concentration is located in respectively the lowest or the upper-part of the urban hierarchy. But this method is much more than a concentration index when innovation cycles and the location of activities are considered. As assessed by Pumain et al. (2006) in their evolutionary theory, there is a link between innovations and the scaling parameter values when the distribution of economic activities in considered in systems of cities. This assumption can be tested in two ways: first by classifying economic activities into innovative, common and mature sectors by computing the scaling parameters, second by computing the scaling parameter values on economic activities beforehand classified in innovative / less innovative clusters.
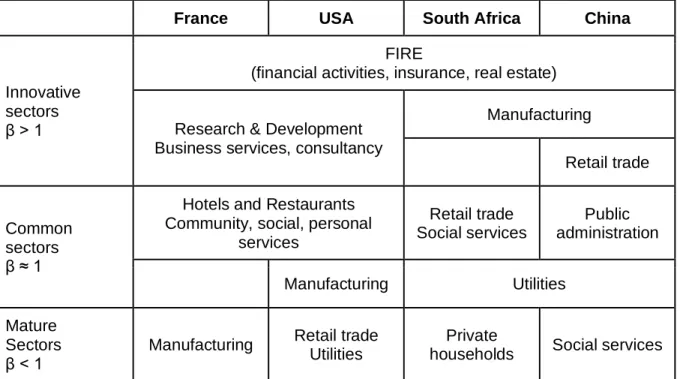
As stated above, the analysis of the distribution of a business sector in an urban system through scaling laws can lead to the classification of the sector as innovative when β > 1, common when β ≈ 1 or mature when β < 1. Applied to the urban systems of France, the USA, South Africa and China - on functional city definitions proper to each geographical context - it confirms that activities developed in large cities are the most advanced and complex ones, according to the geographical, historical, economic context of each system (Table 1). The FIRE business sectors (financial activities, insurance and real estate) rank as innovative activities in each of the four systems, in relation with both globalization and metropolization. This is also notably the case in China, where the banking sector - initially built on the model of the Soviet monobank system - is developing and becoming more complex. This is largely in relation with the arrival of foreign banking institutions and the emergence of peripheral financial institutions, which have long been limited in the country (Svejnar, 2007). Yet other innovative sectors are context-dependent: manufacturing is innovative in so-called emerging countries (South Africa and China), and retail trade in China, whereas these activities are common or mature in formerly industrialized countries.
France USA South Africa China
Innovative sectors β > 1
FIRE
(financial activities, insurance, real estate)
Research & Development Business services, consultancy
Manufacturing
Retail trade
Common sectors β ≈ 1
Hotels and Restaurants Community, social, personal
services Retail trade Social services Public administration Manufacturing Utilities Mature Sectors β < 1
Manufacturing Retail trade Utilities
Private
households Social services
Table 1 | Scaling parameters of diverse economic activities in four systems of cities (combining Paulus & Pumain, 2007; Vacchiani-Marcuzzo & Paulus, 2008; Pumain et al., 2009; Swerts, 2013)
On the other hand, economic activities can be clustered from the most innovative to the less innovative ones before computing the scaling parameters, to verify the concordance between scaling laws results and the economic nomenclatures. In Figure 5, this clustering is done according to the OECD nomenclature in knowledge-intensive and less-knowledge intensive services as well as high-tech and low-tech manufacturing industries, and scaling parameters are then computed in the French case. Services scale superlinearly with city size whereas manufacturing industries linearly or sublinearly (CI95% prevents excluding linearity). Most of the
innovative (according to the nomenclature) services and manufacturing industries show clear superlinear regimes (up to 1.67 for knowledge-intensive market services such as activities of head offices, air transport, legal and accounting activities, advertising, etc.), whereas less innovative services show values of β closer to 1 and less innovative manufacturing industries clear sublinear regimes. These results are in total concordance with the previously developed theory. Services are more innovative than manufacturing; innovative services and manufacturing industries are much more metropolitan; above all, innovative manufacturing industries are much more concentrated in the upper-part of the urban hierarchy than less innovative services. Therefore caution is needed when the manufacturing sectors are all put together: there is a strong variability of profiles under this label, and innovation do not only concentrate in globalized services.
Figure 5 | Values of scaling parameters for activities located in the French system of cities after clustering of services and manufacturing industries of similar innovation degrees
2.2. Diffusion of innovation and metropolisation
As an extension of both the use of scaling laws to detect the concentration of urban attributes in a part of the urban hierarchy (subsection 2.1.) and the evolutionary theory to interpret urban scaling laws (subsection 1.3.), this statistical modelling can be used to detect the stage in the diffusion process of diverse innovations. By comparing scaling parameters obtained for many different periods, it is possible to consider the evolution of the concentration of the attribute in the urban system. Following the simple confrontation of an urban attribute and the hierarchical structure of a system of cities, and in close relationship with the geographical interpretation of scaling laws exponents, scaling laws are useful to validate theories of hierarchical diffusion of innovations and the process of metropolisation in systems of cities. Therefore, the same methodology can be applied in the same geographical context but at different periods in order to study the evolution of β exponents over time and test these two hypotheses.
Scaling parameters are computed over a selection of business sectors both in the French urban system and the Chinese one in Figure 6 by using functional definitions of cities in both cases. Many manufacturing industries exhibit decreasing scaling parameters over time in France (1962-1999): these sectors are diffusing into the system of cities. At the opposite, research and development is becoming more and more concentrated in the upper-part of the urban hierarchy, being one of the most innovative business sector in France. The Chinese system of cities is quite different even if the period under study differs (1990-2010): manufacturing industries exhibit superlinear regime of scaling and increasing scaling parameters, whereas research may be classified among the decreasing or stable scaling parameters. Other slight differences oppose these urban systems: retail trade exhibits a linear regime in France whereas the scaling parameter is now above 1 in China; education stays linear in France while sublinearity is detected in the Chinese case. Therefore it has to be reminded that the results of each computation of scaling laws may be better understood in its geographical context (a given business sector is not as innovative in two distinct urban systems) and in its temporal context (as the theory for interpreting scaling laws is evolutionary).
Figure 6 | Temporal evolution of scaling parameters computed over a selection of business sectors in the French and Chinese systems of cities
2.3. Scaling laws as a filter to detect outliers
As one can expect from some wide confidence intervals detected previously (knowledge-intensive market services or high-tech manufacturing industries), some cities deviate from the statistical model. In urban geography, rare are the attributes (as the distribution of jobs of a given business sector in an urban system) scaling as perfectly with city size as the metabolic rate of organisms. Urban scaling laws can reveal robust relationships between urban attributes and the urban hierarchy, but some cities may deviate significantly from the value expected by the scaling relationship. Therefore, deviations to scaling laws can be computed to observe local specificities that are a higher or lower concentration of the urban attribute under study than expected by city size and the bivariate relationship.
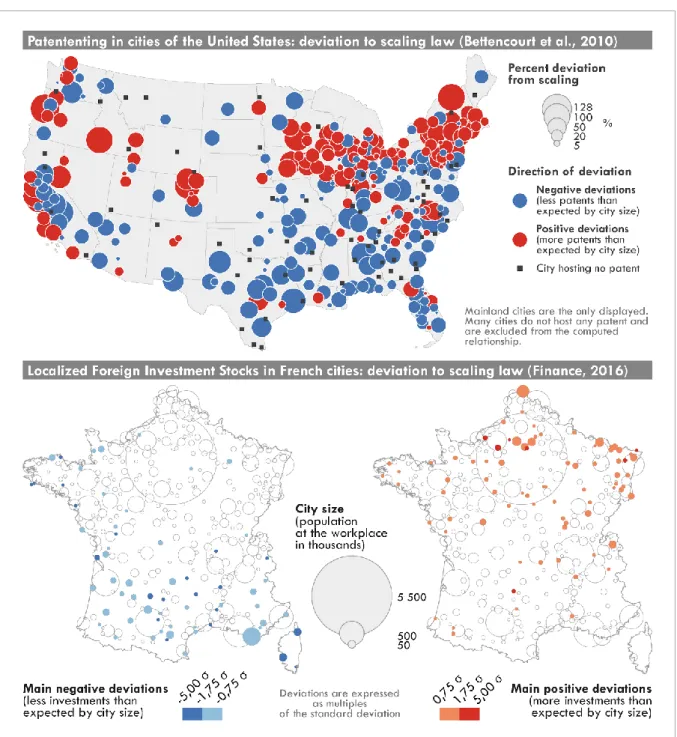
Two different examples of computation of deviations to scaling laws are shown in Figure 7, about patents in cities of the United States and LFDI stocks in the French ones (functional definitions in both cases). Cities in blue are below the computed trend line of a scaling law and the ones in red above. In the first case, a correction has been applied to make the deviations independent to city size, but the semiology makes the confrontation between the urban hierarchy and the deviations difficult to read as the size of the circles represents the intensity of the deviation rather than the population. In both cases, deviations are strongly affected by regional effects. Patenting appears to be more intense in the Great Lakes region and on the West coast, in relation with the economic profiles of these cities (for example more industrial in the Great Lakes region) (Bettencourt et al., 2010). LFDI stocks are also much more concentrated in the northern and eastern parts of the country (cities surrounding the metropolitan area of Paris included), while some cities in southern and western France are marginalized in foreign transnational investment networks (Finance, 2016). This is also partly linked with other attributes than city size: economic profiles, proximity to investors, proximity to a high market potential, etc. Therefore, simple bivariate relationships as scaling laws can help to detect outliers in order to try to understand why some cities have a distinct profile compared to the one predicted by scaling laws. Further analyses are then needed to understand these deviations that supplement the strong hierarchical effect.
Figure 7 | Deviations to scaling law in the cases of patents in the United States and the LFDI stocks in France
2.4. Scaling laws and the center/periphery gradient in
cities
Another regularity that can be observed is the center-periphery structure of cities that emerges at the meso level. Scaling laws can help to learn more about this gradient.
A first way to consider this gradient is to work directly on its morphological shape. Studies by Lemoy and Caruso (2018) and Delloye et al. (2019) have shown empirical evidences across 300 European cities “of the simple geometrical scaling of cities as seen from the radial evolution of their land use and population density” (Lemoy & Caruso, 2018). Radial profiles of
cities (considered as monocentric) are very well captured and are homothetic to each other by rescaling them by the square root for land-use and by the cube root for the population density.
Another way to consider this gradient is to consider various definitions of cities in a system and to compare scaling parameters obtained on given urban attributes. Cities can be defined in either administrative, morphological or functional approaches, which do not describe the same territories. Cities defined by official censuses correspond to an administrative vision of territorial management and population counting. These definitions are a key to understand valuable territories in that they reflect the political, cultural and even historical consideration of cities. However, these administrative boundaries of cities do not always reflect their morphological and functional extent, are rarely compatible from one country to another. Finally, their designation is often political, which does not make it possible to capture all forms of urbanization. Harmonization of the city definitions over time and as independently as possible of their official definitions and administrative boundaries makes it possible to overcome this difficulty. Morphological and functional approaches are much more appropriate to measure the evolution of cities over long periods of time in a consistent way, to compare the size and evolution of cities defined according to the same reference and to integrate "unofficial" cities into the databases.
A morphological city is defined by delineating its dense and continuous urban structure, to which a statistical threshold of resident population is added. In the e-Geopolis project (whose objective is to describe and compare cities over time), a distance threshold of maximum 200 meters and a minimal population threshold of 10,000 inhabitants are simultaneously considered (Moriconi-Ébrard, 1994). A functional city includes the area of influence of a central city (without the necessity of a spatial continuity of the built-up area), detected through the intensity of relations between a central city and its periphery (usually through commuting movements). Comparing a morphological definition to a functional one can lead to apparently contradictory results, that can be explained by the differences in the nature of what is a dense urban core and what are the peripheries or the suburbs included in functional definitions. The area of greenspace in cities of England and Wales, which scales linearly to sublinearly when defined according to a density threshold, becomes clearly superlinear when a functional dimension (30% of commuters) is added (Arcaute et al., 2015). Manufacturing, vacant dwellings, basic services and education are some examples of diverging conclusions of scaling laws in the French urban systems when morphological (‘unités urbaines’) and functional (‘aires urbaines’) cities are compared (Cottineau et al., 2017).
We take the example of the Chinese urban system to further the analysis of the influence of the definition of cities on scaling results. Three definitions are considered and compared. The first definition is the official one, which is an administrative and juridical approach. The perimeter of cities does not delimit a "strictly urban" area, but includes rural areas as well as cities at lower administrative levels (Gipouloux, 2006). Indeed, Chinese cities are political-administrative entities at all levels of Chinese administration. It encompasses and administrates rural areas that are all the more extensive when the administrative level is high. Chinese cities have the particularity of being nested: cities in the lower administrative ranks are included in the administrative boundaries of higher ranking cities. Despite the high relevance of the administrative definition of Chinese cities, the definition of Chinese cities as morphological agglomerations makes it possible to capture all urban entities regardless of
their administrative status, and to compare their temporal and spatial evolution, including within China itself. The delineation of Chinese cities as morphological entities is based on the definitional criteria used in the aforementioned e-Geopolis project. As Chinese rural areas are very densely populated and built, this definition may nevertheless include dense rural settlements. To overcome this potential limitation, an economic criterion has been added to exclude each settlement whose assets were mainly engaged in the primary sector through a clustering analysis (i.e. an agglomerative hierarchical clustering on the agglomerations’ active population). Data describing each district being contained in the agglomeration are aggregated (either classified as urban and rural districts; Qu, Xianjishi and Xian); when agglomeration only partly includes a district, only the data describing the villages (Zhen) were aggregated with the rest of the agglomeration. The database set up (named ChinaCities; Swerts, 2018) thus includes 1,664 agglomerations built from districts, from metropolises to district level cities (ChinaCities V1), and 9,476 agglomerations from metropolises to towns, built from districts but also from towns (ChinaCities V2). The morphological agglomerations thus constructed include a much smaller dense urban area than the official cities, which include a large area of agricultural land and several cities.
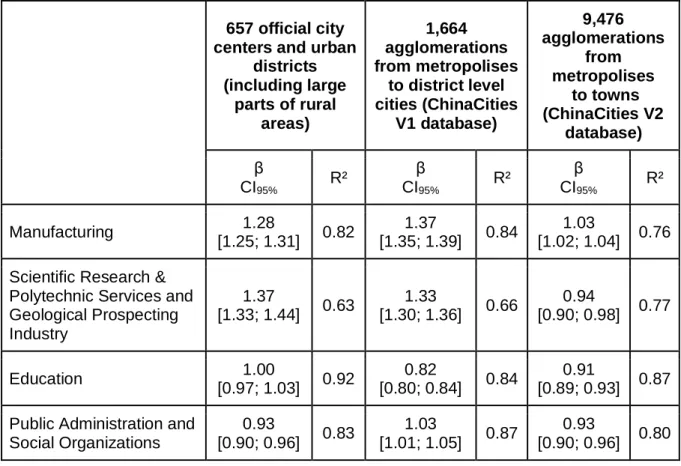
The application of scaling laws to these databases of different entities shows the very different results of the measures depending on how the cities to which they are applied are defined. These differences make it possible to capture that the distribution of activities in Chinese cities that are strongly linked to the country's stage of development and history, but also the influence of the political and administrative system. The example developed in Table 2 shows the distribution of four activities in the Chinese urban system: Manufacturing, Scientific Research & Geological Prospecting, Education and Public Administration and Social Organizations. The scaling exponents seem strongly dependent to the city delineation.
657 official city centers and urban
districts (including large parts of rural areas) 1,664 agglomerations from metropolises to district level cities (ChinaCities V1 database) 9,476 agglomerations from metropolises to towns (ChinaCities V2 database) β CI95% R² β CI95% R² β CI95% R² Manufacturing 1.28 [1.25; 1.31] 0.82 1.37 [1.35; 1.39] 0.84 1.03 [1.02; 1.04] 0.76 Scientific Research &
Polytechnic Services and Geological Prospecting Industry 1.37 [1.33; 1.44] 0.63 1.33 [1.30; 1.36] 0.66 0.94 [0.90; 0.98] 0.77 Education 1.00 [0.97; 1.03] 0.92 0.82 [0.80; 0.84] 0.84 0.91 [0.89; 0.93] 0.87 Public Administration and
Social Organizations 0.93 [0.90; 0.96] 0.83 1.03 [1.01; 1.05] 0.87 0.93 [0.90; 0.96] 0.80
Table 2 | Scaling laws applied to Manufacturing, Scientific Research & Geological Prospecting, Education and Public Administration and Social Organizations sectors on three different definitions of the city in China (2010)
For the Manufacturing and Scientific Research & Geological Prospecting sectors, the variation of the β exponent shows that the distribution of activities in the urban hierarchy is marked by the development stage of these two activities. Thus, manufacturing activities are over-represented in large cities if we consider the official database and even more so the ChinaCities V1 database. This shows that in China, as in South Africa, manufacturing is an innovative activity developed in large cities. At the same time, it is over-represented in smaller entities when scaling is applied to the ChinaCities V2 database, which means that when the towns (“Zhen”) agglomerations are included, manufacturing follows a linear regime of scaling. This can be explained by the fact that several stages of development of manufacturing activity overlap in China. The ancient plants from the Maoist period are still located in small towns, while the new waves of manufacturing occur above all in largest cities. The fact that the β exponent is higher with the ChinaCities V1 database than with the official one suggest that the manufacturing activities are located in the center of the Chinese cities rather than in the surrounding countryside; indeed, we recall that the official database cover a city perimeter encompassing a larger territory ChinaCities V1 agglomerations.
Similar trends are observed for the Scientific Research & Geological Prospecting sector. The scaling regime is superlinear when the official cities or the ChinaCities V1 agglomerations are taken into account. Including the Zhen agglomerations (ChinaCities V2), the relation between scientific research and Geological Prospecting becomes sublinear. These variations could be explained by the fact that the Scientific Research is likely an innovation located in largest cities
and the Geological Prospecting Industry is located in smallest towns, close to resources. Available nomenclatures don’t allow to distinguish these activities, slightly different by nature.
Activities of Education and Public Administration & Social Organizations show the importance of the administrative status of cities in China in the hierarchical distribution of activities. Education activities are proportionally distributed within the cities of the Chinese system when the official base is considered. They are slightly over-represented in small cities while considering the ChinaCities V2 database, even more strongly when the towns are excluded (ChinaCities V1). The global sublinear/linear relationship between education and city size (contrary to USA, France and South Africa) is a Chinese specificity due to the political system and the decentralization policies, which lead to educational activities being present throughout the territory, including in small cities. However, the fact that there is a less overrepresentation in small towns when Zhen are included show the effect of the administrative status of cities and the decentralization policy. Finally, Public Administration and Social Organizations exhibits a linear regime of scaling while considering ChinaCities V1 database excluding towns, but sublinear with the two other definitions. This shows that the Public Administration is a reflect of the Chinese political system and linked to the cities’ status.
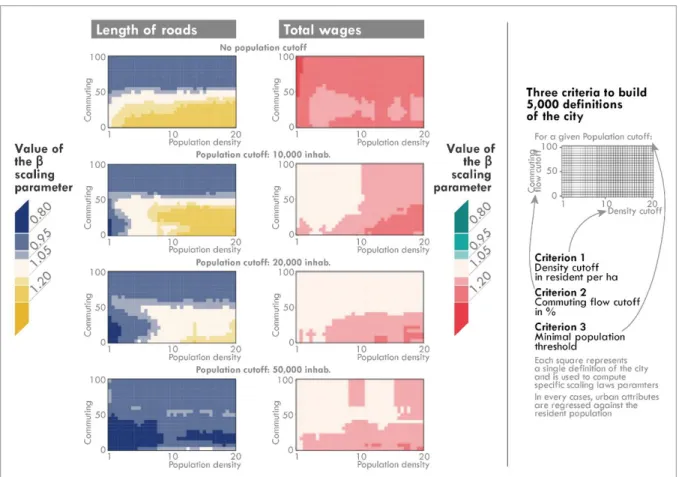
We conclude this section by highlighting a last example on how city delineation may strongly affect scaling parameters. Sensitivity analyses of scaling parameters have been computed by Arcaute et al. (2015) and Cottineau et al. (2017 and 2018) to detect variations of scaling regimes when thousands of concurrent definitions of the city are considered, in England and Wales and in France (these definitions are based on the systematic combination of three definitional criteria: density, commuting flows and population cutoffs). Figure 8 shows through heat maps some results about the sensitivity of scaling parameters to city definitions for two urban indicators: the total length of roads and the total wages, both in the French urban system. For the most realistic definitions of the city, it appears that "larger cities appear either richer or as rich as smaller cities, but never poorer on average" (Cottineau et al., 2017). Moreover, "with respect to the relationship between total wages and total residents, we see that larger cities, when they are defined as sprawling metropolises (bottom-right), do seem richer than their smaller counterparts. This is not true when we look at city cores only (top-left)" (ibid.). This mainly reflects the difference in spatial distribution of jobs and residents in cities, with a much stronger concentration of jobs in the central parts of cities. The sensitivity analysis is even more striking while considering the total length of roads as "not only do the scaling exponent values vary: the scaling regime (sub- or superlinear) depends on the combination of density, commuting flows and population cutoffs". When the city is delineated as its dense urban core, the scaling regime is sublinear (among realistic definitions); yet "when one considers cities along with their functional peripheries (...), then we find the opposite result: the largest cities become relatively more consumptive of infrastructure per capita" (Cottineau et al., 2017).
Figure 8 | Scaling parameters computed on the length of roads and total wages in French cities based on 5,000 different definitions of the city (adapted from Cottineau et al., 2017 and 2018)
Scaling laws are relevant to describe the relationships between urban attributes and city size. They make it possible to highlight generic and regular mechanisms (such as the hierarchical diffusion of innovations), and by studying the gaps in regularity, the specific characteristics of some cities. All these examples show how each definition criterion affects results that are expected from scaling laws computations, and supports once again the need of relying on appropriate delineations of cities in urban scaling. Scaling laws are very sensitive to city delineation and city systems on which they are applied. When the definition of the objects studied is mastered, this is a richness in terms of interpretation. On the other hand, it can also render obsolete the interpretation of scaling laws. We thus develop some recommendation for a proper use of scaling laws in the third part.
3. Some guidelines for proper use of scaling laws in
urban geography
As underlined in the previous sections, scaling laws are relevant for validating urban theories. However, this method should be used with many precautions. Indeed, the exponents of the scaling laws are very sensitive to the definition of the entities on which the measurements are made. This extreme responsiveness, without totally questioning the use of scaling laws, makes the interpretation of the results at least tricky, even meaningless or false. Due to the
number of limitations partly illustrated before in studies relying on scaling laws in urban geography, this third and final section offers some recommendations for further studies.
Recommendation 1: always consider proper definition of the city. The main danger when
handling scaling laws is first of all to build conclusions on data aggregated at erroneous or inconsistent definitions of the city. As we have seen in the previous section, scaling laws exponents are extremely sensitive to cities’ delineation. Choosing one or another definition consistent definition of the city can lead to different or event opposite results; building the computation on cities that are not well defined could lead to doubtful or erroneous conclusions.
It is therefore dangerous to work directly with official databases if the detailed knowledge of how entities are calculated is not known, and if they include entities with different definitions as communes, places, counties, municipalities. To give meaning to the results obtained, it is therefore necessary to have a coherent and homogeneous definition of a city. A reliable solution is to work with databases whose definition of the city is harmonised, either morphological or functional. It has the advantage of allowing the results computed through scaling laws to be compared over time and space.
In a recent paper focusing on Brazil, some authors wonder about the surprising deviation of some infrastructural and individual basic services variables from the scaling regimes they were expecting. The number of hospital beds appear to scale linearly with the size of elements under consideration; they “propose that these deviations are a product of top-down decisions/policies” specific to the Brazilian context (Meirelles et al., 2018). Yet elements under study are the Brazilian municipalities; functional cities as Rio de Janeiro or São Paulo are consequently split in various elements, each of them being an individual element. It is probable that the superlinearity which has been detected at the municipality level is not only linked with the unequal distribution of hospital beds among functional cities in Brazil, but also within functional cities. It has not been demonstrated by the authors if the aggregation of municipalities into functional urban areas would have produced less surprising scaling parameters. Results comparing scaling parameters computed in various geographical contexts without using harmonised definitions of what is a city have to be considered carefully.
Recommendation 2: avoid working on too small samples of cities. As with all statistical
or regression models, the number of cities on which scaling laws are applied influences the value of the scaling exponent but also and above all the validity and the significance of the results. As aforementioned, considering or excluding small towns of the set of Chinese cities affects both the results and the conclusions that can be made through scaling laws. In the same vein, introducing population minimal threshold can make the results variate slightly.
The distribution of activities within a system of cities only makes sense if the system under consideration includes a significant number of cities, and not a sample of metropolises (if this case, one should call it a system of metropolises!). Even if they don’t miss recommandation 1, Bettencourt and Lobo (2016) miss this second one while comparing the distribution of GDP, urbanized area, employment and patents in various national urban systems of Europe (namely France, UK, Spain, Italy and Germany). The set of functional cities considered in each case varies from 8 (Spain) to 24 (Germany) only. This makes the results interpretable only for the upper-part of the complete urban hierarchies. Therefore the delineation not only of each city but of the system of cities has to be judicious to enable conclusions on the whole system of
cities. Beyond that the sample size determines the significance of the results. That lead to the third recommandation:
Recommendation 3: don’t forget to validate the scaling parameters through the confidence intervals. For the interpretation of the results to make sense, overinterpretation of results should be avoided. Values of β give a valuable indication to validate urban theories, but must be significant. Therefore the interval [0.95; 1.05] is commonly used as the range of linear regimes of scaling; if there is any overlay of this range by confidence intervals of apparently superlinear or sublinear regimes of scaling, linearity cannot be excluded.
Once again, Bettencourt and Lobo’s results on some national European urban systems (2016) have to be interpreted carefully. Values of β seem to agree with their expectations, but confidence intervals are extremely broad (partly due to the small samples considered). Consequently, GDP cannot be considered as scaling purely superlinearly with city size in the cases of UK, Spain or Italy; the distribution of patents cannot be considered as superlinear in any case, even not only superlinear or linear regarding the extremely wide confidence intervals.
Recommendation 4: never forget that a minimal size threshold can affect the results. In
defining the cities and the system of cities on which the scaling laws are applied, the question of the size threshold of the cities considered also has a strong impact on the results of the scaling and the interpretation that can be given to them. Some urban attributes are quite ubiquitous in the upper-part of the urban hierarchy, and even if distributed in every city of a system, show a more selective propensity among the smallest cities. The previous example of LFDI stocks in France is one of them: reducing progressively the system of cities from 355 to 150 cities by excluding the smallest city at each step produces a slow but slight increase of β (Finance, 2016; Finance & Cottineau, 2018).
Recommendation 5: don’t always trust OLS. Ordinar Least Square regression is the usual
way to compute scaling laws parameters; but as exposed by Leitão et al. (2016), other ways of estimating non-linearity in systems of cities are available. The way the computations are performed can be another source of variability in the results. Alternative methods proves in some cases a better robustness.
Rather than considering linearity as the range of values into the interval [0.95; 1.05], the authors compare diverse models of scaling with different shapes of the noise (lognormal, Gaussian, etc.) in the Maximum Likelihood Estimation (MLE) approach. In each case, a first instantiation is computed where β is allowed to vary, another one where β has a fixed value of 1 (the linear model). Then, constrained and unconstrained models are compared through a Bayesian Information Criterion, an index of performance of the model in terms of fit and parsimony (Finance & Cottineau, 2018). As an example, when scaling parameters are computed on total employment in French cities on various definitions of the system by reducing progressively the system of cities from 355 to 150 cities (see recommendation 4), constrained models are often more effective in terms of fit and parsimony and proved linearity with higher reliability.
Recommendation 6: never forget that zero values are not taken into account. Another
point reminded by Leitão et al. (2016) and further detailed by Finance & Cottineau (2018) is the influence of the presence of zero-values in the dataset.
As scaling laws are usually computed through OLS regressions on log-transformed data, an artificial filtering is introduced: it requires removing the datapoints with yi = 0 to calculate the
scaling exponent, as log(0) is not defined. "The problem with the zero count for cities where these attributes are absent is that the technical necessities of usual estimation procedures make the analysis ignore them altogether even when they represent some valid information" (Finance & Cottineau, 2018): the fact that no patent is registered in some cities (as in the example in Figure 7 based on Bettencourt et al., 2010), or that a given business sector is absent in some cities (see proportion of zero-values in Figure 5), or that some cities don’t host any transnational greenfield investment during a given period (see Finance & Cottineau, 2018) is as interesting as the effective intensity of concentration of these attributes in cities hosting these attributes. Therefore, β computed through OLS on these cases does not represent the relationship between the quantity under study and city size in the whole system, but only in the subset of cities which concentrate a positive part of this quantity.
When zero-values are mostly registered in the smallest cities, a judicious minimal population threshold can be introduced to reduce them (Arcaute et al., 2015; Finance & Cottineau, 2018). But some alternative methods, some of them taking specifically into account zero-values like Hurdle models, are able to deal specifically with zero-values without filtering. These methods being much more computationally demanding, a first recommendation would be to clearly enumerate the proportion of zero-values in the dataset considered when scaling laws are used.
Recommendation 7: be creative! And recommendation 8: don’t hesitate to formulate new recommendations to the community.
Conclusion
Scaling laws offer the advantage of being simple, easily usable and proven relevant models for validating the theories of cities dynamic. The simplicity of scaling laws can certainly be a questionable argument as to the relevance of the formalizations they allow. In particular, the low number of explanatory parameters considered, unlike econometrics, where a whole set of explanatory variables are integrated into the models, could appear to be an element that gives scaling laws limited explanatory potential.
However, it is in this apparent weakness that a strength of scaling laws lies. Their simplicity allows them to be used as a filter to highlight urban attributes whose distribution within cities of a system is related to the size of cities. They thus make it possible to highlight hierarchical regularities of city systems, but also to detect cities that deviate from these regularities. This then makes it possible to investigate the factors that influence major deviations from expected values. In addition, one of the added values of scaling laws is that they offer a wide field of application in urban geography, in particular because they make it possible to study a whole set of urban attributes, from the distribution of economic activities to transport networks. Scaling laws allow to observe and explain these distributions and regularities over time, if data are available, and especially to make international comparisons.
Scaling laws have thus allowed new advances in geography as well as the confirmation of theories, structures and dynamics already verified with other methods previously. In particular, they made it possible to validate urban theories relating to the hierarchical diffusion of