HAL Id: hal-00810662
https://hal.archives-ouvertes.fr/hal-00810662
Submitted on 23 Apr 2012
HAL is a multi-disciplinary open access
archive for the deposit and dissemination of
sci-entific research documents, whether they are
pub-lished or not. The documents may come from
teaching and research institutions in France or
abroad, or from public or private research centers.
L’archive ouverte pluridisciplinaire HAL, est
destinée au dépôt et à la diffusion de documents
scientifiques de niveau recherche, publiés ou non,
émanant des établissements d’enseignement et de
recherche français ou étrangers, des laboratoires
publics ou privés.
Physical and perceptual differences between two
trumpets of the same model type
Adrien Mamou-Mani, Laetitia Placido, David Sharp
To cite this version:
Adrien Mamou-Mani, Laetitia Placido, David Sharp. Physical and perceptual differences between two
trumpets of the same model type. Acoustics 2012, Apr 2012, Nantes, France. �hal-00810662�
Physical and perceptual differences between two
trumpets of the same model type
A. Mamou-Mani
a, L. Placido
band D. Sharp
ca
IRCAM, 1 place Igor Stravinsky, 75004 Paris, France
b
Universit´e Paris 1 CES/CNRS, 106-112 boulevard de l’Hˆopital, 75647 Paris Cedex 13, France
c
Open University, DDEM, MCT Faculty, Open University, Walton Hall, MK7 6AA Milton
Keynes, UK
For large-scale musical wind instrument manufacturers, the ability to produce instruments in a repeatable fashion is essential. In this paper, two mass-produced trumpets of the same model type are compared in terms of physical and perceptual differences. Input impedance and bore profile measurements show significant acoustical differences due to the presence of a tiny leak in the bore of one of the two instruments. Psychophysical tests demonstrate that these acoustical differences do not necessarily result in perceptible differences in the playing characteristics of the two trumpets. Only a small number of trumpet players successfully distinguish between the instruments when subjected to a playing test, although those that do are shown to be able to provide distinct and consistent quality assessments for each one.
1
Introduction
For large-scale musical wind instrument manufacturers, the ability to produce instruments in a repeatable fashion is essential. However, despite the tight manufacturing tolerances used, musicians often claim to be able to discern small, but perceptible, differences between the playing properties of instruments manufactured in exactly the same way. These differences are most likely a result of tiny disparities in bore profile or in the positioning and sealing of any valves or side holes. Physical variations such as these will result in the instruments having non-identical resonance characteristics.
In recent years, development work on non-invasive techniques for measuring the bore profile and the input impedance of musical wind instruments has resulted in significant improvements in both their accuracy and speed [1-3]. Acoustic pulse reflectometry is now capable of measuring the internal radius at regular intervals along an instrument’s bore to within an accuracy of +/- 0.02 mm [4]. Indeed, its accuracy is such that instrument makers are beginning to use the technique as part of their quality control process. Meanwhile, capillary-based impedance measurement apparatus is now capable of determining the frequencies and amplitudes of an instrument’s resonances within a few seconds and with a high degree of repeatability [5]. Both techniques are now sufficiently accurate to make them extremely useful in looking for small physical and acoustical differences between instruments. It is worth noting that the input impedance of an instrument can be directly deduced from its bore profile and vice-versa so, in principle, it is only necessary to use one of the techniques when measuring an instrument. However, acoustic pulse reflectometry is primarily designed for determining bore information while capillary-based systems are optimised for measuring input impedance. Therefore, the two techniques are often used in combination.
Even the tiniest physical and acoustical variations over a set of instruments can result in musicians claiming that the instruments have noticeably different playing properties. To establish systematically whether musicians can perceive differences between nominally identical instruments, it is necessary to carry out controlled playing tests. Psychophysical testing is regularly used in the commercial sector to investigate whether consumers are able to discriminate between similar, but non-identical, products. Several methods have been developed for this purpose [6]. For example, the 2-alternative forced-choice test with warm- up has shown its efficiency as a test for discriminating between fizzy drinks containing various quantities of caffeine [7]. Methods of this type can be readily adapted to musical instrument playing tests.
The aims of this paper are (i) to demonstrate the suitability of acoustic pulse reflectometry and
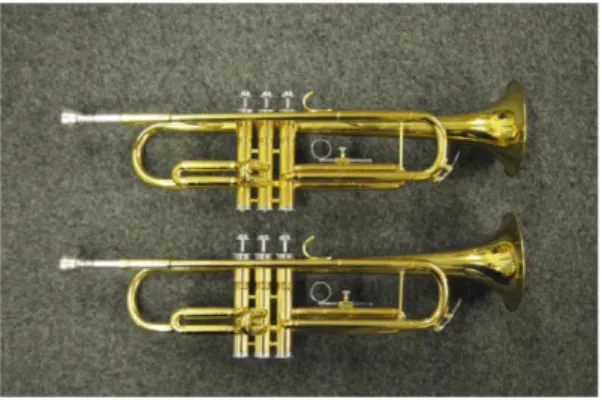
capillary-based impedance measurement apparatus for detecting physical and acoustical differences between instruments of the same model type produced by the same maker, and (ii) to demonstrate the effectiveness of psychophysical testing in establishing whether there are perceptible differences in the playing properties of such instruments. To this end, experimental measurements and controlled playing tests have been carried out using two low-cost, mass-produced Pearl River MK003 trumpets [18,19](see Figure 1).
Figure 1: Two Pearl River MK003 trumpets The current investigation is part of a wider study concerned with evaluating and improving the consistency of musical instrument manufacturing.
2
Physical measurements
2.1 Bore profile
Bore profile measurements have been made using the reflectometry technique for the two trumpets in every possible valve configuration. The results fall into two distinct groups. For those fingerings that involve the third valve being pressed down (i.e. V3, V1+V3, V2+V3, V1+V2+V3), the bore reconstructions of the two instruments are in close agreement. However, for those fingerings where the third valve is not pressed down (i.e. V0, V1, V2, V1+V2), the bore reconstructions diverge from the position of the third valve onwards.
An example is presented in Figure 3 which shows bore profile measurements for the two trumpets with no valves pressed down. The bore reconstruction for trumpet B begins to expand spuriously at an axial distance of approximately 0.58 m, which corresponds to the position of the third valve.
Figure 2: Bore reconstruction of the two trumpets when no valve is pressed down
This expansion clearly does not represent a physical change in the geometry of the instrument bore, as the act of pressing or depressing a valve does not affect the shape of the instrument bell. In fact, an unexpected expansion of this type in an acoustic pulse reflectometry bore profile measurement often indicates the presence of a leak in the wall of the instrument. As reported in [11], a leak presents a reduction in the impedance seen by the incoming pulse that is similar to the change in impedance caused by a widening of the instrument bore. Hence, the leak appears as a spurious expansion in the bore reconstruction. The consequence is that, if an instrument contains one or more leaks, only the section of the bore before the position of the first leak is reconstructed accurately. In [11], this feature is exploited to provide a method of detecting leaks in tubular objects.
Visual inspection of the third valve of trumpet B reveals a tiny hole in the wall of the lower channel. This channel forms part of the bore of the instrument when the valve is left in the open position. When the valve is pressed down, however, the lower channel is replaced in the instrument bore by the middle channel, the upper channel and a section of external tubing. This explains why the presence of the leak is only observed in bore reconstructions for fingerings where the valve is open. The hole is so small (with dimensions of approximately 650 m × 250 m) that it is hard to spot with the naked eye and would be difficult to detect without the help of the reflectometry technique.
2.2 Input impedance
Using the BIAS system, input impedance measurements have been made with the two trumpets in every possible valve configuration. The same mouthpiece was used for both trumpets and three measurements were made for each fingering to ensure that repeatable results were achieved (for all fingerings, the observed difference in the peak amplitudes for the three measurements was no greater than 2 MOhm, while the observed difference in the peak frequencies was no greater than 0.5 Hz). As with the bore profile measurements, the results fall in two distinct groups. For those fingerings that involve the third valve being pressed down, the input impedance measurements for the two instruments are in close agreement. However, for those
fingerings where the third valve is not pressed down, the impedance measurements show large differences.
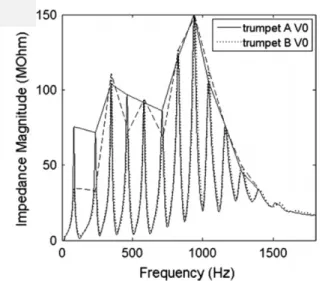
Figure 3: Input impedance of the two trumpets when no valve is pressed down
Figure 3 shows input impedance magnitude curves for the two trumpets with no valves pressed down. Large differences can be observed between the two curves. This is particularly true for the first two peaks, which have significantly lower amplitudes in the case of trumpet B. The difference in frequency between corresponding peaks is greater than 1 Hz for eight of the nine peaks. In fact, for three peaks the difference is greater than 5 Hz. This leads on to the difference in equivalent pitch between corresponding peaks being greater than 10 cents (1/10th of a musical semitone) in the majority of cases. Meanwhile, the difference in amplitude and quality factor between corresponding peaks is greater than 10% for four of the nine peaks. Indeed, for the first two peaks the difference in amplitude and quality factor is actually greater than 85%. Moreover, the peak frequencies for trumpet B are now all higher than those for trumpet A. This suggests that, for notes played using the V0 fingering, trumpet B might be expected to play sharper than trumpet A. In addition, for the four peaks where the differences are most significant, the peak amplitudes and quality factors for trumpet B are all lower than those for trumpet A. Therefore, for several notes played using this fingering, trumpet A might be expected to produce the notes more easily than trumpet B but with a less bright timbre. As the differences between the impedance curves are reasonably large, it is quite possible that these effects will be perceptible to a player.
3
Playing tests
Playing tests are generally used to collect musicians’ opinions on the playing characteristics and tonal qualities of instruments. The aim of such tests is usually to relate the subjective judgements of the players to the physical or acoustical properties of the instruments. For example, [14] carried out playing tests to investigate the vocabulary that musicians used when making judgements on a variety of different trumpets and then attempted to correlate the terms they used with acoustical properties. Similarly, [15] at- tempted to relate the perceptions of bassoonists regarding the playing properties of different crooks to differences in their geometries. Meanwhile, [16] implemented playing
tests on a French horn with different mouthpieces and then tried to correlate the musicians’ preferences with acoustical and geometrical properties. In all of these studies, playing tests were employed either to compare instruments (or components of instruments) produced by different makers or to compare different models of instrument (or component) produced by the same maker.
In this section, playing tests designed to compare the two Pearl River trumpets are described. These instruments are produced by the same manufacturer and are of the same model type.
3.1 Method
3.1.1 Participants
The playing tests were carried out by fifteen trumpet players. These trumpeters differed in their levels of expertise and experience. Two were professional players, six were students attending the trumpet performance section of the Conservatoire National Supérieur de Musique et de Danse de Paris (CNSMDP), and seven were amateur players (students attending other sections of the CNSMDP).
3.1.2 Procedure
The first stage of the tests involved evaluating the extent to which the trumpet players were able to perceive differences between the playing properties of the two Pearl River trumpets. In order to do this, each player undertook a 2-alternative forced choice (2-AFC) test [6,7] with warm-up. The test procedure is as follows. At the start of the test, the musician is given five minutes to play the two trumpets and become familiar with them. Following this, five warm-up trials are carried out in which the trumpets are presented in a random order. By playing them both, the player at- tempts to determine which instrument is trumpet A and which is trumpet B. After each warm-up trial, the player is informed whether they answered correctly or not. Finally, the pair of trumpets is presented twenty further times in random order and each time the musician is again asked to judge which instrument is which. Again, after each trial, the player is informed whether their answer was correct or not. To ensure the experience is as comfortable as possible, each musician plays the two trumpets using their own mouthpiece.
In order to minimise the possibility of a player identifying the trumpets from slight variations in their appearance or small differences in the mechanical operation of their valves, each test was carried out in a darkened room and the subject was required to play the trumpets without pressing any of the valves. Apart from this restriction, at all stages of the test the musician was free to play whatever notes, and at whatever dynamic level, they chose. In fact, the requirement that the trumpets be played with no valves pressed down was beneficial as this is one of the valve configurations which maximises the acoustical differences between the instruments (as the leak is only present in the bore of trumpet B when valve three remains unpressed).
According to the binomial probability distribution, the probability of an individual achieving 16 or more correct answers by chance over the 20 trials is only 0.59%. It can therefore be concluded that, at the 1% significance level, a
musician is able to consistently tell the two instruments apart if they exhibit at least 16 successes in the 2-AFC test. Those players who were able to consistently distinguish between the instruments proceeded to the second stage of the tests where their judgements on the relative qualities of the instruments were gathered. This involved each subject detailing the strategy that they used to discriminate the instruments and then filling out a closed questionnaire, which uses explicit criteria to compare the trumpets with respect to their sound quality and playability. Finally, each subject was asked to state the price that they would be prepared to pay for each trumpet.
3.2 Results and discussion
3.2.1 Subjects’ scores
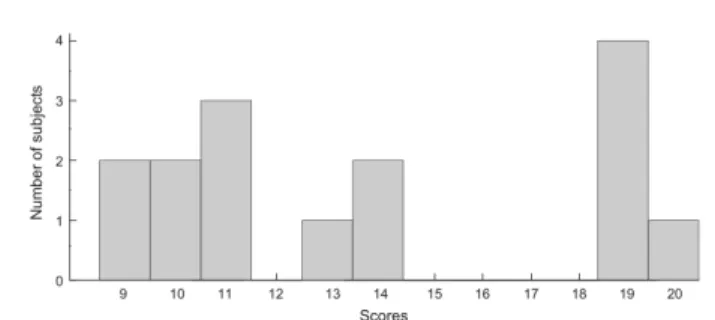
Figure 4: Histogram of the playing test scores achieved by the fifteen trumpeters
Figure 4 shows a histogram of the scores achieved by the subjects at the first stage of the playing tests. Five subjects demonstrated the ability to discriminate the two trumpets at the 1% significance level (indeed they all correctly identified the instruments at least 19 times out of the 20 trials). One of these five players was primarily a clarinettist and had only been learning the trumpet for 6 months. However, the remaining four players were students in the trumpet performance department of the CNSMDP. It might be hypothesised, therefore, that musicians currently undergoing studies in trumpet performance are more able to discriminate between the two instruments than those that are not currently receiving musical training. This hypothesis can be investigated by applying Fisher’s exact test to the playing test data (Fisher’s exact test is equivalent to the Chi-Square test but is applicable to small sample sizes). The calculated one-tail p value of 0.047 indicates that, for the fifteen players that participated in the playing test, there is a correlation at the 5% level between being able to discriminate the two instruments and being a trumpet student at the CNSMDP.
It is interesting to note that the two professional trumpeters were amongst the 10 players that were unable to discriminate the trumpets at the 1% significance level. However, they did both correctly identify the instruments correctly 14 times out of the 20 trials. They were, therefore, able to distinguish differences between the instruments at the 5% significance level.
3.2.2 Quality assessment
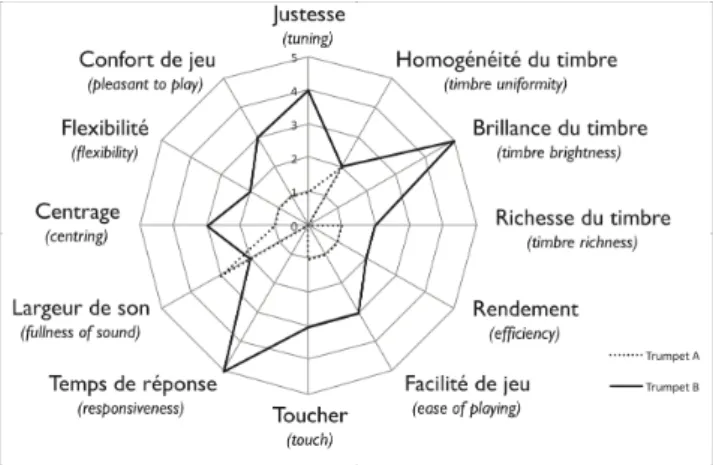
Figure 5 shows judgements on the relative playing qualities of the two trumpets made by the five players who
demonstrated the ability to discriminate between the instruments. The criteria, which the five trumpeters were asked to judge the instruments against, were taken from the work of [17], in which the terminology used by a group of players talking freely about the musical qualities of the trumpet was studied. The criteria relate both to the play- ability of the instruments and the quality of the sound produced by them. For example, in terms of playability, the criteria cover how easy each instrument is to play (ease of playing), how much sound is produced for a given player input (efficiency), how easy it is to change the pitch and timbre of notes through embouchure adjustment (flexibility), how quickly each instrument responds to a change in player input (responsiveness), and how accurately each instrument produces the sound that the player wishes it to (touch). Meanwhile, in terms of sound quality, the criteria consider how well tuned each instrument is (tuning), the brightness of the timbre produced (timbre brightness), the richness of the timbre produced (timbre richness), how uniform the timbre is over the pitch range (timbre uniformity), and the fullness of the sound produced (fullness of sound). The criteria also cover the level of tactile feedback each instrument provides to the lips (centring) and how pleasant each instrument is to play (pleasant to play).
For each of the categories, the figure shows whether a subject felt trumpet A fulfilled the criterion best or whether trumpet B fulfilled it best. The case where the subjects found no differences is not represented here. Examination of Figure 5 reveals that, for ten of the twelve categories, the majority of the players felt that trumpet B fulfilled the criteria better than trumpet A. The views of the players were equally split for the ‘‘timbre uniformity’’ category and it was only with regard to the fullness of sound produced by the instrument that more players perceived trumpet A as satisfying the criterion better. It is worth noting that the views of the five players for the ‘‘ease of playing’’ criterion were exactly the same as their views for the ‘‘pleasant to play’’ criterion, suggesting a possible redundancy between these two criteria.
Looking in more detail at the judgements of the individual players, subjects 1 and 4 both felt that trumpet A did not satisfy a single criterion better than trumpet B did, while subjects 3 and 5 each thought that trumpet A only fulfilled three criteria better than trumpet B did. Somewhat at odds with these views, subject 2 thought trumpet A fulfilled seven criteria better than trumpet B did. Interestingly, subjects 1, 3, 4 and 5 were the CNSMDP trumpet students while subject 2 was the student whose main instrument was the clarinet and who had only been studying the trumpet for six months.
From the subjective judgements displayed in Figure 5, it appears that the majority of the players generally preferred the playing properties of trumpet B to those of trumpet A. This is worthy of note, and is possibly somewhat surprising, given that trumpet B is the instrument which contains a leak in its bore as a result of a problem during manufacturing.
Figure 5: Preferences of players
Conclusion
The two trumpets that were employed in this study are low-cost, mass-produced instruments of the same model type. One of the trumpets contains a leak in the lower channel of its third valve and, consequently, the resonance properties of the two instruments differ significantly under certain valve configurations. Despite the physical disparity between the trumpets, the playing tests reported in this paper show that most subjects were unable to perceive differences between the two instruments, in terms of their playability.
However, there were some trumpet players who were able to consistently distinguish between the instruments in the playing tests. Those players who were able to differentiate between the two trumpets generally preferred the playing properties of trumpet B (and were prepared to pay more for it than trumpet A) even though this is the instrument that contains the manufacturing flaw.
From the point of view of manufacturing consistency, it is worth considering that only a third of the trumpeters who participated in the playing tests were able to consistently distinguish between the two instruments, despite the fact that one contains a leak part way along its bore. This defect therefore appears not to have been an issue for the majority of the players. Moreover, as only one amateur player was able to perceive a difference between the instruments, it could be argued that an adequate level of manufacturing consistency was achieved during the production of the trumpets, given that low-cost instruments of this type are generally aimed at beginner players rather than at professionals.
Acknowledgments
This work was carried out at the Open University while Adrien Mamou-Mani was Research Associate and Laetitia Placido was on placement from the Conservatoire National Supérieur de Musique de Paris (CNSMDP). The authors want to thank George Bloch, Charles Besnainou and the CNSMDP for facilitating the placement and for their help with arrangements for the psychophysical tests. The work was partly funded by the British Academy, the Royal Academy of Engineering and the Royal Society under the Newton International Fellowship scheme.
References
[1] Sharp DB. Increasing the length of tubular object that can be measured using acoustic pulse reflectometry. Measurement Science and Technology.
[2] Li A, Sharp DB, Forbes BJ. Increasing the axial resolution of bore profile measurements made using acoustic pulse reflectometry. Measurement Science and Technology. 2005;16:2011-9.
[3] Dalmont J-P. Acoustic impedance measurement, Part 1 : A review. Journal of Sound and Vibration. 2001;243(3):427-39
[4] Sharp DB. Acoustic pulse reflectometry for the measurement of musical wind instrument. University of Edinburgh; 1996.
[5] Widholm G, Pichler H, Ossmann T. BIAS: A Computer-Aided Test System for Brass Wind Instruments. An Audio Engineering Society Preprint. 1989(2834).
[6] Meilgaard MC, Civille GV, Carr BT. Sensory Evaluation Techniques (third edition): CRC 1999. [7] Griffiths RR, Vernotica EM. Is caffeine a flavoring
agent in cola soft drinks? Arch Fam Med. 2000;9:727-34.
[8] Buick JM, Kemp J, Sharp DB, van Walstijn M, Campbell DM, Smith RA. Distinguishing between similar tubular objects using pulse reflectometry: A study of trumpet and cornet leadpipes. Measurement Science and Technology. 2002;13:750-7.
[9] Li A, Sharp DB. The problem of offsets in measurements made using acoustic pulse reflectometry. Acta Acustica united with Acustica. 2005;91(4):789-96.
[10] Amir N, Rosenhouse G, Shimony U. A discrete model for tubular acoustic systems with varying crosssection - The direct and inverse problems. Parts 1 and 2: Theory and experiment. Acustica. 1995;81(5):450-74.
[11] Sharp DB, Campbell DM. Leak detection in pipes using acoustic pulse reflectometry. Acta Acustica united with Acustica. 1997;83:560-6.
[12] Backus J. Input impedance curves for the reed woodwind instruments. Journal of the Acoustical Society of America. 1974;56(4):1266-79.
[13] Backus J. Input impedance curves for the brass instruments. Journal of the Acoustical Society of America. 1976;60:470-80.
[14] Bertsch M, Waldherr K, Kausel W. Sensory evaluation testing of trumpets and correlation with acoustic measurements. In: Proceedings of forum acusticum 2005, 29 August–2 September 2005, Budapest, Hungary; 2005.
[15] Hill TJW, Sharp DB. Acoustical and psychoacoustical investigations of the effect of crook bore profile on the playability of bassoons. In: Proceedings of the stockholm music acoustics conference, 6–9 August 2003, Stockholm, Sweden; 2003.
[16] Plitnik GR, Lawson BA. An investigation of correlations between geometry, acoustic variables, and psychoacoustic parameters for french horn mouthpieces. J Acoust Soc Am 1999;106(2):1111–25. [17] Poirson E. Prise en compte des perceptions de
l’utilisateur en conception de produit. application aux instruments de musique de type cuivre. PhD thesis, Ecole Centrale de Nantes et Université de Nantes; 2005.
[18] Placido L., Mamou-Mani A., Sharp D., Investigating perceptual differences between two trumpets of the same model type, Applied Acoustics, 72(12), pp.907-914, 2011
[19] A. Mamou-Mani, D. Sharp, Evaluating the suitability of acoustical measurement techniques and psychophysical testing for studying the consistency of musical wind instrument manufacturing, Applied Acoustics, 71(7), pp. 668-674, 2010