HAL Id: hal-01915141
https://hal.archives-ouvertes.fr/hal-01915141
Submitted on 6 Mar 2020
HAL is a multi-disciplinary open access
archive for the deposit and dissemination of
sci-entific research documents, whether they are
pub-lished or not. The documents may come from
teaching and research institutions in France or
abroad, or from public or private research centers.
L’archive ouverte pluridisciplinaire HAL, est
destinée au dépôt et à la diffusion de documents
scientifiques de niveau recherche, publiés ou non,
émanant des établissements d’enseignement et de
recherche français ou étrangers, des laboratoires
publics ou privés.
Charged defects during alpha-irradiation of actinide
oxides as revealed by Raman and luminescence
spectroscopy
R. Mohun, L. Desgranges, P. Simon, G. Guimbretière, A. Canizares, F. Duval,
C. Jegou, M. Magnin, Nicolas Clavier, N. Dacheux
To cite this version:
R. Mohun, L. Desgranges, P. Simon, G. Guimbretière, A. Canizares, et al.. Charged defects during
alpha-irradiation of actinide oxides as revealed by Raman and luminescence spectroscopy. Nuclear
Instruments and Methods in Physics Research Section B: Beam Interactions with Materials and Atoms,
Elsevier, 2015, 374, pp.67 - 70. �10.1016/j.nimb.2015.08.003�. �hal-01915141�
1
Charged defects during alpha-irradiation of actinide oxides as revealed by Raman
and luminescence spectroscopy
Mohun R
a, Desgranges L
a, Simon P
b, Guimbretière G
b, Canizarès A
b, Duval F
b, Jegou C
c, Magnin M
C, Clavier
N
d, Dacheux N
da. CEA, DEN, DEC/SESC, Centre de Cadarache, 13108 Saint-Paul-lez-Durance
b. CNRS, UPR 3079 CEMHTI, et Université d’Orléans, 1D avenue de la Recherche Scientifique, 45071 Orléans c. CEA, DEN, DTCD, Centre de Marcoule, BP 17171, 30207 Bagnols sur Cèze
d. ICSM, UMR 5257 CEA/CNRS/UM2/ENSCM, Site de Marcoule, BP 17171, 30207 Bagnols sur Cèze
Abstract
We have recently evidenced an original Raman signature of alpha irradiation-induced defects in UO2. In this study, we aim to
determine whether the same signature also exists in different actinide oxides, namely ThO2 and PuO2. Sintered UO2 and ThO2
were initially irradiated with 21 MeV He2+ ions using a cyclotron device and were subjected to an in situ luminescence
experiment followed by Raman analysis. In addition, a PuO2 sample that has previously accumulated self-irradiation damage
due to alpha particles was investigated only by Raman measurement. Results obtained for the initially white ThO2 showed that
a blue color appeared in the irradiated areas as well as luminescence signals during irradiation. However, Raman spectroscopic analysis showed the absence of Raman signature in ThO2. In contrast, the irradiated UO2 and PuO2 confirmed the presence of
the Raman signature but no luminescence peaks were observed. These findings lead to propose a mechanism involving electronic defects in ThO2 while a coupling between electronic defects and phonons is needed to explain the Raman signal in
UO2 and PuO2.
Keywords: Alpha irradiation; Raman signature; Luminescence; Electronic defects
1. Introduction
Accurate determination of nuclear fuel behaviors in normal or accidental condition is a challenge for the nuclear industry in order to ensure its safety and profitability. Irradiation damages have a direct impact on the physical properties of the nuclear fuels and several theoretical works are currently in progress aiming to determine the stable point defect in UO2. Unfortunately,
limited experimental data is available to characterize irradiation defects in nuclear fuels. X-Ray diffraction and Transmission Electron Microscope evidenced changes in the crystalline structure and grain microstructure during irradiation [1-2]; however these methods are not well suited to evidence point defects. Recently [3] evidenced a specific signature of irradiation in UO2
using the Raman spectroscopy method. This signal corresponds to three additional peaks in the Raman spectrum of UO2
implanted with alpha ions and can be related to a single defect that is annealed between 300 and 525 °C [4]. According to [5] its creation kinetics can be modelled by a single impact model and has previously been used to describe UO2 cell parameter
behavior under irradiation. These results observed by Raman spectroscopy has characteristics similar to irradiation-induced point defects, and therefore deserved an in-depth characterization and understanding.
A striking feature of the Raman defect arises from its creation process. According to SRIM simulation code, a 25 MeV Helium ion beam will primarily lose its energy through electronic stopping. However, the electronic energy due to the alpha ions (dE/dx= 1keV/nm) is much weaker that the value reported in literature for creation of tracks by swift heavy ions [6]. In that range of deposited energy, only self-trapped excitons or colored defects could be formed [7]. To date the existence of such defect types has not been reported about irradiated UO2.
This paper is devoted to understand the behavior of three actinide oxides namely UO2, ThO2 and PuO2 since they all share the
same crystallographic structure, with similar mass, density and number of electrons. The study aims to examine the existence of electronic processes in these oxides. Moreover the energy deposited profile in all these compounds, as determined by SRIM, shows same trend and this suggests that they should have similar behavior under irradiation.
2. Experimental Procedures 2.1 Samples
Sintered UO2 and ThO2 samples were prepared at CEA-Cadarache and ICSM respectively. UO2 discs were heat treated at
1700°C under dry Ar/H2 while ThO2 was sintered at 1600°C in air. The discs were all mirror-polished at one side and then
annealed at 1000°C to maintain stoichiometry and also remove polishing damages. In this work, the pellets were sectioned into two-half discs along their cylindrical axis as it allows to correlate the penetration profile of the ions along the depth of the samples with simulated data as described in [3]. The irradiation was performed at the Cyclotron facility, CEMHTI Orléans (France) and it was possible to carry out both in situ (Ion-Beam Induced Luminescence) and ex situ (Visual and Raman) experiments.
2
A PuO2 sample was initially prepared at CEA-Cadarache and heat treated at 1700°C under reducing environment for 2 hours
back in 2011. The pellet showed a high alpha activity due to the presence of alpha emitters. To consider the effect of alpha ions, the PuO2 was left to decay for 2.5 years. The auto-irradiated pellet was later characterized with Raman spectroscopy in
2013.
2.2 Irradiations
The UO2 and ThO2 half-disks were all irradiated with 21 MeV He2+ during 2 hours and an ion flow of 50 nA using the
cyclotron device. The energy chosen was able to deliver more electronic energy ((dE/dx)E = 132 keV/µm) near the surface of
the pellets. All irradiations were carried out at room temperature and under vacuum condition so as to prevent any risk of pellet oxidation.
2.3 Ion-Beam Induced Luminescence Experiment (In situ)
The luminescence set-up used to monitor the behavior of UO2 and ThO2 during irradiation consisted of an optical set-up of a
pyrometer probe implemented on the CEMHTI cyclotron beam line and positioned in the direction of the pellet’s surface exposed to the irradiation beam. An optical fiber coming from the pyrometer probe-head was connected to a one-grating monochromator (SR 163 Shamrock Andor) and an ICCD multichannel detector (Andor iStar DH720) all located in a safety room 20m away from the irradiation cell, by means of optical fibers and electrical cables.
2.4 Raman measurement (Ex situ)
A Renishaw RA-100 Raman Analyzer was used to characterize fuel oxides before and after irradiation. A 633 nm He-Ne was initially employed and each Raman spectrum was acquired through an exposure time of 40s for a wavelength ranging from 300 to 700 cm-1. A second step consisted of analyzing the irradiated pellets using a 532 nm green laser so as to confirm the
presence of Raman signals.
A similar procedure was applied for PuO2; however with a different experimental procedure. This set-up variance was
necessary since the sample was within a glove box to prevent radiological contamination. Hence, the Raman head was placed outside the box and the laser was focused onto the sample passing through the glass of the glove compartment (Mitutoyo x20 objective, 30mm front distance).
3. Results
3.1 Ion-Beam Induced Luminescence
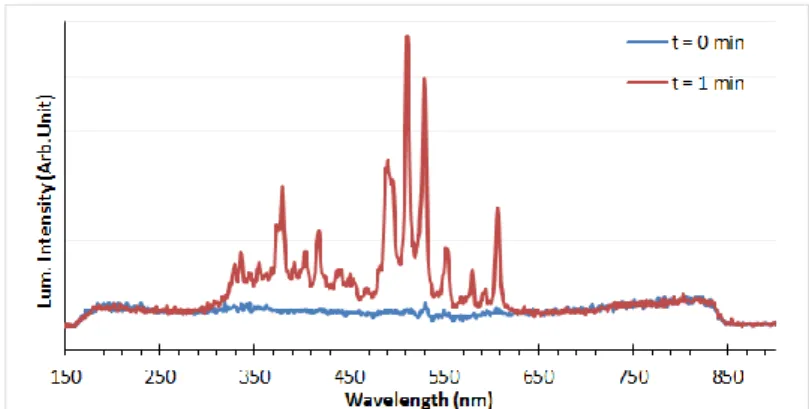
The luminescence spectrum of ThO2 was recorded for a wavelength ranges from 200 to 800 nm during irradiation as shown in
Fig. 1. Before irradiation (t= 0min), the ThO2 sample emits no luminescence signals. The spectrum is largely modified given
the number of peaks appearing during the initial stage of the He2+ beam. It can be seen that more emission occurs between 300
nm to 620 nm which could be related to the formation of electronic defects in the material as discussed by [8]. However under the same irradiation conditions, no luminescence peaks were observed in UO2 and the spectrum remained unchanged even
when the ion flow was increased from 50 nA up to 200 nA. This result provides evidence that a different defect mechanism is involved in UO2 compared to ThO2.
Fig. 1. Luminescence spectrum of ThO2 during 21 MeV He2+ and 50nA ion flow
3.2 Visual Inspection
The UO2 and ThO2 samples were both visually compared. Although UO2 exhibited no significant change in its physical
appearance, the sections of the initially white ThO2 exposed to the irradiation beam turned into a deep blue color (Fig. 2). The
coloration of ThO2 has previously been observed [9, 10, 11-12] and [13] reported that it take its origin from colored defects
3
Fig. 2. ThO2 pellet (a) before and (b) after irradiation respectively
3.3 Raman Spectroscopy 3.3.1 Before Irradiation
As described in section 2.4, the 633 nm was initially used for the acquisition of the Raman spectra of the virgin pellets (Fig. 3). According to its phonon dispersion curves [14-15], UO2 has a single Raman active mode which corresponds to the symmetric
T2g vibration mode occurring at 445cm-1 [16-17]. The T2g peak is also signature of oxides exhibiting the fluorite structure
sharing the Fm3m space group. Another peak with a small intensity appears at 575 cm-1 which is attributed to the LO phonon
[18]. It is Raman forbidden in virgin UO2 and can be due to the presence of oxygen vacancies in the FCC structure [5]. ThO2,
sharing the same fluorite structure as UO2, has its T2g peak occurring at 465cm-1 as shown in Fig. 3(b).
Fig. 3. Raman spectrum of (a) virgin UO2 and (b) ThO2 samples
Unfortunately, the initial Raman characterization of PuO2 just after the heat treatment could not be carried out. The structure of
PuO2, identical to that of UO2, is a fluorite one with an Oh space group and has previously been studied by Raman
spectroscopy [19]. It has its T2g phonon peak occurring at 477 cm-1 [20].
3.3.2 Post-Irradiation
The Raman measurement was done on a cross-section of each irradiated half-disc at a distance of 106 µm from the surface. This corresponds to the region where maximum electronic energy was deposited during irradiation. The results obtained from this characterization are described below.
UO2 & PuO2 Spectra
Fig. 4(a) shows the Raman spectrum of irradiated UO2 when analyzed with the 633 nm laser. It can be seen that along with the
T2g, there are the presence of three additional peaks in the 500-700 cm-1 range denoted as U1 (~ 527 cm-1), U2 (~ 572 cm-1) and
U3 (~ 630 cm-1). They have previously been observed and interpreted differently [3-5].
Raman theory states that if these three peaks were to represent a change in polarisability connected to the phonons of the compound, then they should still appear, either with a lower or higher intensity, even if a different laser for the analysis is used. Hence, the characterization was again carried out with the 532 nm green laser. Comparing the spectrum obtained from the 633 nm to that of the 532 nm laser, it can be observed that the peaks appear at the same position which confirms the origin as Raman signals for these UO2 lines.
The obtained results for PuO2 are similar with those previously observed after irradiating UO2. Fig. 4(b) illustrates that the
peaks remain at the same positions with different lasers and hence this also argues for a Raman origin of these lines in PuO2.
(a) (b)
4
Fig. 4. Raman spectra of (a) UO2 (b) PuO2 when characterized using the 633 nm red & 532 nm green laser
ThO2 Spectra
The Raman spectrum of ThO2 (Fig. 5) shows that the 633 nm laser reveals the presence of four additional irradiation-induced
peaks at 514 cm-1, 539 cm-1, 590 cm-1 and 622 cm-1. However, the subsequent characterization with the 532 nm laser shows
that they fall to different positions, and moreover with different intensities. These results help to state that the peaks in ThO2 do
not correlate to Raman scattering.
A luminescence mechanism can better explain the presence of these peaks. The energy of the photons from the laser is just sufficient to cause an absorption/emission process between different electronic energy levels in the material. The photons resulting from this process will be detected and appear as additional peaks on the Raman spectrum.
Fig. 5. Raman spectra of ThO2 with 633nm and 532nm
4. Discussions
The results from the different experiments proved that ThO2 behaves differently under irradiation and this can be translated as
an occurrence of a different mechanism of irradiation defects compared to UO2 and PuO2. Our study was mainly focused on
the effect of electronic energy; therefore the stoichiometric nature of these compounds needs to be taken into account so as to propose a suitable mechanism of irradiation damage model in each case.
In UO2, U(III) and U(V) oxidation states can exist as well as the regular U(IV) [21]; while Pu(III) can also be formed in
addition to Pu(IV) in PuO2 [22]. Thorium tends to form stoichiometric oxides and the most stable oxidation state remains +4
[23]. Hence based on the stoichiometry difference of these actinides, the following possible irradiation defects models are proposed.
4.1 Mechanisms of Irradiation defects in ThO2
According the Bethe stopping power theory, around 11.55 keV is transferred to one electron during 21 MeV helium beam irradiation conditions. This energy is largely enough to enhance electronic defects, causing the excitation of an electron from the valence band up to the conduction band. Considering the stoichiometry nature of ThO2, the electron will tend to decay back
and recombine with its associated hole. This decay evidences the existence of a radiative channel which is consistent with the Ion-Beam Induced luminescence signals. This process does not have any effect on the normal lattice vibrations, thereby explaining the absence of Raman signals. On the other hand, the electrons are also involved in the formation of colored defects associated with the blue color in the irradiated ThO2 [24-25].
(a)
(b)
5
4.2 Mechanisms of Irradiation defects in UO2/PuO2
A unique mechanism could be held responsible for the irradiation defects in UO2 and PuO2. The initial stage can be described
as similar to that of ThO2 whereby electronic defects are involved. However, absence of the luminescence signals proves that
no such radiative channel exists in these oxides. This can be correlated with the nature of these compounds since once in the conduction band and instead of trying to decay to retain stoichiometry, the electrons will tend to interact with the atoms in the lattice thereby causing an eventual change in the polarization of the phonons. This process is better defined as an electron-phonon coupling due to polarons [26, 27, 28-29] and will limit the light emission characteristics of UO2. Moreover the
similarity of the Raman triplet in UO2 and PuO2 sustains an intrinsic origin, due to the fluorine structure.
5. Conclusion
To better define the mechanism of irradiation defects in different actinides due to the effect of alpha-irradiation, UO2 and ThO2
were externally irradiated with helium beam using a Cyclotron facility. The pellets were then characterized using luminescence, visual and Raman methods. On the other hand the PuO2, being too radioactive, had to be manipulated in a glove
box and it was only possible to perform visual and Raman analyses.
This study shows that although ThO2 shares similar characteristics as UO2 and PuO2, its mechanism of defect creation is totally
different. Obtained results for the initially white ThO2 showed that a blue color appeared in the irradiated areas and also the
presence of luminescence signals during irradiation, while no new peaks were observed in its Raman spectrum. On the other hand, a Raman signature were observed during the post-mortem measurements of UO2 and PuO2, however no color change
took place and the experimental set-up gave no indications of any luminescence signals. The results showed the existence of a radiative channel involving electronic defects in ThO2 while in UO2 and PuO2 the presence of a coupling between electronic
defects and phonons was confirmed due to the Raman signature.
References
[1] H. Palancher , N. Wieschalla, P. Martin, R. Tucoulou, C. Sabathier, W. Petry, J.-F. Berar, C. Valot and S. Dubois, J Nucl. Mat. 385 (2009
449-455).
[2] I.L F. Ray, H. Thiele and Hj. Matzke, J Nucl Mater. 188 (1992) 90-95.
[3] G. Guimbretière, L. Desgranges, A. Canizarès, G. Carlot, R. Caraballo, C. Jégou, F. Duval, N. Raimboux, M. R. Ammar and P. Simon,
Appl. Phys. Lett. 100 (2012) 251914.
[4] L. Desgranges, G. Guimbretière, P. Simon, F. Duval, A. Canizarès, R. Omnee, C. Jégou and R. Caraballo, Nucl. Instr. Methods B 327
(2014) 74-77.
[5] G.Guimbretière, L. Desgranges, A. Canizares, R. Caraballo, F. Duval, N. Raimboux, R. Omnée, MR Ammar, C. Jégou, P. Simon, Appl.
Phys.Lett 103 (2013) 041904.
[6] T. Wiss, Hj. Matzke, C.Trautmann, M. Toulemonde, and S. Klaumünzer, J. Nucl Mater. 122 (1997) 583-588. [7] R.T. Williams and K.S. Song, J. Phy. Chem. 51 (1990) 679-716.
[8] S. Watanabe,W.E.F. Ayta, J.R.B. Paiao, G.M. Ferraz, T.M.B. Farias and N.F. Cano, J. Phys. D: Appl. Phys. 41 (2008) 105401. [9] J.M. Bodine, F.B. Theiss, Phys. Rev. 98 (1955) 1532.
[10] O.A. Weinreich, W.E. Danforth, Phys. Rev. 88 (1952) 953. [11] R.C. Linares, J. Phys. Chem. Solids 28 (1967) 1285.
[12] J.L. Bates, Techn. Rep. BNWL-457, Contract At (45-1)-1830 (1967) 16. [13] T.R. Griffiths, J. Dixon, Inorganica Chimica Acta 300–302 (2000) 305–313. [14] Dolling, Cowley, Woods, Can. J. Phs. 43, 1397 (1965).
[15] Cowley, Dolling, Phys. Rev. 167, 464 (1968).
[16] L. Desgranges, G. Baldinozzi, P. Simon, G. Guimbretière and A. Canizarès, J. Raman Spectrosc. 43 (2012) 455-458.
[17] R. Böhler, A. Quainic, L. Capriottic, P. Çakırd, , O. Beneša, , K. Boboridisa, , A. Guiota, L. Luzzic, R.J.M. Koningsa, and D. Manara, J.
Alloys and Compounds. 616 (2014) 5-13.
[18] T. Livneh, E. Sterer. Phys. Rev. B. 73 (2006) 085118.
[19] C. Jégou, R. Caraballo, S. Peuget, D. Roudil, L. Desgranges and M. Magnin, J. Nucl Mater. 405 (2010) 235–243. [20] M.J. Sarsfield, R.J. Taylor, C. Puxley and H.M. Steele, J. Nucl Mater. 427 (2012) 333-342.
[21] A. Jackson, A. D. Murray, J. H. Harding and C. R. A. Catlow, Phil. Mag A. 53 (1986) 27-50.
[22] S. D. Conradson , B. D. Begg ,D. L. Clark , C. D. Auwer , F. J. Espinosa-Faller ,P. L. Gordon ,N.J. Hess , R. Hess , D. W. Keogh , L.
A. Morales , M. P. Neu ,W. Runde , C. D. Tait , D. K. Veirs and P. M. Villella, Inorg. Chem. 42 (2003) 3715–3717.
6
[24] B.G. Childs, P.J. Harvey and J.B. Hallett, J. Am. Chem. Soc. 53 (1970) 431. [25] V. I. Neeley, J.B. Gruber and W. J. Gray, Phy. Rev. 158 (1967) 809.
[26] J.M. Casado, J.H. Harding and G.J. Hyland, J. Phys.: Condens. Matter 6 (1994) 4685. [27] C. Ronchi, M. Sheindlin, M. Musella and G. J. Hyland, J. Appl. Phys. 85 (1999) 776. [28] Y.Q. An, A.J. Taylor, T. Durakiewicz, and G.Rodriguez, J. Phys. Conf. 273 (2011) 012144. [29] P. Ruello, G. Petot‐Ervas, C. Petot and L.Desgranges, J. Am. Ceram. Soc. 88 (2005) 604.