HAL Id: hal-01851411
https://hal.archives-ouvertes.fr/hal-01851411
Submitted on 30 Jul 2018
HAL is a multi-disciplinary open access
archive for the deposit and dissemination of
sci-entific research documents, whether they are
pub-lished or not. The documents may come from
teaching and research institutions in France or
abroad, or from public or private research centers.
L’archive ouverte pluridisciplinaire HAL, est
destinée au dépôt et à la diffusion de documents
scientifiques de niveau recherche, publiés ou non,
émanant des établissements d’enseignement et de
recherche français ou étrangers, des laboratoires
publics ou privés.
Language Modelling for the Clinical Semantic Verbal
Fluency Task
Nicklas Linz, Johannes Tröger, Hali Lindsay, Alexandra Konig, Philippe
Robert, Jessica Peter, Jan Alexandersson
To cite this version:
Nicklas Linz, Johannes Tröger, Hali Lindsay, Alexandra Konig, Philippe Robert, et al.. Language
Modelling for the Clinical Semantic Verbal Fluency Task. LREC 2018 Workshop RaPID-2: Resources
and ProcessIng of Linguistic, Para-Linguistic and Extra-Linguistic Data from People with Various
Forms of Cognitive/Psychiatric Impairments, May 2018, Miyazaki, Japan. �hal-01851411�
Language Modelling for the Clinical Semantic Verbal Fluency Task
Nicklas Linz
1, Johannes Tr¨oger
1, Hali Lindsay
1, Alexandra K¨onig
2,
Philippe Robert
2, Jessica Peter
3and Jan Alexandersson
1 1German Research Center for Artificial Intelligence (DFKI), Germany 2Memory Clinic, Association IA, CoBTek Lab - CHU Universit´e Cˆote d’Azur, France 3University Hospital of Old Age Psychiatry and Psychotherapy, University of Bern, SwitzerlandAbstract
Semantic Verbal Fluency (SVF) tests are common neuropsychological tasks, in which patients are asked to name as many words belonging to a semantic category as they can in 60 seconds. These tests are sensitive to even early forms of dementia caused by e.g. Alzheimer’s disease. Performance is usually measured as the total number of correct responses. Clinical research has shown that not only the raw count, but also production strategy is a relevant clinical marker. We employed language modelling (LM) as a natural technique to model production in this task. Comparing different LMs, we show that perplexity of a persons SVF production predicts dementia
well (F1 = 0.83). Demented patients show significantly lower perplexity, thus are more predictable. Persons in advanced stages of
de-mentia differ in predictability of word choice and production strategy - people in early stages only in predictability of production strategy. Keywords: Dementia, Alzheimer’s Disease, Semantic Verbal Fluency, Language Modelling, Machine Learning
1.
Introduction
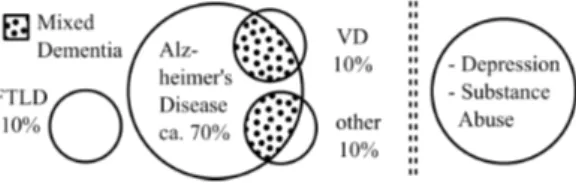
Verbal fluency is among one of the most widely used neu-ropsychological standard tests. Category fluency, or seman-tic verbal fluency (SVF), requires a parseman-ticipant to produce as many different items from a given category, e.g. animals, as is possible, in a given time frame. Over the past years, a growing body of research substantiates the discriminative power of semantic fluency for multiple different patholo-gies: neurodegenerative diseases such as Alzheimer’s dis-ease (Pakhomov et al., 2016; Raoux et al., 2008; Auria-combe et al., 2006; Gomez and White, 2006; Henry et al., 2004), Parkinson’s disease (Henry and Crawford, 2004), psychiatric disorders such as schizophrenia (Robert et al., 1998), Primary Progressive Aphasia (PPA) and its subforms (Bonner et al., 2010; Marczinski and Kertesz, 2006), as well as focal lesions (Troyer et al., 1998). Traditionally, SVF is one of the most broadly used test to diagnose de-mentia and it’s multiple subforms (see Figure 1).
As is standard clinical procedure, performance in this test is evaluated as the raw word count (count of cor-rect responses). In order to differentiate between multi-ple pathologies, qualitative measures have been established which serve as additional indicators in tandem with the raw word count (Gruenewald and Lockhead, 1980; Troyer et al., 1997). There is broad evidence that those qualitative SVF measures serve as indicators for underlying cognitive pro-cesses; this has been investigated to the extent that verbal fluency can be considered as a multifactorial task, compris-ing both executive control and memory retrieval processes (Henry et al., 2005; Robert et al., 1998; Troyer et al., 1997). Considering the involvement of the two distinct cognitive processes, Troyer et al. (1997) first introduced a systematic framework to calculate measure for both processes from the response behaviour of a subject. In general, produc-tion of words is organised in spurts—temporal clusters— followed by pauses, implying the lexical search for se-mantic fields or subcategories between clusters, and
re-Figure 1: The left panel shows different dementia types and their underlying causes, including Fronto-Temporal Lobar Degeneration (FTLD), and Vascular Dementia (VD); the dotted areas indicate those cases where more than one cause underlies the disorder. The right panel shows other, mostly reversible, causes for dementia-like symptoms.
trieval/production of words within clusters (Gruenewald and Lockhead, 1980; Troyer et al., 1997). This means, that between temporal clusters, executive search processes— switching—and within temporal clusters, semantic mem-ory retrieval processes—clustering—are engaged. The un-derlying notion is that temporal clusters correspond to se-mantic clusters; in other words, ”words that comprise these temporal clusters tend to be semantically related” (Troyer et al., 1997, p. 139).
In this paper we use statistical language models (LMs) as a tool for modelling production of SVF responses of healthy patients, those with a diagnosis of mild cognitive impair-ment (MCI1) and Alzheimer’s disease or related
demen-tia (ADRD). LMs intuitively model production of words in SVF, as production of the next word depends on the pre-viously produced words. Given a corpus of SVF perfor-mances, we use LMs to learn these probabilities from data, and then test the model, by estimating the likelihood of a patient’s SVF performance. We use the LM’s perplexity of a given SVF performance — a score for how well the
1MCI is associated with an increased risk to develop manifest
model is able to predict a given sequence — as a feature for classification of a person’s cognitive health.
This paper is structured as follows: Section 2. discusses prior work on clinical applications of language models and perplexity scores. Section 3. introduces language models. Section 4. describes the data for further experiments, how the language models were trained and evaluated in a clas-sification experiment. Section 5. presents results of the conducted experiments. Lastly, Section 6. discusses impli-cations and concludes the paper.
2.
Related Work
There is a growing body of research using language mod-elling and perplexity scores for classification of neurocog-nitive disorders including Alzheimer’s disease (AD), vary-ing types of dementia, and frontotemporal lobar degenera-tion (FTLD).
In previous work, perplexity scores have been used to au-tomatically classify between AD patients’ and healthy con-trols’ speech (Wankerl et al., 2017). Language models were built on transcripts from spontaneous speech of subjects de-scribing the Cookie Theft Picture from the Boston Diagnos-tic Aphasia Examination battery. The resulting language models based on AD speech and control subjects’ speech were then used to compute different perplexity scores per patient including perplexity of an AD language model given an AD speech sample and perplexity of an AD language model given a control speech sample. The authors conclude that perplexity in such a free speech task is higher for AD samples than healthy controls, which could be interpreted as evidence for the deterioration of expressive language ca-pabilities over the course of AD.
Using free speech from autobiographic interviews — a more liberal scenario for natural language — Weiner et al. used perplexity scores to automatically discriminate between general dementia patients and healthy controls (Weiner et al., 2017). Multiple-hour interviews (98 sub-jects, 230 hours) were cleaned of experimenter speech in-terventions and transcribed both manually and by an auto-matic speech recognition (ASR) system. Based on the raw audio signal and transcripts, the authors compared classifi-cation results using both automatically and manually gen-erated feature sets divided into acoustic features, linguis-tic features and ASR features. Perplexity scores were re-ported as ASR features, differentiated into within and be-tween subject perplexity. The authors concluded that au-tomatic classification is feasible and report within/between speaker perplexity as two of their best performing features. Similarly to Wankerl et al.(2017), other researchers used manual transcripts from speech of the Cookie Theft Pic-ture description task and language models built on healthy controls’ speech to differentiate between different forms of FTLD (Pakhomov et al., 2010). Results show that perplex-ity scores discriminate well between different subforms of FTD: behavioural variant of the FTLD and semantic de-mentia. This is in line with the notion that the behavioural FTD variant manifests not primarily in corrupted language but semantic dementia does. The authors also correlated perplexity scores with results from common neuropsycho-logical tests, such as SVF: the free speech task perplexity
scores negatively correlate with the SVF task. This is per-fectly in line with the semantic retrieval problems in seman-tic dementia, manifesting in a very low SVF word count (i.e., high perplexity due to corrupted free speech and low SVF score).
The underlying latent objective of free speech tasks is, by nature, to produce syntactically correct speech. Using a lan-guage model trained on healthy controls, perplexity mea-sures how people are not able to produce such an output following the given objective. In the semantic verbal flu-ency task however, the inherent objective is to produce as many items as possible which necessarily requires to ex-ploit deeper semantic stock. As the objective is also to not produce repetitions, to be successful one has to produce se-quences of increasingly rare items to maintain a high pro-duction rate towards the end of the task; this follows as the common easy-to-access semantic items are typically pro-duced at the beginning of the timed task.
There is broad evidence, proving that demented persons have significant difficulties in the SVF task which mani-fests not only in a lower SVF raw count, but also in ineffi-cient semantic stock exploitation strategies. In other words, demented patients are, especially towards the second half of such a task, not able to produce rare/repetition-free quences of correct item responses. This lack of strategic se-mantic memory exploitation can be observed through mul-tiple computational approaches (Woods et al., 2016), allow-ing to automatically compute semantic exploitation mea-sures which compare the patient’s sequence of words to a global semantic representation inferred from large text cor-pora leveraging either graph theory (Clark et al., 2016) or neural word embeddings (Linz et al., 2017a).
Recent work on the qualitative computational analysis of the SVF in demented patients shows that features based on neural word embeddings discriminate well between healthy controls and dementia types. Especially semantic density— the lexical coverage of a patients semantic exploitation— and word frequency—the lexical rareness of a patients pro-duced items—have been shown to be very predictive and highly significant features in this task (Linz et al., 2017b). In general, demented persons are less successful in the SVF task as they are less able to systematically exploit a large distributed semantic stock and produce sequences of rela-tively rare items.
Therefore the aim of this study was to explore the possibil-ity of a SVF language model to detect inefficient SVF pro-duction strategies, thus dementia. This represents a novel approach, as to the authors’ knowledge, perplexity has so far only been used to detect language corruption.
3.
Background
Statistical Language Models are a common tool for rep-resenting the probability distribution of language data, in either written or spoken form. After computing these mod-els, they can be used to determine the probability of a given sequence of words.
To train a model, a corpus is split into a list of n-grams, a sequence of words of length n, N = (w1. . . wn). The
likelihood estimation (MLE):
P (N ) = P (wn|w1...wn−1) =
P (w1...wn)
P (w1...wn−1)
(1)
The model stores the counts of all the n-grams in the corpus, thus ‘training’ it. To evaluate the probability of getting a certain sequence of words of length m, S = (w1...wm),
from our model, based on the Markov assumption, we can multiply the probability of each ngram in the sequence.
P (S) =
m
Y
i=1
P (wi|w1...wi−1) (2)
Unigram models are simple models where the probability of every type, or unique word, is equivalent to the relative frequency of the word in the training set. Because unigrams assume that every word does not depend on any of the pre-vious words, they does not capture the relationships be-tween words. This is why we continue with the bigram and trigram models, where conditional probabilities are used in training.
One challenge of language modelling is data sparsity as we will never encounter every possible combination of n-gram that can be generated during training. Data sparsity makes it likely that our model will encounter unseen n-grams dur-ing testdur-ing and assign them a probability of zero, causdur-ing P (S) = 0. To counter this, language models employ a technique known as smoothing, in which some of the prob-ability mass of seen n-grams is shifted to unseen n-grams. Lidstone smoothing (Lidstone, 1920) is an additive smooth-ing technique in which an ’unknown’ token is added, as a placeholder, to our training set. Then, a predetermined α is added to every n-gram count. Any n-grams that appear in testing, and that were not seen in training, will be accounted for by the ’unknown’ token. The counts of the n-grams are then normalized by adding the count of the n-gram’s his-tory, C(w1...wn−1), to the size of the vocabulary of the
n-gram’s history, V , multiplied by α. After smoothing, the probability of an n-gram is represented by:
P (wn|w1...wn−1) =
C(w1...wn) + α
C(w1...wn−1) + V α
(3) After calculating the smoothed probability distribution of a training set, language models can be evaluated on a test sample using a measure called perplexity. Perplexity is a score that shows how well a trained model predicts a test sample by taking the probability of the test sample and nor-malizing it by the number of words in the test sample. Per-plexity is computed by the following equation:
P P L(S) = 1 m s m Q n=1 P (wn|w1...wn−1) (4)
Perplexity and probability are inversely related, so when perplexity is minimized, probability is maximized. This means a low perplexity indicates that the model fits the test sample well. HC MCI ADRD N 40 47 79 Age 72.65 (8.3) 76.59∗(7.6) 79.0∗(6.1) Sex 8M/32F 23M/24F 39M/40F Education 11.35 (3.7) 10.81 (3.6) 9.47∗(4.5) MMSE 28.27 (1.6) 26.02∗(2.5) 18.81∗(4.8) CDR-SOB 0.47 (0.7) 1.68∗(1.11) 7.5∗(3.7)
Table 1: Demographic data and clinical scores by diagnostic group; mean (standard deviation); Signifi-cant difference (p < 0.05) from the control popula-tion in a Wilcoxon-Mann-Whitney test are marked with
∗; HC=’Healthy control’, MCI=’Mild cognitive
impair-ment’, ADRD= ’Alzheimer’s disease and related disor-ders’; MMSE=’Mini-Mental-State-Examination’; CDR-SOB=’Clinical Dementia Rating Scale - Sum of boxes’.
4.
Methods
4.1.
Data
The data used for the following experiments was collected during the Dem@Care (Karakostas et al., 2014) and ELE-MENT (Tr¨oger et al., 2017) projects. All participants were aged 65 or older and were recruited through the Memory Clinic located at the Institute Claude Pompidou in the Nice University Hospital. Speech recordings of elderly people were collected using an automated recording app on a tablet computer and were subsequently transcribed following the CHAT protocol (MacWhinney, 1991). Participants com-pleted a battery of cognitive tests, including a 60 second animal SVF test. Furthermore, all participants completed the MMSE (Folstein et al., 1975) and CDR (Morris, 1997). Following the clinical assessment, participants were cate-gorised into three groups: Control participants (HC) di-agnosed healthy after assessment, patients with MCI and patients that were diagnosed as having Alzheimer’s Dis-ease or related disorders (ADRD). AD diagnosis was de-termined using the NINCDS-ADRDA criteria (McKhann et al., 2011). Mixed/Vascular dementia was diagnosed ac-cording to ICD 10 (World Health Organization, 1992) cri-teria. For the MCI group, diagnosis was conducted accord-ing to Petersen criteria (Petersen et al., 1999). Participants were excluded if they had any major auditory or language problems, history of head trauma, loss of consciousness, or psychotic or aberrant motor behaviour. Demographic data and clinical test results by diagnostic groups are reported in Table 1.
4.2.
Language Modelling
Based on our three patient populations (HC, MCI, ADRD), we construct three LMs: (1) trained only on the healthy population, (2) trained only on the impaired population (MCI + ADRD) and (3) trained on all patient data, regard-less of diagnosis.
For each training set we build unigram, bigram and tri-gram models. We stop at tritri-grams, since given our vocabu-lary (n=238) the possible number of trigrams is 13,481,272 and our corpus only contains 2,203 trigram tokens, leading to extreme sparsity. We apply Lidstone smoothing to the
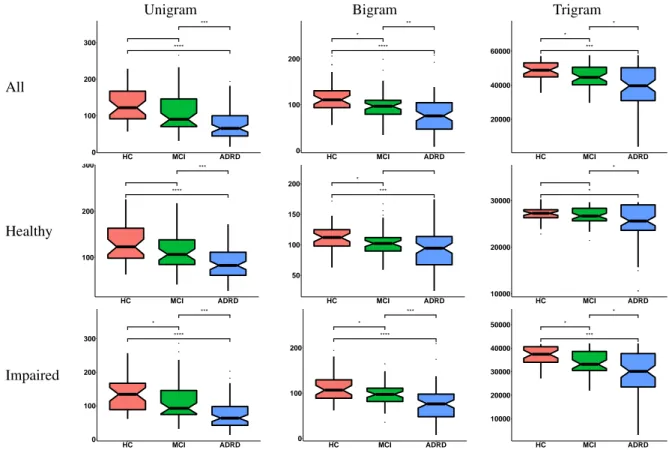
Unigram Bigram Trigram All ● ● **** *** 0 100 200 300 HC MCI ADRD ●● ● ● ● ● ● **** * ** 0 100 200 HC MCI ADRD *** * * 20000 40000 60000 HC MCI ADRD Healthy **** *** 100 200 300 HC MCI ADRD ● ● ● ● *** * 50 100 150 200 HC MCI ADRD ● ● ●● ● * * 10000 20000 30000 HC MCI ADRD Impaired ● ● ● ● **** * *** 0 100 200 300 HC MCI ADRD ● ● ● ● ● **** * *** 0 100 200 HC MCI ADRD *** * * 10000 20000 30000 40000 50000 HC MCI ADRD
Figure 2: Boxplots of perplexity in relation to diagnostic criteria for all three sets of language models. The HC group is depicted in red, the MCI group in green and the ADRD group in blue. Horizontal brackets indicate group comparisons by a Wilcoxon-Mann-Whitney test (∗: p ≤ 0.05,∗∗: p ≤ 0.01,∗∗∗: p ≤ 0.001,∗∗∗∗ : p ≤ 0.0001).
model with α = 1.
Due to the nature of our training samples, lists of animals, and leave one out method of cross validation, we have a small vocabulary and do not expect a high amount of un-seen tokens in the testing sequence, compared to natural language, making this a justifiable method of smoothing on this data set.
Perplexity is calculated as described in Equation 4. For models (1) and (2) we discriminate between the training population and the rest. Let At = a1, ..., ambe the
train-ing population and Ar = am+1, ..., an the rest of the
sam-ples. Then we perform leave-one-out cross validation on At, generating one perplexity value for the held-out sample
ai and each sample in Ar, per iteration. In the end, every
sample in At has one perplexity value and every sample
in Arhas m perplexity values. Averaging the m values per
sample, leaves us with one perplexity value per sample. For (3) we perform a simple leave-one-out cross validation on the complete set a1, ..., an, yielding one perplexity value
per patient.
4.3.
Classification
To confirm the diagnostic power of perplexity, we per-form a simple classification experiment. Each person in the database was assigned a label relating to their diagno-sis (HC, MCI and ADRD). Perplexity values from different models were used as input to classification models. All fea-tures were normalised using z-standardisation.
In all scenarios we use Support Vector Machines (SVMs) (Cortes and Vapnik, 1995) implemented in the scikit-learn
framework (Pedregosa et al., 2011). We use a radial bases kernel, since there is only one feature (Hsu et al., 2010) and 10-fold cross validation was used for testing. To find a well-performing set of hyperparameters, parameter selec-tion using cross-validaselec-tion on the training set of the inner loop of each cross validation iteration was performed. Per-forming cross validation on small data sets only once leads to performance fluctuations between different iterations. To work around this problem, cross validation was performed multiple times and then the mean of all performance met-rics was calculated.
5.
Results
Figure 2 displays boxplots of perplexity values by diagnos-tic groups. Each column corresponds to either uni-, bi- or trigram models. Rows indicate the training scenario. In general the perplexity decreases with disease progression -from HC, to MCI, to ADRD.
People with ADRD have significantly smaller perplexity values compared to the HC population, regardless of the context history length considered and training material. The same is true for people with ADRD in comparison to the MCI population. A significant difference between the HC and the MCI population for unigrams is only visible in the ’Impaired’ model, (3). Bigram models all show signif-icant differences between both populations. Trigrams only show this effect for models trained on the whole popula-tion or the impaired part. Overall, trigrams show less dif-ferences between populations and high perplexity values,
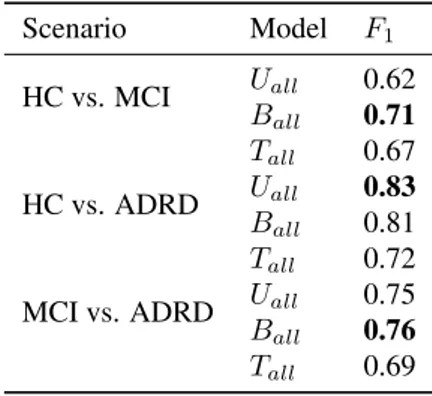
Scenario Model F1 HC vs. MCI Uall 0.62 Ball 0.71 Tall 0.67 HC vs. ADRD Uall 0.83 Ball 0.81 Tall 0.72
MCI vs. ADRD Uall 0.75 Ball 0.76
Tall 0.69
Table 2: Classification results for different scenarios and models as F1scores. Uall= Unigram model trained on all
samples; Ball= Bigram model trained on all samples; Tall
= Trigram model trained on all samples.
which can be attributed to the extreme sparseness of these models given our small data set.
Table 2 shows classification results for different models and scenarios. Following inspection of Figure 2, only mod-els trained on all samples in the population were used in classification experiments, as the inter-group effects seem consistent between different training material. Between the HC and the ADRD group, as well as the MCI and ADRD populations, the unigram and bigram model show compara-ble performance. For classification of the HC and the MCI population the bigram model clearly shows the best perfor-mance.
6.
Discussion and Conclusion
A general result of this study is that people with MCI or dementia show significantly lower perplexity values in SVF compared to a healthy population, meaning the n-gram LMs, regardless of training corpus, are more suited to model a demented person’s speech versus that of a healthy person. Thus people with dementia are more predictable in their production of words in the SVF task.
This differs from findings about perplexity of demented pa-tients in free speech tasks, where perplexity values of de-mented speech have been shown to be higher than that of healthy controls (Wankerl et al., 2017). This can be ex-plained by the different scenarios where language mod-elling is applied: on natural language, a LM and its result-ing perplexity can be interpreted as a measure for syntac-tic normality/correctness. When training on and predicting SVF performances, in which production of word sequences is motivated semantically, the perplexity can be viewed as a measure for effective semantic retrieval strategy.
Furthermore, we found word production in SVF differed in advancing stages of dementia syndromes. Unigram per-plexity approximated on the SVF task, can be seen as a measure of predictability of word choice. Perplexity values of unigram models were found to be good indicators to sep-arate the ADRD group from the HC group, but not the MCI population from the HC. Thus, word choice in SVF is more predictable in late stage dementia and not in early stage. Perplexity of bigram models trained on SVF productions— and for that matter any ngram where n ≥ 2—can be seen as a measure for predictability of production strategy in the
task. Both ADRD and MCI groups show significant dif-ferences in perplexity of bigram models to the HC group. Consequently, both populations show more predictable pro-duction strategies.
When modelling with trigrams, we would expect to see ef-fects of context length—such as people with dementia us-ing less contextual information. Unfortunately, this study is limited in the conclusions that can be drawn about the tri-gram models as it lack sufficient amounts of SVF data and therefore those models are severly undertrained.
In future experiments, we would like to gather more data to generate well-trained trigram models and possibly draw a more definitive conclusion on the effects of context length in SVF. We would also like to try different smoothing tech-niques, possibly interpolated methods such as Witten-Bell, that are not as coarse as the Lidstone technique.
Based on the trends shown in the unigram and bigram mod-els, demented patients show significantly lower perplexity values, regardless of training data, and are therefore more predictable. Furthermore, persons in advanced stages of de-mentia differ in predictability of word choice — as shown by the unigram models — and production strategy — as shown by the bigram models — where as people with mild cognitive impairment only show significant predictability in their production strategy.
Perplexities from both the unigram and bigram models also function as adequate diagnositic features in classification tasks where the unigram model differentiates the best be-tween HC and ADRD and the bigram model differentiates best between the more fine-grained distinctions of MCI ver-sus the healthy controls or more severly demented patients.
7.
Acknowledgements
This work was partially funded by the EIT Digital Well-being Activity 17074, ELEMENT. The data was collected during the EU FP7 Dem@Care project, grant agreement 288199.
8.
Bibliographical References
Auriacombe, S., Lechevallier, N., Amieva, H., Harston, S., Raoux, N., and Dartigues, J.-F. (2006). A Longitudinal Study of Quantitative and Qualitative Features of Cat-egory Verbal Fluency in Incident Alzheimer’s Disease Subjects: Results from the PAQUID Study. Dementia and geriatric cognitive disorders, 21(4):260–266. Bonner, M. F., Ash, S., and Grossman, M. (2010). The
New Classification of Primary Progressive Aphasia into Semantic, Logopenic, or Nonfluent/Agrammatic Vari-ants. Current Neurology and Neuroscience Reports, 10(6):484–490.
Clark, D. G., McLaughlin, P. M., Woo, E., Hwang, K., Hurtz, S., Ramirez, L., Eastman, J., Dukes, R. M., Ka-pur, P., DeRamus, T. P., and Apostolova, L. G. (2016). Novel verbal fluency scores and structural brain imag-ing for prediction of cognitive outcome in mild cognitive impairment. Alzheimers Dement (Amst), 2:113–122. Cortes, C. and Vapnik, V. (1995). Support-vector
net-works. Machine Learning, 20(3):273–297.
Folstein, M. F., Folstein, S. E., and McHugh, P. R. (1975). ”Mini-Mental State”. A Practical Method for Grading the
Cognitive State of Patients for the Clinician. J Psychiatr Res, 12(3):189–198.
Gomez, R. G. and White, D. A. (2006). Using verbal flu-ency to detect very mild dementia of the Alzheimer type. Archives of Clinical Neuropsychology, 21(8):771 – 775. Gruenewald, P. J. and Lockhead, G. R. (1980). The Free
Recall of Category Examples. Journal of Experimental Psychology: Human Learning and Memory, 6:225–240. Henry, J. D. and Crawford, J. R. (2004). Verbal flu-ency deficits in parkinson’s disease: A meta-analysis. Journal of the International Neuropsychological Society, 10(4):608–622.
Henry, J. D., Crawford, J. R., and Phillips, L. H. (2004). Verbal fluency performance in dementia of the alzheimer’s type: a meta-analysis. Neuropsychologia, 42(9):1212–1222.
Henry, J. D., Crawford, J. R., and Phillips, L. H. (2005). A meta-analytic review of verbal fluency deficits in hunt-ington’s disease. Neuropsychology, 19(2):243–252. Hsu, C.-W., Chang, C.-C., and jen Lin, C. (2010). A
Prac-tical Guide to Support Vector Classification.
Karakostas, A., Briassouli, A., Avgerinakis, K., Kompat-siaris, I., and Tsolaki, M. (2014). The Dem@Care Ex-periments and Datasets: a Technical Report. Techni-cal report, Centre for Research and Technology Hellas (CERTH).
Lidstone, G. J. (1920). Note on the general case of the bayes-laplace formula for inductive or a posteriori proba-bilities. Transactions of the Faculty of Actuaries, 8:182– 192.
Linz, N., Tr¨oger, J., Alexandersson, J., and K¨onig, A. (2017a). Using Neural Word Embeddings in the Analy-sis of the Clinical Semantic Verbal Fluency Task. In Pro-ceedings of the 12th International Conference on Com-putational Semantics (IWCS).
Linz, N., Tr¨oger, J., Alexandersson, J., Wolters, M., K¨onig, A., and Robert, P. (2017b). Predicting Dementia Screen-ing and StagScreen-ing Scores From Semantic Verbal Fluency Performance. In IEEE International Conference on Data Mining (ICDM)-Workshop on Data Mining for Aging, Rehabilitation and Independent Assisted Living, pages 719–728.
MacWhinney, B. (1991). The CHILDES project: Tools for analyzing talk. Lawrence Erlbaum Associates, Inc. Marczinski, C. A. and Kertesz, A. (2006). Category and
letter fluency in semantic dementia, primary progressive aphasia, and alzheimer’s disease. Brain and Language, 97(3):258 – 265.
McKhann, G. M., Knopman, D. S., Chertkow, H., Hyman, B. T., Jack, C. R., Kawas, C. H., Klunk, W. E., Ko-roshetz, W. J., Manly, J. J., Mayeux, R., et al. (2011). The diagnosis of dementia due to Alzheimer’??s dis-ease: Recommendations from the National Institute on Aging-Alzheimer’s Association workgroups on diagnos-tic guidelines for Alzheimer’s disease. Alzheimer’s & dementia, 7(3):263–269.
Morris, J. C. (1997). Clinical Dementia Rating: A Reliable and Valid Diagnostic and Staging Measure for Dementia
of the Alzheimer Type. International Psychogeriatrics, 9(S1):173–176.
Pakhomov, S. V., Smith, G. E., Marino, S., Birnbaum, A., Graff-Radford, N., Caselli, R., Boeve, B., and Knopman, D. S. (2010). A computerized technique to assess lan-guage use patterns in patients with frontotemporal de-mentia. Journal of Neurolinguistics, 23(2):127–144. Pakhomov, S. V., Eberly, L., and Knopman, D. (2016).
Characterizing Cognitive Performance in a Large Lon-gitudinal study of Aging with Computerized Semantic Indices of Verbal Fluency. Neuropsychologia, 89:42–56. Pedregosa, F., Varoquaux, G., Gramfort, A., Michel, V., Thirion, B., Grisel, O., Blondel, M., Prettenhofer, P., Weiss, R., Dubourg, V., Vanderplas, J., Passos, A., Cour-napeau, D., Brucher, M., Perrot, M., and Duchesnay, E. (2011). Scikit-learn: Machine Learning in Python. Jour-nal of Machine Learning Research, 12:2825–2830. Petersen, R. C., Smith, G. E., Waring, S. C., Ivnik, R. J.,
Tangalos, E. G., and Kokmen, E. (1999). Mild Cog-nitive Impairment: Clinical Characterization and Out-come. Arch. Neurol., 56(3):303–308.
Raoux, N., Amieva, H., Goff, M. L., Auriacombe, S., Car-caillon, L., Letenneur, L., and Dartigues, J.-F. (2008). Clustering and switching processes in semantic verbal fluency in the course of Alzheimer’s disease subjects: Results from the PAQUID longitudinal study. Cortex, 44(9):1188–1196.
Robert, P. H., Lafont, V., Medecin, I., Berthet, L., Thauby, S., Baudu, C., and Darcourt, G. (1998). Clustering and switching strategies in verbal fluency tasks: Comparison between schizophrenics and healthy adults. Journal of the International Neuropsychological Society, 4(6):539– 546.
Tr¨oger, J., Linz, N., Alexandersson, J., K¨onig, A., and Robert, P. (2017). Automated Speech-based Screening for Alzheimer’s Disease in a Care Service Scenario. In Proceedings of the 11th EAI International Conference on Pervasive Computing Technologies for Healthcare. Troyer, A. K., Moscovitch, M., and Winocur, G. (1997).
Clustering and Switching as Two Components of Ver-bal Fluency: Evidence From Younger and Older Healthy Adults. Neuropsychology, 11(1):138–146.
Troyer, A. K., Moscovitch, M., Winocur, G., Alexander, M. P., and Stuss, D. (1998). Clustering and switching on verbal fluency: the effects of focal frontal- and temporal-lobe lesions. Neuropsychologia, 36(6):499 – 504. Wankerl, S., N¨oth, E., and Evart, S. (2017). An
N-Gram Based Approach to the Automatic Diagnosis of Alzheimer’s Disease from Spoken Language. In Pro-ceedings of the Annual Conference of the International Speech Communication Association, INTERSPEECH. in press.
Weiner, J., Engelbart, M., and Schultz, T. (2017). Man-ual and Automatic Transcriptions in Dementia Detection from Speech. In Proceedings of the Annual Conference of the International Speech Communication Association, INTERSPEECH, pages 3117–3121.
Woods, D. L., Wyma, J. M., Herron, T. J., and Yund, E. W. (2016). Computerized Analysis of Verbal Fluency:
Nor-mative Data and the Effects of Repeated Testing, Sim-ulated Malingering, and Traumatic Brain Injury. PLOS ONE, 11(12):1–37.
World Health Organization. (1992). The ICD-10 classifi-cation of mental and behavioural disorders: clinical de-scriptions and diagnostic guidelines. World Health Or-ganization.