HAL Id: hal-01384383
https://hal.archives-ouvertes.fr/hal-01384383
Submitted on 19 Oct 2016
HAL is a multi-disciplinary open access
archive for the deposit and dissemination of
sci-entific research documents, whether they are
pub-lished or not. The documents may come from
teaching and research institutions in France or
abroad, or from public or private research centers.
L’archive ouverte pluridisciplinaire HAL, est
destinée au dépôt et à la diffusion de documents
scientifiques de niveau recherche, publiés ou non,
émanant des établissements d’enseignement et de
recherche français ou étrangers, des laboratoires
publics ou privés.
Noninvasive Recurrence Quantification Analysis
Predicts Atrial Fibrillation Recurrence in Persistent
Patients Undergoing Electrical Cardioversion
Olivier Meste, Stef Zeemering, Joël Karel, Theo Lankveld, Ulrich Schotten,
Harry Crijns, Ralf Peeters, Pietro Bonizzi
To cite this version:
Olivier Meste, Stef Zeemering, Joël Karel, Theo Lankveld, Ulrich Schotten, et al.. Noninvasive
Recur-rence Quantification Analysis Predicts Atrial Fibrillation RecurRecur-rence in Persistent Patients Undergoing
Electrical Cardioversion. Computing in Cardiology, Sep 2016, Vancouver, Canada. �hal-01384383�
Noninvasive Recurrence Quantification Analysis Predicts Atrial Fibrillation
Recurrence in Persistent Patients Undergoing Electrical Cardioversion
Olivier Meste
1, Stef Zeemering
2Jo¨el Karel
4, Theo Lankveld
2,3, Ulrich Schotten
2, Harry Crijns
3,
Ralf Peeters
4, Pietro Bonizzi
41
Universit´e Cˆote d’Azur, CNRS, I3S, France
2
Department of Physiology, Maastricht University Medical Center, Maastricht, The Netherlands
3
Department of Cardiology, Maastricht University Medical Center, Maastricht, The Netherlands
4
Department of Data Science and Knowledge Engineering, Maastricht University, Maastricht,
The Netherlands
Abstract
This study proposes a novel noninvasive ECG-based ap-proach to accurately quantify differences in the atrial ac-tivity (AA) signals of atrial fibrillation (AF) patients char-acterized by very similar global AF organization.
High-density body surface potential maps were recorded in 63 patients in persistent AF prior to electrical car-dioversion (32 recurrences occurred after 4-6 weeks). AF substrate complexity was quantified as the degree of over-all temporal organization of the AA pattern, determined from multi-variable unthresholded recurrence plots (RP).
Results showed that non-recurrent patients were char-acterized by temporally more stable propagation patterns than recurrent patients, suggesting a lower complexity of the AF substrate in the former. This was used to discrimi-nate between recurrent and non-recurrent AF patients fol-lowing electrical cardioversion with an accuracy of 72%.
Noninvasive assessment of AF substrate complexity in patients characterized by very similar levels of AF pro-gression was improved by applying RP-based analysis on extracted AA signals. The proposed approach may help improving AF treatment selection and success.
1.
Introduction
ECG-based noninvasive quantification of atrial fibrilla-tion (AF) substrate complexity is increasingly being used to discriminate among AF types and to predict therapy out-come at any stage of the disease [1]. In particular, pre-dicting acute and long-term success of AF treatments may improve treatment selection and success, and prevent fu-ture cardiovascular complications. Many ECG-based AF complexity parameters have been suggested over the last decade and some first steps towards a standardized ap-proach have been taken [2]. A limitation of those
parame-ters is that they generally quantify stationary AF substrate properties and appear to be suboptimal in describing sub-tle differences in patients characterized by very similar AF substrate complexity. However, patients showing similar AF substrate complexity still may respond differently (on a short and long term) to the same treatment. This asks for more accurate ECG-based noninvasive methods able to un-veil differences in the global AF organization of those pa-tients, which are more subtle and more difficult to quantify [3], and likely due to structural strengthening of already existing remodelling processes.
In this study, we introduce a novel approach based on unthresholded recurrence plots (RP) to describe the oscil-latory patterns of atrial activity (AA) signals during AF and well represent the continuous spectrum of AF progression. The proposed approach is also applied to noninvasively predict AF recurrence in persistent AF patients undergo-ing electrical cardioversion.
2.
Methods
2.1.
BSPM data and pre-processing
Body surface potential maps (BSPMs) were recorded in 63 patients in persistent AF using a custom configuration of 184 leads with 120 anterior and 64 posterior leads (Ac-tiveTwo BSM Panels Carbon Electrodes, Biosemi B.V., The Netherlands; Figure 1). All patients underwent elec-trical cardioversion, and 32 patients showed AF recurrence 4 to 6 weeks after procedure. ECGs were sampled at 2048Hz, and downsampled at 256Hz. A one-minute seg-ment was selected for each subject, low-quality leads were excluded (low signal-to-noise ratio, poor electrode con-tact, motion artefacts), and Wilson’s Central Terminal was subtracted in line with conventional ECG analysis. After band-pass filtering the signals between 1 and 100Hz (3rd
Figure 1. BSPM electrode configuration, comprising 120 anterior leads and 64 posterior leads. Thick circles: default
positions of the precordial leads V1, . . . , V6.
order Chebyshev), QRST cancellation was performed us-ing an adaptive sus-ingular value decomposition method, in-spired by the approach in [4], with multiple QRST win-dow templates defined using hierarchical clustering. The extracted atrial signals were post-filtered with a zerophase notch filter at 50Hz to suppress power line noise, and with a 3Hz zero-phase highpass filter (3rd order Chebyshev) to remove low-frequency residuals not related to (persistent) AF. Figure 3(a) shows the r(p) signals for all 63 patients.
2.2.
Multi-variable recurrence plot
con-struction
RPs provide a way to visualize and quantify recurrent behavior of the phase space trajectory of a dynamical sys-tem [5]. RPs can be generated from trajectory data. In this study, given the matrix X of size ` ⇥ N collecting all ex-tracted AA signals from a patient (` = 184 leads, and N is the number of samples), each column of X was assumed to provide a vector x(i), i = 1, . . . , N, which represents a point in the phase space of the system. This allows to process all AA signals extracted from a patient simultane-ously, by means of a multi-variable RP.
Traditionally, the Euclidean distance is used to compute the proximity of two points in the phase space. How-ever, we replaced this distance with a similarity measure, namely the cosine of the angle between the vectors associ-ated with two points in the phase space:
d(x(i), x(j)) = x(i)
Tx(j)
||x(i)||2||x(j)||2 (1)
This provides a sort of sample correlation which is not af-fected by the magnitude of the vectors, and allows to inves-tigate the temporal recurrence of global AF spatial patterns over the all body surface covered by the BSPM electrodes. Recurrence is then expected to happen not when the
dis-200 400 600 8001000 1200 14001600 1800 2000 200 400 600 800 1000 1200 1400 1 2 3 0 50100150200250300350400450500 0.6 0.4 0.2 0 0.2 0.4 0.6 0.8 1 1.2 1.4 0 50100150200250300350400450500 0.6 0.4 0.2 0 0.2 0.4 0.6 0.8 1 1.2 0 50100150200250300350400450500 0.8 0.6 0.4 0.2 0 0.2 0.4 0.6 0.8 1 1.2 0 50 100 150 200 250 300 350 400 450 500 0 0.2 0.4 0.6 0.8 1 1.2 1.4
}
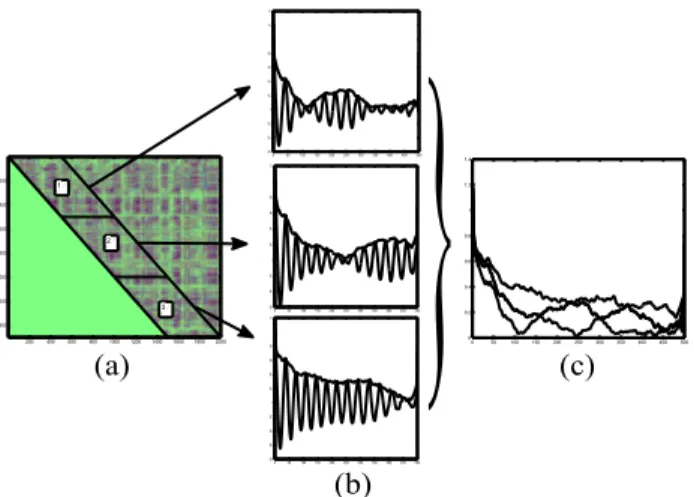
(a) (c) (b)Figure 2. The main phases of the proposed approach. Read Section 2.3 for details.
tance is zero, but when similarity is high. Finally, by com-puting the similarity (1) between each pair x(i), x(j), an unthresholded RP matrix of size N ⇥ N was obtained for each patient, which was used for further analyses.
2.3.
Recurrence Quantification Analysis of
multi-variable AA RPs
RQA uses RPs to investigate and quantify the recurrent behavior in the phase space trajectory of a dynamical sys-tem. Under the hypothesis that an AA signal during AF is characterized by a certain stationarity, the correspond-ing AA cardiac dipole can be assumed to pass through the same points (or close to) after a period T . At such mo-ments in time the distance d(x(i), x(i + T )) (with T ex-pressed in samples) defined in (1) is expected to be 1 (or close to 1). With this assumption of stationarity fulfilled, averaging over a diagonal of the RP would provide a nor-malized autocorrelation value at a lag given by the index of the diagonal (for instance, averaging over the main di-agonal would provide a normalized autocorrelation at lag zero).
However, it is also sensible to assume that this stationar-ity is likely not to last over a long time interval, and to ex-pect breaks in the phase of the AF patterns to occur (piece-wise stationarity). The number of those breaks is expected to depend on how much progressed AF is, and on the over-all status of a patient. The more progressed AF becomes the larger the number of breaks in the phase, and the more nonstationary the AF patterns are expected to be. There is no analytical way to compute the average length of a piece-wise stationary window in a patients (the time interval be-tween two break points in the phase of the AF patterns). The length of this window then becomes a parameter of the method. There is a tradeoff on the window length: the shorter the window is the better nonstationarities can be
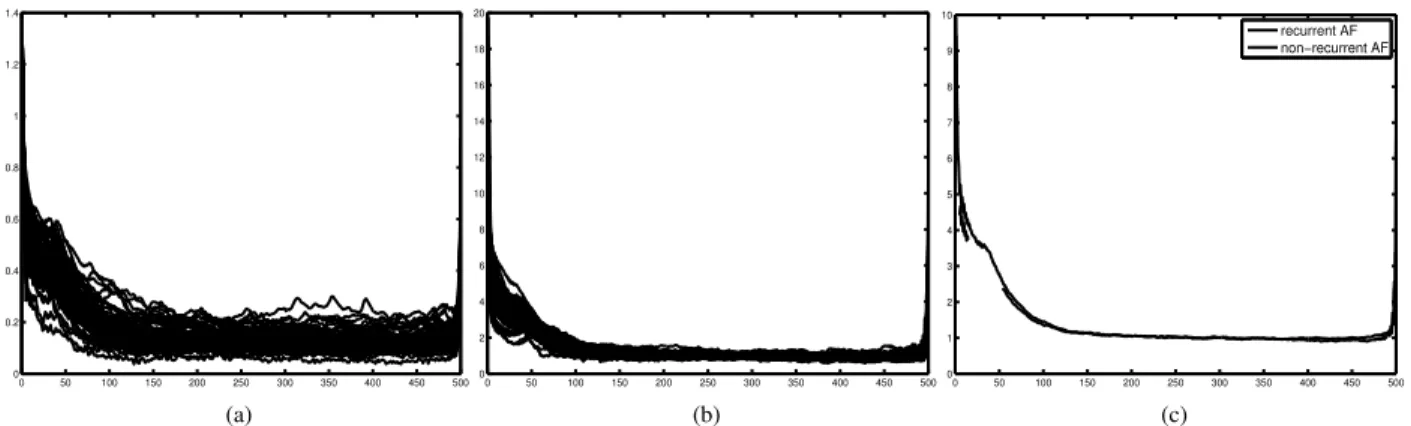
0 50 100 150 200 250 300 350 400 450 500 0 0.2 0.4 0.6 0.8 1 1.2 1.4 (a) 0 50 100 150 200 250 300 350 400 450 500 0 2 4 6 8 10 12 14 16 18 20 (b) 0 50 100 150 200 250 300 350 400 450 500 0 1 2 3 4 5 6 7 8 9 10 recurrent AF non−recurrent AF (c)
Figure 3. The three steps of the analysis of AF nonstationary behavior. 3(a), raw median r(p) signals from all 63 patients. 3(b), the normalized r(p) signals. 3(c), the mean signals for the non-recurrent and recurrent AF groups.
handled, but the larger the variance of the estimated nor-malized autocorrelations over different windows. On the contrary, the larger the window is the more accurate the estimates of the normalized autocorrelations are, but the less it can adapt to nonstationary behaviors. In this study, we empirically determined that a window length of 500 samples worked well in terms of discriminating between the recurrent and non-recurrent AF patients.
After the window length was chosen, each RP was split into a sequence of non-overlapping diagonal blocks, all of the same size, each block containing 500 diagonals of equal length (see an example in Figure 2(a) for three se-quential blocks). That means that by averaging over all diagonals of one block, all lags between 0 and 499 sam-ples were assessed. In this way, we could determine a new autocorrelation function for every block, and adapt to non-stationarities. A normalized autocorrelation function was then obtained for each block (see Figure 2(b)). For a win-dow length of 500 samples, twenty-four blocks were ob-tained from the RP of each patient, thus providing twenty-four normalized autocorrelation functions per patient.
The envelope of each autocorrelation function was then computed as the amplitude of its Hilbert transform (thick solid lines in Figure 2(b)). This allows to work with smoother signals, not affected by discontinuities in the phase. Finally, for a given patient the median of all the twenty-four envelopes at each time lag was computed, pro-viding a 500 sample long signal, r(p), with lags in the range p = 0, . . . , 499 samples (Figure 2(c), thick line over-lapped to the three envelopes). This signal includes infor-mation about the recurrent behavior present in the original data, at the same time accounting for nonstationary prop-erties of this behavior. Two analyses were then carried out based on the signal r(p).
3.
Analyses and Results
3.1.
Qualitative analysis of AF
nonstation-ary behavior
Figure 3(a) shows the r(p) signals for all 63 patients. A visual inspection of those curves shows that they are characterized in general by two distinct behaviors: an early phase characterized by a decreasing autocorrelation value (for low values of the time lag p), and a later phase charac-terized by an approximately constant behavior, with very low autocorrelation values (for larger values of the lag p). To highlight this common behavior and partly remove intra-individual differences, each r(p) signal was normal-ized by the corresponding median value of the constant phase (calculated as the median of r(p) in the interval
150 p 450; Figure 3(b)). Finally, given the two
groups composed by recurrent and non-recurrent AF pa-tients, respectively, the mean of all r(p) signals was com-puted for each group (over each time lag; Figure 3(c)). A visual inspection of the two resulting curves shows that both groups are characterized by the two distinct behav-iors highlighted above. Moreover, it can be noticed that the mean curve of the non-recurrent group shows values that are larger than those of the recurrent curve at the early phase (10 p 60). That means that in this early phase, the non-recurrent patients show in average a larger auto-correlation, which can be interpreted as a higher regular-ity of the corresponding global AF patterns, which tend to pass for longer from the same locations. This is in line with the expectation that electrical cardioversion is more likely to be successful in those patients with less electro-structural remodeling of the myocardium, reflected in a lower complexity of the AF substrate and more organized AA patterns.
3.2.
RP-based classification of recurrent
and non-recurrent AF patients
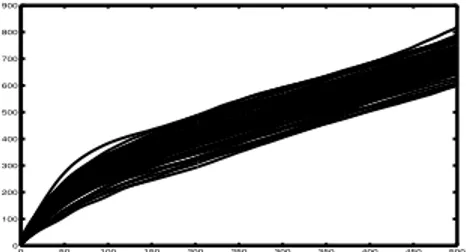
Based on the previous qualitative analysis, an open question is: what is the value of the time lag p which al-lows to separate the recurrent and non-recurrent patients best? To answer this question we first computed the cu-mulative function of each normalized signal r(p) (Figure 4). This allows, given a specific time lag, to take into ac-count the contribution of the previous lags as well. We then performed a leave-one-out cross validation on each time lag to determine the most discriminant lag. We found that 200 samples was the value of the time lag which gave the highest accuracy in terms of classification of recurrent and non-recurrent AF patients (72%; AUC 0.58). When looking back at Figure 3(c), it can be noticed that p = 200 is indeed at the end of the early decreasing phase, before the curves become constant, underlining that all discrimi-nant power is exploited by this value.
0 50 100 150 200 250 300 350 400 450 500 0 100 200 300 400 500 600 700 800 900
Figure 4. Cumulative functions of the normalized r(p) signals in Figure 3(b).
3.3.
AF complexity assessment
For completeness, AF complexity was also assessed on the extracted AA signals by means of fourteen state of the art noninvasive time and frequency domain parameters that appeared frequently in the last decade of non-invasive AF complexity literature [2]. A generalized linear model was individually applied to each complexity parameter. None of those parameters showed to be a significant discriminant of AF recurrence.
4.
Conclusions
This study proposed a novel RP-based noninvasive quantification of AF substrate complexity. Novelty resides in the use of a normalized autocorrelation instead of the Euclidian distance to build RPs and in extracting from the RP matrix a signal that contains information about recur-rences in the original data, accounting for possible non-stationaries of those recurrences. In particular, the pro-posed approach showed to be able to unveil more subtle information about AA patterns in persistent AF patients,
which could be used to discriminate between recurrent and non-recurrent AF patients following electrical cardiover-sion with an accuracy of 72%. Non-recurrent patients were characterized by temporally more stable propagation pat-terns than recurrent patients, suggesting more organized AA patterns and a lower complexity of the AF substrate in the former, in line with what could be expected from a pathophysiogical view-point. On the contrary, state of the art noninvasive parameters for the assessment of the complexity of the AF substrate did not show to be able to discriminate between recurrent and non-recurrent AF pa-tients, suggesting that more sophisticated tools are needed to describe patients characterized by very similar levels of AF organization. Main findings of this study include that: persistent AF is a complex nonstationary process, charac-terized by different nonstationary behaviors on the short and long term; following electrical cardioversion of per-sistent AF, non-recurrent and recurrent patients show dif-ferent nonstationary behaviors, and non-recurrent patients are characterized by more organized AA propagation pat-terns; differences in the nonstationary behaviors of those two groups can be described by the proposed approach and used to obtain a good classification. Finally, the method proposed in this study provides a more accurate description of the AA oscillatory patterns hidden in AF ECG record-ings and helps predicting AF recurrence in persistent pa-tients undergoing electrical cardioversion.
References
[1] Lankveld TAR, Zeemering S, Crijns HJGM, Schotten U. The ECG as a tool to determine atrial fibrillation complexity. Heart 2014;100:1077–84.
[2] Bonizzi P, Zeemering S, Karel JM, Di Marco LY, Uldry L, Van Zaen J, Vesin JM, Schotten U. Systematic comparison of non-invasive measures for the assessment of atrial fibril-lation complexity: a step forward towards standardization of atrial fibrillation electrogram analysis. Europace 2015 Feb; 17(2):318–25.
[3] Uldry L, Van Zaen J, Prudat Y, Kappenberger L, Vesin JM. Measures of spatiotemporal organization differentiate persis-tent from long-standing atrial fibrillation. Europace 2012;14 (8):1125–1131.
[4] Alcaraz R, Rieta JJ. Adaptive singular value cancellation of ventricular activity in single-lead atrial fibrillation electrocar-diograms. Physiol Meas 2008;29:1351–1369.
[5] Eckmann JP, Oliffson Kamphorst S, Ruelle D. Recurrence Plots of Dynamical Systems. Europhys Lett 1987;4 (9):973– 977.
Address for correspondence: Pietro Bonizzi
P.O. Box 616, 6200 MD, Maastricht, The Netherlands [email protected]