HAL Id: cea-02500818
https://hal-cea.archives-ouvertes.fr/cea-02500818
Submitted on 6 Mar 2020
HAL is a multi-disciplinary open access
archive for the deposit and dissemination of
sci-entific research documents, whether they are
pub-lished or not. The documents may come from
teaching and research institutions in France or
abroad, or from public or private research centers.
L’archive ouverte pluridisciplinaire HAL, est
destinée au dépôt et à la diffusion de documents
scientifiques de niveau recherche, publiés ou non,
émanant des établissements d’enseignement et de
recherche français ou étrangers, des laboratoires
publics ou privés.
First In-Core Simultaneous Measurements of Nuclear
Heating and Thermal Neutron Flux obtained with the
Innovative Mobile Calorimeter CALMOS inside the
OSIRIS Reactor
H. Carcreff, L. Salmon, J. Bubendorff, V. Lepeltier
To cite this version:
H. Carcreff, L. Salmon, J. Bubendorff, V. Lepeltier. First In-Core Simultaneous Measurements of
Nuclear Heating and Thermal Neutron Flux obtained with the Innovative Mobile Calorimeter
CAL-MOS inside the OSIRIS Reactor. IEEE Transactions on Nuclear Science, Institute of Electrical and
Electronics Engineers, 2015, 63 (5), pp.2662 - 2670. �10.1109/TNS.2016.2574564�. �cea-02500818�
Abstract— Nuclear heating inside a MTR reactor has to be known in order to design and to run irradiation experiments which have to fulfill target temperature constraints. This measurement is usually carried out by calorimetry. The innovative calorimetric system, CALMOS, has been studied and built in 2011 for the 70MWth OSIRIS reactor operated by CEA. Thanks to a new type of calorimetric probe, associated to a specific displacement system, it provides measurements along the fissile height and above the core. This development required preliminary modelling and irradiation of mock-ups of the calorimetric probe in the ex-core area, where nuclear heating rate does not exceed 2 W.g-1. The calorimeter working modes, the different measurement procedures allowed with such a new probe, the main modeling and experimental results and expected advantages of this new technique have been already presented [1, 2]. However, these first in-core measurements were not performed beyond 6 W.g-1, due to an inside temperature limitation imposed by a safety authority requirement.
In this paper, we present the first in-core simultaneous measurements of nuclear heating and conventional thermal neutron flux obtained by the CALMOS device at the 70 MW nominal reactor power. For the first time, this experimental system was operated in nominal in-core conditions, with nominal neutron flux up to 2.7 1014 n.cm-2.s-1 and nuclear heating up to 12W.g-1. A comprehensive measurement campaign carried out from 2013 to 2015 inside all accessible irradiation locations of the core, allowed to qualify definitively this new device, not only in terms of measurement ability but also in terms of reliability.
After a brief reminder of the calorimetric cell configuration and displacement system specificities, first nuclear heating distributions at nominal power are presented and discussed. In order to reinforce the heating evaluation, a systematic
Manuscript received April 6, 2015.
Hubert Carcreff is with the Nuclear studies and reactor irradiation Service, CEA Saclay 91191 Gif sur Yvette France (telephone: +33 (0) 1 69 08 47 78, e-mail: hubert.carcreff@cea.fr.
Laurent Salmon is with the Thermalhydraulics and Fluid Mechanics Section, CEA Saclay 91191 Gif sur Yvette France (telephone: +33 (0) 1 69 08 97 79, e-mail: laurent@salmon.cea.fr.
Jacques Bubendorff is with the Nuclear studies and reactor irradiation Service, CEA Saclay 91191 Gif sur Yvette France (telephone: +33 (0) 1 69 08 67 05, e-mail: jacques.bubendorff@cea.fr.
Valérie Lepeltier is with the Nuclear studies and reactor irradiation Service, CEA Saclay 91191 Gif sur Yvette France (telephone: +33 (0) 1 69 08 69 71, e-mail: valérie.lepeltier@cea.fr.
comparison is made between results obtained by different methods, the probe calibration coefficient and the zero method. Thermal neutron flux evaluation from the SPND signal processing required a specific TRIPOLI-4 Monte Carlo calculation which has been performed with the precise CALMOS cell geometry. In addition, the Finite Element model for temperatures map prediction inside the calorimetric cell has been upgraded with the recent experimental data obtained up to 12 W.g-1. The Kc coefficient, taking into account nonlinearities with regard to the calibration, has been reevaluated so as to make relevant measurements up to the nominal reactor power. Finally, the experience feedback acquired until now with this first CALMOS version led us to improvement perspectives. A second device is currently under manufacturing and main technical options chosen for this second version are presented.
Index Terms — Nuclear heating, calorimetry, in-core measurements, OSIRIS reactor
I. INTRODUCTION
Nuclear heating inside a MTR has to be known in order to predict the sample temperatures reached during an irradiation experiment and check that it fulfills experimental requirements but also for safety reasons, to demonstrate that temperatures will not exceed material limits. Determination is usually done by calorimetry. Homemade calorimeters [1, 2], working in permanent mode, have been used for many years for the qualification of irradiation locations in the pool type MTR OSIRIS reactor.
Previous devices for OSIRIS in-core measurements are made of five stage calorimeters (each one made of four cells), piled-up along the core height. It provides only five measurement points to fit the heating profile. These calorimeters were reliable but they had inherent drawbacks, coming essentially from the static nature of this technology. Presentation of these current calorimeters, their working modes and their transposition from fixed measuring systems to a mobile device has been already presented in details [3, 4].
The innovative calorimetric system, CALMOS, has been studied and built at the Saclay research center and the whole system was completed in 2011. This development, dedicated to in-core measurements, started in 2002. The main goal of this R&D program was to transpose the current in-core static measurement system to a mobile one, which allows plotting the nuclear heating distribution as finely as required. The
First In-Core Simultaneous Measurements of
Nuclear Heating and Thermal Neutron Flux obtained
with the Innovative Mobile Calorimeter CALMOS
inside the OSIRIS Reactor
objective was also to design a device able to measure heating rates extended to the upper part of the core, where heating level still remains high. The first step was to develop a calorimetric probe suited to a mobile equipment. The second step was to design a displacement system dedicated to move the calorimetric cell inside the core while fulfilling safety constraints associated to an in-core experiment. Results obtained during the cell development, modelling an irradiation of mock-ups, and finally the results obtained with the complete system up to a 6 W.g-1 heating level have been already detailed and presented [5].
Purpose of this complementary paper is to present the whole results obtained during a comprehensive measurement campaign, carried out at the 70MWth nominal power in all accessible locations of the OSIRIS core, in order to qualify this equipment for measuring nuclear heating and thermal neutron flux up to nominal levels, respectively 12 W.g-1
and
2.7 1014 n.cm-2.s-1.
II. REMINDER OF THE CALORIMETRIC CELL DESIGN
Fig.1. CALMOS diagram with components location.
The key point of this new device is to stack up two cells (one empty and one filled with the graphite sample) coaxially inside the same external sleeve (Fig. 1) and then to move the whole probe with the help of a displacement system.
It is thus possible to measure heating rate data at any level in the core and therefore to determine more accurately the heating profile inside and above the core (which was not possible with the previous static calorimeters). Note that the heating rate unit (W.g-1) is written W.g-1(C) to emphasize that it is relative to Graphite. We remind briefly hereafter expected advantages in comparison with static system [4, 5]:
• To get a continuous axial heating rate distribution,
• To extend measurements above the core,
• To reduce the irradiation ageing of the cells,
• To obtain better point wise measurements,
• To minimize the radial gradient effect in probe vicinity. The upper cell (sample cell) contains a graphite sample, whereas the lower one is empty (reference cell). Each one is surrounded by a gas gap (nitrogen) and set on a base surrounded by a stainless external tube in contact with the reactor water flow. A thermocouple (K type) is embedded in the top of each pedestal (hot temperature) whereas a second one is located on the external surface of the aluminum base (cold temperature). Two heating elements made of a constantan wire embedded in alumina are inserted inside the cells, thus allowing the calibration. The calorimeter works in permanent mode, so the energy deposit in the cells is flowing through the pedestal and then through the external sleeve. The temperature difference “∆T sample” is proportional to the energy deposit both in graphite and the cell structure, whereas “∆T reference” is proportional to the deposit in the empty cell structure. Therefore, in first approximation the quantity (∆∆T) “∆T sample - ∆T reference” is proportional to the energy deposit inside the only graphite sample. In addition, a specific rhodium SPND is located inside the upper base (short emitter) to measure simultaneously the thermal neutron flux. This new nuclear heating measurement method has been patented [6]. The total length of the probe is 222mm whereas its overall diameter is 18mm. Details about the whole design and manufacturing have been already presented [3, 4].
III. REMINDER OF THE PROBE CALIBRATION AND MEASUREMENT PROCEDURES
Probe calibration
Prior to any measurement, a calibration is performed under non irradiating conditions and natural convection cooling. The slope of each cell in °C.W-1 is measured. The procedure requires to inject electric currents inside each cell heater element (no beyond 5W), and to measure pedestal and base temperatures after stabilization. Considering that the calorimeter has a perfect linear response, we can define a K calibration coefficient in W.g1.°C-1 [4, 5]. If sample and reference cells are in a same irradiation field, the total heating rate ET ( W.g-1 (C)) is given by:
ET = ΚC(ΕΤ).Κ . ∆∆T (1)
where ∆∆T is defined as ∆∆Τ = ∆T sample – ∆T reference. KC(ET) takes into account small nonlinearities due to heat
leakages by radiation, conduction in gas and the aluminum conductivity dependence with temperature. Kc (ET) is evaluated using a finite element model whose parameters have been adjusted in order to fit calculated temperatures with measured ones for both cells (reference and sample).
A second calibration of the probe, set in the device, has been made using the thermo-hydraulic bench dedicated to the OSIRIS experiments qualification. On this bench, with cooling water flows and water temperature representative of the reactor, the K calibration was found unchanged.
Measurement procedures
Once the probe is calibrated, the heating rate evaluation in the radiation field is performed in two steps [3, 4]. When cells are at the same level, ∆∆T is measured (∆T sample –∆T reference) and heating is deduced using (1). The step by step displacement of the calorimeter, allows plotting the heating profile. Note that the step can be a subdivision of the distance between cells (95mm) so as to draw the heating profile as finely as required. The usual procedure is as follows:
Starting from a given static position in the radiation field, temperatures of the sample cell are recorded. Then, taking advantage of the moving system, the whole calorimeter is shifted (move upward or downward) and temperatures of the reference cell are recorded when this latter is located at the same position as the sample was.
An alternative measurement can be performed by the “zero method” as shown in Fig. 2. The two cells being at the same core altitude, the nuclear energy deposit in the sample can be evaluated by adjusting the electrical power applied inside the reference cell heater so as to equalize ∆T sample and ∆T reference. Step 1 Step 2 electric power ∆ T sample 1 ∆ T ref 2 = ∆T sample 1 Measurement level
Fig. 2. The twocells being located at the same altitude, the current is adjusted inside the reference cell heater in order to cancel the quantity “∆TRef 2 - ∆TSample 1”.
The heating rate ET inside the sample is given by:
0
K
M
We
E
E T=
×
(2)Where We is the dissipated electric power (W) in the reference cell and ME the graphite sample mass. As there are always small differences of thermal transfer capabilities (slopes in °C.W1), we add a correction factor K0 to take into account this effect. For the current calorimetric probe K0 = 0.955.
IV. IN-CORE MEASUREMENTS AT NOMINAL POWER
Generalities
We remind that OSIRIS is a pool type light water reactor with an open core. The core is a compact unit, with an horizontal section of 60 cm × 70 cm and a height of 70 cm. The core housing contains a rack of 56 cells. This rack is loaded with 38 standard fuel elements, 6 control elements and up to 7 beryllium elements. At least two experimental locations (22 and 26) are used for radioisotopes production for medical application (MOLY devices). Remaining locations (24, 44 and 64) are dedicated to welcome experiments, and equipped with water boxes (82mm x 82mm) which can containup to 4 experiment rigs (37mm in diameter)(Fig. 3). Purpose of the CALMOS device is to make measurements in 24, 44 and 64 locations. Note that the heating level is higher and higher when we go up to the north, i.e 24 then 44 then 64. Until the end of 2012, safety considerations limited first campaigns [5] not to go beyond 6W.g-1. Therefore all measurements carried out in central locations (44, 64) which offer higher heating rates, were made with a reactor power limited to 40MW. Then, results were extrapolated to the nominal power.
Complementary thermal calculations have been carried out in 2013, with the help of the first experimental results, and demonstrated that such limitation criteria was too restrictive and could be suppressed, offering the possibility to extend measurements up to the full expected 13W.g-1 measurement range.
Therefore, all measurements carried out from 2013 to 2015, and detailed hereafter, have been made at or near the nominal power.
Recording of raw temperature values
Fig. 4 shows an example of signal acquisition at 65.35MWth in the 64South-East location. On this graph are plotted ∆T sample, ∆T reference and their difference ∆∆T. The lowest position (under -139 mm) is not reachable with the sample cell, whereas above the core the highest position (above +906mm) is not accessible with the reference cell [4, 5]. This is due to the probe configuration (see Fig. 1). Zoomed scale (on the right) permits to observe temperature variations far away above the core.
Fig. 4.∆T sample and ∆T reference temperature differences in the 64South-East location at 64.35MWth recorded along the total displacement system stroke. The fissile height is located between -320 and +320mm vs the core mid-plane. Curves on the right should be read on the right scale which is a zoom for low values.
Table I hereafter gathers maximum values of absolute temperatures reached during this scan.
TABLE I
TEMPERATURES IN THE CALORIMETRIC PROBE FOR THE HIGHEST MEASURED HEATING RATE (10.6W.G-1) IN THE 64SOUTH-EAST LOCATION AT 65.35MW.
Level (mm/PM)
Sample cell Reference cell
Pedestal Ref. ∆ T Pedestal Ref. ∆ T -44 438.6 111.8 326.8 276.1 96.3 179.8 +98 408.1 111.8 296.3 300.3 104.8 195.5
Knowledge of absolute temperatures in the calorimetric probe is important because we need to a keep sufficient margin, at least 100°C, with respect to the aluminum melting point (around 650°C)[7] at any point of the cell. For the targeted maximum heating range (13W.g-1), modeling results show that the hot point in aluminum is located in the upper
part of cell cylinder, clearly above the pedestal thermocouple (see Fig.1). Therefore this measurement point underestimates the maximum in the cell. As the difference can reach 90°C [5], our operating limit is around 460°C (650°C - 100°C - 90°C). All scans performed in the core respected this parameter. Example of recording
Fig 5 shows an example of heating profile drawn with 25 measurement points at 68.84MWth in the 44South-East location. Each point, deduced from the K calibration factor (1), is plotted with 1 sigma uncertainty bars [5]. The interpolated curve fits very well all points, and the rise of the relative uncertainty for low heating values is illustrated on right scale.
Fig. 5 Example of heating profile drawn with 25 measurement points performed in the 44South-East location at 68.84MWth. Uncertainties are indicated at 1 sigma.
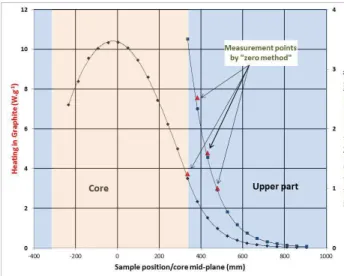
Use of the zero method in upper part of the core
The zero method can be considered in a first approach as an absolute heating measurement, and obviously must confirm results obtained with calibration coefficient. This measurement procedure has been already described in details [3, 4]. It has been performed systematically during each scan at several positions to make a comparison with heating values deduced from the calibration method. We remind that, at nominal power, such a method can only be performed in the upper part of the core where heating rates still remain under around 5W.g-1, level for which the current required in the balance process between cells remains under the 2A maximum value applicable in heater wires.
Fig. 6 shows a profile performed close to the nominal power in the 44 North-East location using four points (+478, +431, +383, +336mm/core mid-plane) with a double measurement, calibration and zero method. The last measurement has been made just at the transition fuel-moderator where the heating level is close to 3.7W.g-1. Table II gathers all available comparison data between both methods performed
systematically during the whole campaign in the core. The comparison has been made on a large heating range roughly from 0.4 to 3.7W.g-1. If we reject the aberrant 8.2% value in 44SW location (see table II), discrepancies do not exceed 5.8% in absolute value showing that methods are in acceptable agreement. However, if we analyze discrepancies for measurements performed in a same profile that means in a same scan, the difference seems to be systematic, and in most cases, an overestimation by the “zero method” (see results in 44SE, 44NE, 64NE).
Fig.6. Heating distribution in the 44North-East location at 67.71MWth with 4 points above the core measured by the “zero method”.
TABLE II
COMPARISON BETWEEN THE K CALIBRATION AND “ZERO” METHODS IN ALL EXPERIMENTAL LOCATIONS OF THE CORE
(NE:NORTHEAST ;SW:SOUTHWEST ;SE:SOUTHEAST).
Location K meth (W.g-1 (C)) zero meth. (W.g-1 (C)) (zero – K)/K (%) 24NE 0.476 1.181 0.464 1.168 -2.5 -1.1 44SW 0.158 0.369 0.973 0.146 0.375 0.938 -8.2 +1.6 -3.6 44SE 1.355 2.091 3.251 1.389 2.148 3.396 +2.5 +2.7 +4.5 44NE 0.986 1.547 2.385 3.537 0.999 1.593 2.524 3.732 +1.3 +3.0 +5.8 +5.5 64SW 2.51 3.61 2.45 3.41 -2.4 -5.5 64NE 0.386 0.612 0.985 1.552 2.461 0.398 0.637 1.024 1.607 2.554 +3.1 +4.1 +4.0 +3.5 +3.8
Such results lead us to assume that there is probably an overestimation in the electrical resistance evaluation of the
empty cell. Indeed, the effective length of heater wires which participates to the energy deposit by joule effect is very difficult to assess even by calculation (see chapter IX).
Nuclear heating evolution at the nominal power
Axial distributions of the nuclear field in the core depend on various parameters: the burnup of fuel elements close to the location, the other experiments near CALMOS which are in the same location and obviously, on the reactor power. As all these parameters remain unchanged for a given cycle, the nuclear field evolution along the cycle time (around 25 days) depends essentially on the control rods position.
To complete the measurement campaign dedicated to set the heating map at nominal power, the CALMOS device has been used to follow the heating distribution evolution in the “hottest” location in the core. Before 2013 [3, 4] measurement and monitoring of heating profiles at 70MWth nominal power had only been performed in the 24 location (see core diagram in Fig. 3) offering a heating level which does not exceed 6W.g-1. The 64 location, in the center of the core, can reach a twice higher level. On Fig. 7 are plotted two heating profiles measured in the 64 location corresponding both to the same F277 OSIRIS cycle, but separated by a 14 days interval, so that one relates to the beginning of the reactor cycle whereas the other one was made only some days before the shutdown.
Fig.7. Two axial heating distributions are plotted during the F277 Cycle (power 70MW; 64 NE; 20th February and 6th March 2015): the first performed at the beginning of the cycle on 20th February (blue line) and the second 14 days later, after a significant control rods evolution (red line). The control rod N°3 is moved up from the bottom to 284mm and the rod N°4 runs from 503mm to the complete extraction.
The first recording performed on 20th February, shows clearly a balanced distribution with a maximum located exactly at mid-plane. That is the consequence of an homogeneous control rods position (at top or bottom positions) which does not disturb the flux balance on either side of the mid-plane. Conversely, 14 days later, the BC3 rod is moved up to its mid-height position whereas the other rod is now completely
extracted, involving a flux rise in the low part of the core and a maximum flux plane shifted downwards to -30mm/core mid-plane. We can notice that the rest of the distribution, above the mid-plane, stays unchanged.
V. FINITE ELEMENT MODEL ADJUSTMENT WITH RECENT
EXPERIMENTAL DATA
A finite element model of the CALMOS device has been developed to be able to calculate temperatures anywhere in the probe and to simulate experiments in different conditions. Main assumptions were presented in [5]. Calculated and experimental temperatures were then compared until 6W.g-1 and were shown to be in good accordance. The new results obtained during the last campaign in the 64 core location were used to extend this comparison. These values were used as input data for the model which gave corresponding temperature calculations for pedestal and base thermocouples of both cells (sample and reference). The graph in Fig. 8 presents calculated and measured data for the sample cell. Similar results are obtained for the reference one.
Fig. 8. Evolution of experimental and calculated temperatures of pedestal and base thermocouples of the sample cell with heating rate up to 10.5W.g-1.
Results show that we are still in good agreement. We can notice that pedestal temperatures curves are nearly linear but, both experimental and measured base temperature curves are slightly curved. The base temperature near the thermocouple indeed depends on nonlinear phenomena such as the thermal contact resistance between the base and the sheath internal surface. This problem will be mainly solved with the CALMOS 2 configuration and we can therefore expect much more precision for the next calorimeter generation. We can also notice that thermal conductivity evolution law with temperature of the aluminum AW1050 was established in order to fit previous data at 6W.g-1 [7]. A linear evolution between 230 W.m-1 °K-1 at 20°C and 187 W.m-1.K-1 at 600°C was supposed [5]. This law has to be confirmed in order to evaluate the Kc constant properly and definitely. Independent thermal conductivity measurements on AW1050 aluminum alloy coupons are planned for that purpose in a specialized laboratory. The Kc will be assessed when these results are available.
VI. MEASUREMENT OF THERMAL NEUTRON FLUX PROFILES
Measurement of the conventional thermal neutron flux is made with the help of a specific SPND, especially designed to fit the calorimetric geometry. The SPND, with a Rhodium emitter length reduced to 10mm, is located inside the base of the sample cell in such way that the measurement level matches well with the calorimetric cell mid-height. Fig. 9 illustrates the putting into place of the Rhodium SPND during the manufacturing.
Fig. 9. Shaping and introduction of the specific Rhodium SPND inside central axis of the sample cell aluminum base. The emitter sensitive length is 10mm.
The Rhodium emitter has a neutron response both in thermal and epithermal ranges. As the CALMOS calorimeter mechanical stroke goes from -139mm to +1001mm/core mid-plane, it is necessary to calculate the spectrum variation along the stroke to process the SPND delivered current.
Fig. 10. Calculated epithermal index (epithermal neutron flux/thermal neutron flux) evolution in the 64 experimental location along the total mechanical stroke of the calorimetric cell. The index is ten times higher in the core with regard to the value in full moderator.
The epithermal index (epithermal neutron flux/thermal neutron flux) has been calculated inside the calorimetric cell by a TRIPOLI-4 Monte Carlo code, at the precise location of the SPND and for any altitude in the core. Fig 10 shows the evolution of the epithermal index which has been calculated inside the 64 experimental location. The index decreases sharply at the fuel-water transition to become ten times lower in the moderator.
VII. COMPARISON OF HEATING AND THERMAL FLUX PROFILES
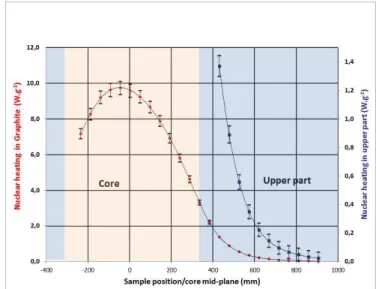
For each scan CALMOS allows measuring separately, nuclear heating, thermal neutron flux, or both at the same time. If we take advantage of a scan to make a simultaneous measurement we can observe the variation of both quantities along the total scanning height, covering the fissile part of fuel elements and up to 1000 mm above the core mid-plane. Fig. 11 shows an example of a simultaneous measurement performed in the core center (44SE location) and at a 68.84MW reactor power (brown area indicates the core, the blue one the moderator).
Fig. 11. Axial distributions of nuclear heating and thermal neutron flux simultaneously measured during a scan in 44SE location at 68.84MW and normalized to unity. Note the thermal flux behavior at the transition fuel moderator and the difference between signals attenuation when the probe moves away from the core (upper part).
Two phenomena are significant:
- There is a slope break in the thermal flux distribution centered around -320mm/core mid-plane due to the flux rise at the entrance of the moderator. This phenomenon, located exactly at the top of the fissile part, can be more or less accentuated according to the control rods position,
- The heating attenuation as the probe moves away from the core is quite different from the thermal flux one (see right scale in Fig. 11 zooming curves in upper part). Neutron flux decreases faster than nuclear heating (around a 2 ratio each 40mm against 80mm for heating). These attenuation ratios are
independent of the core location and control rods position.
VIII. CHECKING OF THE THERMAL NEUTRON FLUX PROFILE
CONSISTENCY
Comparison between two measurement devices
A specific device equipped with standard rhodium SPNDs, called MEREVER, has been used for many years inside the OSIRIS reactor to measure the thermal neutron flux profile inside the core. This standard equipment allows making a monitoring of the thermal flux distribution along each cycle with the help of 5 SPNDs stacked up inside a same aluminum rod. Therefore, the measured flux profile, drawn with only 5 points, is restricted to the core fissile height between -260 to +260mm/core mid-plane.
For checking the global consistency of the thermal neutron flux profile measured with the new type of SPND implemented in CALMOS, this latter was loaded during three different cycles side by side with the MEREVER device. That allowed to make a comparison of the two responses but restricted to the core fissile height. Fig. 12 shows one example of distributions measured when the two devices are side by side in the two south positions of the 44 location.
Fig. 12. Thermal neutron flux distributions measured at the same time by MEREVER and CALMOS devices in the 44SE location during the F274 OSIRIS cycle at 68.84MW. Both devices are in the same experimental location but not in the same orientation. The distribution provided by the MEREVER device is measured by only 5 points and restricted to the fissile height of the core (a blank square for the rod means it is completely extracted, when partially in orange that refers to a rod in an intermediate position).
We notice that:
- There is still the characteristic slope break in the distribution centered around -320mm/core mid-plane due to the flux rise at the entrance of the moderator, - The distribution provided by the MEREVER
equipment (blue line) is close to the distribution provided by the CALMOS one (red line). Shapes are
similar even though the flux level is 3.4% lower in the MEREVER distribution at the core mid-plane. We must notice that the geometric configuration inside which are placed the Rhodium SPNDs are slightly different between the two measurement devices. In addition, even though MEREVER and CALMOS devices are loaded inside a same experimental location, they cannot have the same orientation (four possible orientations per location, see Fig. 3) leading to a possible difference in thermal flux levels due to a control rods influence which is not the same. Finally, the CALMOS SPND signal was processed in the same way as standard ones. A complete calibration of this new SPND is ongoing to confirm these results. Despite all these remarks, we note a global agreement between the two responses.
Comparison with calculations
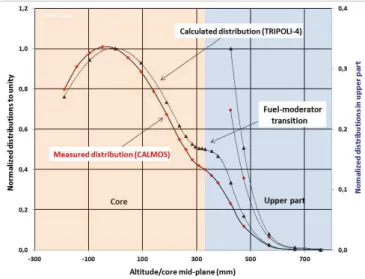
As already mentioned, the SPND signal processing requires a complete calculation [8] to evaluate the epithermal index in the precise CALMOS geometry all along the allowed scanning length (Fig. 10). To evaluate this index spectrum, both thermal and epithermal flux were evaluated using the TRIPOLI-4 calculation code. Therefore, a first comparison C/M is possible. Note that it has not been possible to make calculation and measurements in the same core configuration (fuel loading, rods position and orientation). Consequently we limit here the comparison to distribution shapes. Fig. 13 shows thermal neutron flux distributions in the 64NE location, normalized to unity, for both calculation and measurement.
Fig. 13. Calculated and measured thermal neutron flux distributions normalized to unity in the 64NE location. The shift downwards of the CALMOS profile is due to a difference in the control rods configuration between measurements and calculation. Nevertheless, behaviors of the two curves are significantly different around the transition area.
The measured profile seems to be slightly shifted downwards. This effect comes from the control rods position which is different between the two curves. For both situations the BC4 rod is completely extracted, but the BC3 rod is taken in high position for calculations whereas it was in mid-height position during the CALMOS scan, pushing the flux down.
The calculation seems to overestimate the flux rise at the moderator entrance (fuel-moderator transition) leading to a slop change which appears more attenuated in the CALMOS response. To draw up a finely profile, the scan step has been taken to 95mm in moderator, 48mm in core and reduced to 24mm in the transition area (near 320mm/mid-plane) to make a comparison as relevant as possible in the transition area. The difference of behavior is significant.
IX. EXPECTED ADVANTAGES WITH THE CALMOS2 EXPERIMENTAL DEVICE
The experience feedback acquired during this comprehensive measurement campaign led us to some improvements perspectives. A CALMOS 2 measurement device is currently under manufacturing and it integrates some fundamental technical changes verses the current version. Some of them are dedicated to improve the heating measurement, whereas others are implemented to reinforce the displacement system reliability. Hereafter, we only tackle with those relating to the heating measurement.
As shown in Table II, there is always a little but significant difference between results deduced from the zero method and the calibration factor. As there is no possibility to perform the zero method beyond 5W.g-1, it is crucial to obtain an excellent agreement between both procedures under this heating level so as to be confident in the calibration coefficient above.
Zero method by a four wires measurement
A first fundamental improvement in the calorimetric cell design is brought in order to find a better agreement between both ways to evaluate the nuclear heating. In the balance process (see chapter III), the nuclear energy deposit in the sample is evaluated by adjusting the electrical power applied inside the reference cell heater element in order to equalize ∆T sample and ∆T reference. Then, calculations of the WE energy deposit assume that, first, the effective length of heater wires is well known, and secondly that the electrical resistivity does not change with ageing or temperature. To suppress definitely such assumptions and to measure more accurately the energy deposit by joule effect, the reference cell of CALMOS 2 is equipped with a 4 wires element heater, 2 for intensity measurement and two for the voltage one as shown in Fig 14.
Such new power measurement does not make assumptions on the electrical resistance anymore.
Change of thermocouples locations
The second fundamental improvement has been implemented in CALMOS 2 to attempt reducing the K0 factor (2) so as to strive for an absolute measurement with the zero method.
Fig. 14. Differences between CALMOS 1 and CALMOS 2 geometries: the reference cell is equipped with a 4 wires element heater, the “cold” thermocouple is moved from the external base surface to the bottom of pedestal, height of the base is reduced from 35 to 20mm.
Let us remind that looking for the balance between the two temperatures difference by replacing nuclear energy deposit in the sample cell by joule effect in the reference one, assumes that cells are equivalent. As there are always slight mechanical differences, they cannot have exactly the same transfer capabilities (slope in °C.W-1)(chapter III). The lower the difference is, the lower is the K0 influence in equation (2). Fig 14 shows the fundamental difference in thermocouples location implemented in CALMOS 2. The slopes difference in CALMOS 1, measured during the calibration phase [3, 4], is 2.2%, whereas in CALMOS 2, which has been already calibrated, the new thermocouples location leads to a difference reduced to 0.5%. Then, the expected correction coefficient K0 will not exceed 0.99 instead of 0.955 for CALMOS 1. In addition, instead to have a thermocouple implemented in an intermediate position between the base external surface and the sheath internal one (CALMOS 1), the thermocouple is moved at the bottom of the pedestal in the medium of the thermal transfer. This position will allow a more accurate modelling assessment.
X. CONCLUSION
First incore measurements carried out in the OSIRIS reactor at the 70MWth nominal power have shown a satisfactory behavior of the calorimetric probe. This measurement campaign allowed characterizing all accessible experimental locations of the core both in nuclear heating and in conventional thermal neutron flux respectively up to 10.6 W.g1 (C) and 2.7 1014 n.cm-2.s-1. Obtained results by the zero method, used systematically in upper part of the core, are in acceptable agreement with those provided by the preliminary calibration (within 5.8%). Drawing heating and flux profiles
as defined as required show the ability to make a follow up of the radiation field evolution along the reactor cycle. In addition, new experimental data obtained up to 10.6W.g-1 are in acceptable agreement with the upgraded CASTEM calculation scheme. Nevertheless, to avoid any assumptions, the KC correction factor will be definitely estimated with the real measurement on the aluminum conductivity performed by a specialized laboratory, which is ongoing.
The experience feedback until now leads us to some improvements perspectives. The second prototype, CALMOS 2, is currently under manufacturing and the new calorimetric cell which will be implemented in the displacement system, is already calibrated. This new probe incorporates significant improvements to enhance measurement accuracies. On the other hand, several mechanical evolutions have been brought to the displacement system so as to reinforce the moving reliability and to better answer to safety requirements for a device dedicated to an MTR reactor.
ACKNOWLEDGEMENTS
This R&D program is carried out in the framework and with the financial support of the MCIS/INSNU project of CEA. Authors wish to thank the DEN/DM2S/SERMA service of CEA/Saclay, the DEN/DER/SPEx and SRJH services of CEA/Cadarache, and the LIMMEX joint laboratory between CEA and Aix-Marseille University, for fruitful and constructive discussions along this R&D program. They also acknowledge the operating personnel of the DEN/DRSN/SEROS service for their help during measurement campaigns in the OSIRIS reactor.
REFERENCES
[1] F. Ayela, H. Derrien “The development of an electrically compensated differential calorimeter for the measurement of in-pile heat evolution”. Technical Report CEA-R-2190, 1962. [2] IAEA, International Intercomparison of Calorimeters, Rapport N° 128, 1970.
[3] H. Carcreff, “Calmos : Innovative device for the measurement of nuclear heating in material testing reactors”. Journal of ASTM International (JAI , Volume 9, Issue3, March 2012.
[4] H. Carcreff, V. Clouté-Cazalaa, and L. Salmon, “Development, calibration and experimental results obtained with the innovative calorimeter (CALMOS) for nuclear heating measurements”, IEEE Trans. Nucl. Sci.,vol.54, no.4, pp. 1369-1376, Aug.2012.
[5] H. Carcreff, L. Salmon, and C. Courtaux, “First In-Core Measurement Results Obtained with the Innovative Mobile Calorimeter CALMOS inside the OSIRIS Material Testing Reactor”, IEEE Trans. Nucl. Sci., vol.61, no.4, Aug.2014. [6] H. Carcreff, Patent N° FR 1060068, December 3, 2010. [7] “Alliages d’aluminium”, http://www.euralliage.com [8] F. Lopez “Calculs d’indice épithermique dans le dispositif CALMOS pour m’interprétation du signal collectron dans et au-dessus du coeur du réacteur OSIRIS” note CEA/DEN/DM2S/SERMA/LPEC/NT/13-5545/A. Dec.2013. Heater element Graphite sample Pedestal Rhodium SPND SPNDTCHeater TC SPND TCHeater TC CALMOS 1 (sample cell) CALMOS 2 (reference cell)