HAL Id: hal-03041624
https://hal.inria.fr/hal-03041624
Submitted on 5 Dec 2020HAL is a multi-disciplinary open access
archive for the deposit and dissemination of sci-entific research documents, whether they are pub-lished or not. The documents may come from teaching and research institutions in France or abroad, or from public or private research centers.
L’archive ouverte pluridisciplinaire HAL, est destinée au dépôt et à la diffusion de documents scientifiques de niveau recherche, publiés ou non, émanant des établissements d’enseignement et de recherche français ou étrangers, des laboratoires publics ou privés.
Social Distancing: The Sensitivity of Numerical
Simulations
Christophe Henry, Kerlyns Martinez-Rodriguez, Mireille Bossy, Hervé
Guillard, Nicolas Rutard, Angelo Murrone
To cite this version:
Christophe Henry, Kerlyns Martinez-Rodriguez, Mireille Bossy, Hervé Guillard, Nicolas Rutard, et al.. Social Distancing: The Sensitivity of Numerical Simulations. ERCIM News, ERCIM, 2021, Special theme: Pandemic Modelling and Simulation, 2021 (124). �hal-03041624�
Social Distancing: The Sensitivity of Numerical
Simulations
by Christophe Henry, Kerlyns Martinez-Rodriguez, Mireille Bossy (Université Côte d’Azur, Inria, CNRS, Cemef, France), Hervé Guillard (Université Côte D’Azur, Inria, CNRS, LJAD, France), Nicolas Rutard and Angelo Murrone (DMPE, ONERA, France)
Researchers from Inria and the French Aerospace Lab ONERA are collaborating on a joint project. The goal is to assess the variability in the advice for social distancing precautions that can be drawn from numerical simulations of airborne dispersion. This variability depends on a number of factors, including: physical variables (e.g. droplet size, ejection velocity), modelling methods used (e.g. turbulence model) and numerical aspects (mesh). We use sensitivity analysis tools to quantify and order the role these factors play in influencing the numerical results.
Airborne transmission of respiratory diseases involves a number of disciplines such as virology, or fluid mechanics. The outbreak of COVID-19 has triggered a number of numerical studies to better understand the fate and transport of respiratory droplets in the air. This research aims at developing a methodology to evaluate the variability in numerical simulations of airborne dispersion that can provide astimations of social distancing precautions. For that purpose, we rely on standard techniques available in computational fluid dynamics (CFD) software to run numerical simulations of airborne dispersion. We then used variance-based methods [2], such as the “Sobol indices” or “variance-based sensitivity indices”, to analyse the variability of a number of parameters that were demonstrated to affect droplet dispersion.
For illustrative purposes, this paper details the results from the simple scenario of droplet emission in quiescent air. In this scenario, two observables are considered: the number of particles remaining above a given height after a period of time (here 1.5 m after 20 s) and the mean distance from the source after a given time period (here 20 s).
We performed numerical simulations with the Lagrangian tracking module of Code_Saturne CFD software [L1]. Prior to injection, the fluid was at rest and at a temperature of 25 °C. Droplets were injected into a box with dimensions of 4 x 3 x 2 m. Droplets are injected in the domain at a given location, with a height representative of an average adult’s height (here 1 x 2 x 1.7 m) and approximating the shape of a mouth (an ellipsoid with a width of 0.03 m and height of 0.015 m). In accordance with previous studies [1,2], we assumed droplets to be expelled from the mouth within a fixed cone, i.e. with a vertical injection angle in the range of 15 to 40° and with a horizontal injection angle in the range of –5 to 5°. Droplets were all injected with the same size and velocity. Simulations were run for a physical time of 20 s (with a time step of 0.01 s). To complete the simulation set-up, five additional input parameters were used as uncertainty sources modelled with the help of standard random distributions. A simulation is realised with a random trial of the input parameters according to the following distributions:
The droplet diameter (uniform distribution between 1 and 10 µm);
The cough velocity (Gaussian distribution, mean of 10 m/s and variance of 2 m/s); The cough duration (Gaussian distribution, mean of 75 ms and variance of 6 ms);
The head angle in relation to the vertical direction (uniform distribution from –15 to 50°). Results
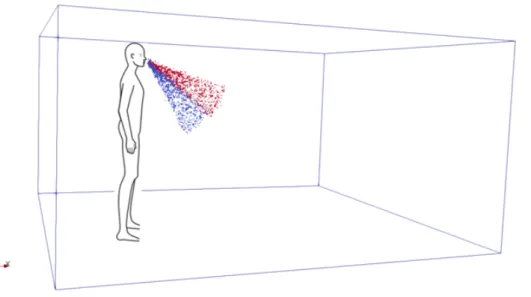
Figure 1 shows a typical set of results from our simulations: the droplets are dispersed in the flow at rest. Once injected in the simulation, these droplets undergo only Brownian motion and settling due to gravity. Due to their size and the fact that no evaporation is accounted for, gravity is the predominant force, which leads to their sedimentation on the ground within a finite time.
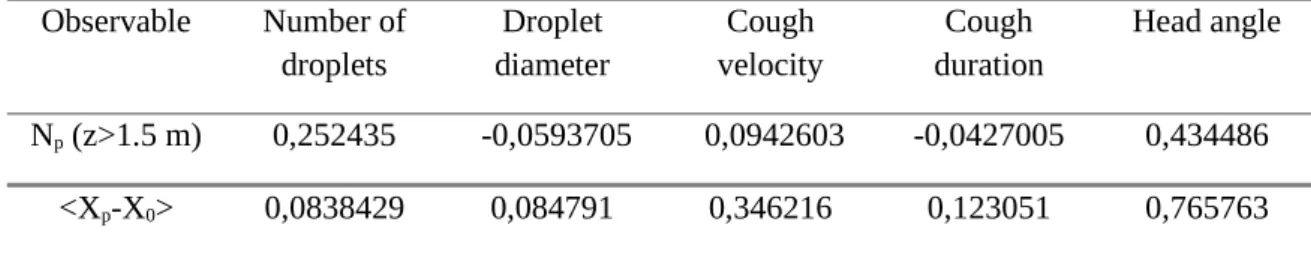
Using OpenTurns scientific library and API [2, L2], 6.000 simulations were performed with various values of the five uncertainty sources (i.e. droplet diameter, number of droplets, head angle, cough velocity and cough duration). The results obtained with the first order Sobol index are summarised in Table 1. Observable Number of droplets Droplet diameter Cough velocity Cough duration Head angle Np (z>1.5 m) 0,252435 -0,0593705 0,0942603 -0,0427005 0,434486 <Xp-X0> 0,0838429 0,084791 0,346216 0,123051 0,765763 Table 1. First-order Sobol indices obtained from 6,000 simulations, with a column for each uncertainty source and two lines corresponding to the two observables (number of droplets remaining
above a height of 1.5 m and the mean distance from the point source along the x-direction) . As expected, it appears that the number of droplets remaining above a certain height (here 1.5 m) varies mostly with the angle at which the head is tilted. The second parameter that affects the results is actually the number of droplets emitted during coughing, while the injection velocity is only the third most influential parameter (with a much lower importance).
Yet, if the observable of interest is taken to be the mean distance travelled by droplets along the horizontal direction, then the analysis changes. The results are again mostly affected by the angle at which the head is tilted, but the second input affecting the results is the velocity of injection of the droplets. The cough duration, the number of particles and the diameter of particles are less influential on the result.
This study illustrates the application of sensitivity analysis techniques to investigate the variability of numerical simulations of airborne dispersion. The first results show the robustness of such techniques as well as their limitations. In particular, in the simple case considered, the head angle during the cough is the key parameter driving the particles towards the ground. However, these results are expected to change significantly if another observable is used. Moreover, this study shows that, as prerequisite of the sensitivity analysis, a clear definition of an observable is needed.
Simulations in more complex cases are still underway due to the high numerical costs and size of data generated by such numerical experiments. In the near future, our analysis will move towards more realistic descriptions, including models for droplet evaporation/condensation as well as new models related to viral and biological properties (lifetime, contagiousness, etc.) that appear to be key in designing more efficient public health recommendations [1].
Links:
[L1]: https://www.code-saturne.org/
[L2]: http://openturns.github.io/openturns/master/contents.html
References:
[1] L. Bourouiba, E. Dehandschoewercker, J. W. Bush: “Fluid Mech.”, 745, 537-563, 2020 [2] J. K Gupta,. C. H. Lin, Q. Chen: “Indoor air”, 19(6), 517-525, 2009.
[3] M. Baudin,et al., in Handbook of Uncertainty Quantification, Springer International Publishing, 2016.
Please contact:
Christophe Henry
Université Côte d’Azur, Inria, CNRS, Cemef, France [email protected]
Figure 1. 3D plot of droplet dispersion generated from two simulations:
997 droplets of 7.6 μm injected during a time of 705 ms and at a velocity of 12.4 m/s (red dots); 997 droplets of 5.7 μm injected during a time of 743 ms and at a velocity of 11.4 m/s (blue dots).