HAL Id: hal-00683201
https://hal.archives-ouvertes.fr/hal-00683201
Submitted on 28 Mar 2012
HAL is a multi-disciplinary open access
archive for the deposit and dissemination of
sci-entific research documents, whether they are
pub-lished or not. The documents may come from
teaching and research institutions in France or
abroad, or from public or private research centers.
L’archive ouverte pluridisciplinaire HAL, est
destinée au dépôt et à la diffusion de documents
scientifiques de niveau recherche, publiés ou non,
émanant des établissements d’enseignement et de
recherche français ou étrangers, des laboratoires
publics ou privés.
Efficient services composition for grid-enabled
data-intensive applications
Tristan Glatard, Johan Montagnat, Xavier Pennec
To cite this version:
Tristan Glatard, Johan Montagnat, Xavier Pennec. Efficient services composition for grid-enabled
data-intensive applications. High Performance and Distributed Computing, Jun 2006, Paris, France.
pp.333-334, �10.1109/HPDC.2006.1652170�. �hal-00683201�
Efficient services composition for grid-enabled data-intensive applications
Tristan Glatard, Johan Montagnat
I3S, CNRS
{glatard,johan}@i3s.unice.fr
Xavier Pennec
INRIA, Epidaure
[email protected]
Abstract
The problem we address in this paper is to build complex applications by reusing and assembling scientific codes on a production grid infrastructure. We first review the two main paradigms for executing application code on a grid: (a) the task based approach, associated to global computing, characterized by its efficiency, and (b) the service approach developed in the meta computing and the Internet commu-nities, characterized by its flexibility. We carefully introduce the terminologies coming from different computing commu-nities and we combine the advantages of both approaches.
We argue that the service approach is more relevant for composing application codes. However, (i) it introduces an extra level of complexity on the application developer side and (ii) it makes application optimization on a grid more difficult. We propose solutions based on (i) a generic code wrapper which simplifies new application services devel-opment and (ii) a new grouping strategy coupled with tra-ditional data and services parallelization techniques, that proved to be underused in the grid area for optimization. These solutions are implemented in our grid workflow en-actor prototype. To our knowledge, it is the first implemen-tation taking into account all these optimization levels.
The theoretical performances are analyzed and com-pared to real measurements. Results are shown on a real, data-intensive application to medical images analysis. The execution is done on the very large scale EGEE produc-tion infrastructure. An execuproduc-tion time speed up of approxi-mately 9 is achieved, with a minimal additional cost for ap-plication developers. The strategies adopted being generic, many other applications could similarly be instrumented at very low cost. Moreover, our optimized application enactor is based on existing standards and it is freely available for download.
1. Introduction
As a consequence of the tremendous research effort car-ried out by the international community these last years and
the emergence of standards, grid middlewares have reached a maturity level such that large grid infrastructures where deployed (EGEE [8], OSG [24], NAREGI [21]) and sus-tained computing production was demonstrated for the ben-efit of many industrial and scientific applications [19]. Yet, current middlewares expose rather low level interfaces to the application developers and enacting an application on a grid often requires a significant work involving computer and grid system experts.
Considering the considerable amount of sequential, non grid-specific algorithms that have been produced for various data processing tasks, grid computing is very promising for: • Performing complex computations involving many
computation tasks (codes parallelism).
• Processing large amounts of data (data parallelism). Indeed, beyond specific parallel codes conceived for ex-ploiting an internal parallelism, grids are adapted to the massive execution of different tasks or the re-execution of a sequential code on different data sets which are needed for many applications. In both cases, temporal and data depen-dencies may limit the parallelism that can be achieved.
To handle user processing requests, two main strategies have been proposed and implemented in grid middlewares: 1. In the task based strategy, also referred to as global
computing, users define computing tasks to be
exe-cuted. Any executable code may be requested by specifying the executable code file, input data files, and command line parameters to invoke the execution. The task based strategy, implemented in GLOBUS [9], LCG2 [16] or gLite [13] middlewares for instance, has already been used for decades in batch computing. It makes the use of non grid-specific code very simple, provided that the user has a knowledge of the exact syntax to invoke each computing task.
2. The service based strategy, also referred to as meta
computing, consists in wrapping application codes into
standard interfaces. Such services are seen as black boxes from the middleware for which only the invoca-tion interface is known. Various interfaces such as Web
Services [30] or gridRPC [20] have been standardized. The services paradigm has been widely adopted by middleware developers for the high level of flexibil-ity that it offers (OGSA [10]). However, this approach is less common for application code as it requires all codes to be instrumented with the common service in-terface.
In this paper, we are interested in building data-intensive applications by composing data processing algorithms. We are proposing efficient and transparent grid processing of such applications on grid infrastructures through an opti-mized workflow manager. We discuss the strengths of the service based approach for achieving this goal in section2
and we present execution optimizations in section3. The workflow manager is evaluated on a realistic application to medical images registration in section4. The services com-position tool proposed is generic and reusable. Many ap-plication could thus be instrumented at a low cost from the application developer’s point of view.
2. Composing complex applications
Many sequential codes have been and are being devel-oped for data analysis. Building applications by assembling such algorithms is very common, in the image processing field for instance, where an image analysis procedure often involves a sequence of basic image processing operations. In many other application areas, such application compo-sition is praised as it allows code reusability without intro-ducing a too high load on the application developers.
The task based approach has been used for grid and batch computing for a very long time. The service based approach is more dynamic and flexible but it is usually used for ac-cessing remote resources which do not necessarily benefit from grid computing capabilities. This is acceptable for most middleware services that are located and executed on a single server but application services that may require compute-intensive code execution and that are invoked con-currently in the context of the target applications, can easily overwhelm the computing capabilities of a single host. To overcome these limitations some approaches have been ex-plored, such as submission services replacing the straight task submission [11] or generic services for wrapping any legacy code with a standard interface [15].
2.1. Composing services for building
appli-cations
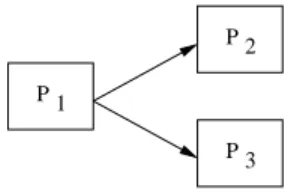
When building an application by composing basic pro-cessings, the application logic, referred to as the application
workflow, can intuitively be represented through a directed
graph of processors (graph nodes) representing computa-tion jobs and data dependencies (graph arrows) constraining the order of invocation of processors (see figure1).
2 P 1 P 3 P
Figure 1. Simple workflow example.
Many workflow representation formats and execution managers have been proposed in the literature with very dif-ferent capabilities [31]. We are especially targeting data-intensive workflow managers used for scientific applica-tions.
In the task based approach, the description of a task, or computation job, encompasses both the processing (binary code and command line parameters) and the data (static dec-laration). Workflow processors directly represent comput-ing tasks. The user is responsible for providcomput-ing the binary code to be executed and for writing down the precise invo-cation command line. All computations to be performed are statically described in the graph.
Conversely in the service based approach, the input data are treated as input parameters (dynamic declaration), and the service appears to the end user as a black box hiding the code invocation. This difference in the handling of data (static or dynamic declaration) makes the application com-position far easier from a user point of view, as detailed in section 2.2. The service based approach is also naturally very well suited for chaining the execution of different al-gorithms assembled to build an application. Indeed, the in-terface to each application component is clearly defined and the middleware can invoke each of them through a single protocol.
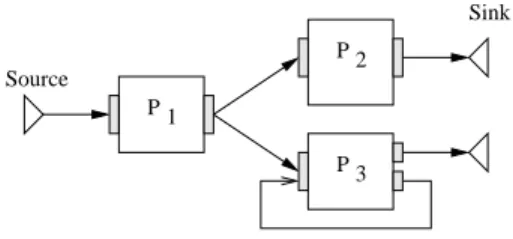
In a service based workflow, each processor is represent-ing an application component. In addition to the processors and the data arrows, a service based workflow representa-tion requires a number of input and output ports attached to each processor. The oriented arrows are connecting output ports to input ports. Two special processor nodes are de-fined: data sources are processors without input ports (they are producing data to feed the workflow) and data sinks are processors without output ports (they are collecting data produced).
A significant difference between the service and task ap-proaches of workflow composition is that there may exist loops in a service based workflow given that an input port can collect data from different sources as illustrated in fig-ure2. This kind of workflow pattern is common for opti-mization algorithms: it corresponds to an optiopti-mization loop
converging after a number of iterations determined at the execution time from a computed criterion. In this case, the output of processor P1would correspond to the initial value of this criterion. P3 produces its result on one of its two output ports, whether the computation has to be iterated one more time or not. On the contrary, there cannot be a loop in the graph of a task based workflow as this would mean that a processor input is depending on one of its output. An emblematic task-based workflow manager is indeed called Directed Acyclic Graph Manager (DAGMan) 1.
Compos-ing such optimization loop would not be possible, as the number of iterations is determined during the execution and thus cannot be statically described.
2 P 1 P 3 P Source Sink
Figure 2. Service-based workflow example.
The service based approach has been implemented in different workflow managers. The Kepler system [18] tar-gets many application areas from gene promoter identifi-cation to mineral classifiidentifi-cation. It can orchestrate stan-dard Web-Services linked with both data and control de-pendencies and implements various execution strategies. The Taverna project [23], from the myGrid e-Science UK project2 targets bioinformatics applications and is able to
enact Web-Services and other components such as Soaplab services [25] and Biomoby ones. It implements high level tools for the workflow description such as the Feta seman-tic discovery engine [17]. Other workflow systems such as Triana [28], from the GridLab project3, are decentralized
and distribute several control units over different comput-ing resources. This system implements both a parallel and a peer-to-peer distribution policies. It has been applied to various scientific fields, such as gravitational waves search-ing [7] and galaxy visualization [27].
2.2. Data-intensive grid-enabled
applica-tions
The main difference between the task based and the ser-vice based approach appears when considering the reexe-cution of the same application workflow over an input data set. In a task based workflow, a computation task is defined
1Condor DAGMan,http://www.cs.wisc.edu/condor/dagman/ 2http://mygrid.org.uk 3http://www.gridlab.org . . . . . . A B A A A 0 1 n B 0 B1 B n . . . . . . A B A A A 0 1 n B 0 B1 B n
Figure 3. Action of the cross product (left) and
dot product(right) operators on the input data
by a single input data set and a single processing. Executing the same processing over two data results in two indepen-dent tasks. This approach enforces the replication of the execution graph for every input data to be processed.
To get closer to the service-based approach, a simple extension to the task based approach is to propose multi-input data tasks descriptions where a generic task can be described for a set of input data, resulting in the execution of multiple jobs: one per input data. However, it is far from be-ing commonly available in today’s production middlewares and it is often treated at the application level. Moreover, multi-input tasks cannot be used in a workflow where each task needs to be replicated for every input data.
The service based approach easily accommodates with input data sets. Data sources are sequentially delivering input data but no additional complexity of the application graph is needed. An example of the flexibility offered by the service-based approach is the ability to define differ-ent iteration strategies over the input data of a service. When a service owns two input ports or more, an itera-tion strategy defines the composiitera-tion rule for the data com-ing from all input ports pairwise. Consider two input sets A = {A0,A1, . . . ,An} and B = {B0,B1, . . . ,Bm} to a service. The most common iteration strategy consists in processing each data of the first set with each data of the second set in their order of definition, thus producing min(n, m) result. This corresponds to the case where a se-quence of pairs need to be processed. This iteration strat-egy is referred to as a dot product in the Taverna commu-nity [23]. Another common iteration strategy, called a cross
product, consists in processing all input data from the first
set with all input data from the second set, thus produc-ing m× n results. Figure3illustrates these two strategies. Many other strategies could be implemented but we limit ourselves to these two ones that are sufficient for imple-menting most applications.
Using iteration strategies to design complex data inter-action patterns is a very powerful tool for data-intensive application developers. It makes the task replication prob-lem associated to the task-based workflows combinatorial: a cross product produces an enormous amount of tasks and chaining cross products just makes the application
work-flow representation intractable even for a limited number (tens) of input data. Despite the availability of graphical tools to design application workflow, dealing with many in-put data quickly becomes impossible for users.
2.3. Data synchronization barriers
A particular kind of processors are algorithms that need to take into account the whole input data set in their pro-cessing rather than propro-cessing each input one by one. This is the case for many statistical operations computed on the data, such as the computation of a mean or a standard devia-tion over the produced results for instance. Such processors are referred to as synchronization processors has they repre-sent real synchronization barriers, waiting for all input data to be processed before being executed.
2.4. Interfaces and platforms
Another strength of the service based approach is to eas-ily deal with multiple execution platforms. Each service is called as a black box without knowledge of the underlying platform. Several services may execute on different plat-forms transparently which is convenient when dealing with legacy code. In the task based approach, a specific submis-sion interface is needed for each infrastructure.
3. Scheduling and executing the services
work-flow
The service based approach is making services composi-tion easier than the task based approach as discussed above. It is thus highly convenient from the end user point of view. However, in this approach, the control of jobs submissions is delegated to external services, making the optimization of the workflow execution much more difficult. The ser-vices are black boxes isolating the workflow manager from the execution infrastructure. In this context, most known optimization solutions do not hold.
Many solutions have indeed been proposed in the task-based paradigm to optimize the scheduling of an applica-tion in distributed environments [6]. Concerning workflow-based applications, previous works [2] propose specific heuristics to optimize the resource allocation of a complete workflow. Even if it provides remarkable results, this kind of solutions is not directly applicable to the service-based approach. Indeed, in this latest approach, the workflow manager is not responsible for the task submission and thus cannot optimize the resource allocation.
Focusing on the service-based approach, nice develop-ments such as the DIET middleware [5] and comparable ap-proaches [26,1] introduce specific strategies such as hierar-chical scheduling. In [4] for instance, the authors describe a
way to handle file persistence in distributed environments, which leads to strong performance improvements. How-ever, those works focus on middleware design and do not include any workflow management yet. Moreover, those solutions require specific middleware components to be de-ployed on the target infrastructure. As far as we know, such a deployment has only been done on experimental platforms yet [3], and it is hardly possible for an application running on a production infrastructure.
Hence, there is a strong need for precisely identifying generic optimization solutions that apply to service-based workflows. In the following sections, we are exploring dif-ferent strategies for optimizing the workflow execution in a service based approach, thus offering the flexibility of ser-vices and the efficiency of tasks. First of all, several level of parallelism can be exploited when considering the work-flow execution for taking advantage of the grid computing capabilities. We describe them and then study their impact on the performances with respect to the characteristics of the considered application. Besides, we propose a solution for grouping sequential jobs in the workflow, thus allowing more elaborated optimization strategies in the service-based workflow area.
3.1. Asynchronous services calls
To enable parallelism during the workflow execution, multiple application services have to be called concurrently. The calls made from the workflow enactor to these services need to be non-blocking for exploiting the potential paral-lelism. GridRPC services may be called asynchronously as defined in the standard [20]. Web Services also the-oretically enables asynchronous calls. However, the vast majority of existing web service implementations do not cover the whole standard and none of the major implemen-tations [29,14] do provide any asynchronous service calls for now. As a consequence, asynchronous calls to web ser-vices need to be implemented at the workflow enactor level, by spawning independent system threads for each processor being executed.
3.2. Workflow parallelism
Given that asynchronous calls are possible, the first level of parallelism that can be exploited is the intrinsic workflow parallelism depending on the graph topology. For instance if we consider the simple example presented in figure 2, processors P2 andP3 may be executed in parallel. This optimization is trivial and implemented in all the workflow managers cited above.
3.3. Data parallelism
When considering data-intensive applications, several input data sets are to be processed using a given workflow. Benefiting from the large number of resources available in a grid, workflow services can be instantiated as several com-puting tasks running on different hardware resources and processing different input data in parallel.
Data parallelism denotes that a service is able to
pro-cess several data sets simultaneously with a minimal per-formance loss. This capability involves the processing of independent data on different computing resources.
Enabling data parallelism implies, on the one hand, that the services are able to process many parallel connections and, on the other hand, that the workflow engine is able to submit several simultaneous queries to a service leading to the dynamic creation of several threads. Moreover, a data parallel workflow engine should implement a dedicated data management system. Indeed, in case of a data parallel ex-ecution, a data is able to overtake another one during the processing and this could lead to a causality problem, as we exemplified in [11]. To properly tackle this problem, data provenance has to be monitored during the data parallel ex-ecution. Detailed work on data provenance can be found in [32].
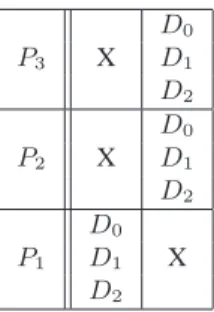
Consider the simple workflow made of 3 services and represented on figure 1. Suppose that we want to execute this workflow on 3 independent input data sets D0, D1and D2. The data parallel execution diagram of this workflow is represented on figure4. On this kind of diagram, the ab-scissa axis represents time. When a data set Diappears on a row corresponding to a processor Pj, it means that Di is being processed by Pj at the current time. To facilitate legibility, we represented with the Di notation the piece of data resulting from the processing of the initial input data set Diall along the workflow. For example, in the diagram of figure 4, it is implicit that on the P2 service row, D0 actually denotes the data resulting from the processing of the input data set D0by P1. Moreover, on those diagrams we made the assumption that the processing time of every data set by every service is constant, thus leading to cells of equal widths. Data parallelism occurs when different data sets appear on a single square of the diagram whereas in-trinsic workflow parallelism occurs when the same data set appears many times on different cells of the same column. Crosses represent idle cycles.
As demonstrated in the next sections, fully taking into account this level of parallelism is critical in service-based workflows, whereas it does not make any sense in task-based ones. Indeed, in this case it is covered by the work-flow parallelism because each task is explicitly described in the workflow description.
D0 P3 X D1 D2 D0 P2 X D1 D2 D0 P1 D1 X D2
Figure 4. Data parallel execution diagram of the workflow of figure1
P3 X D0 D1 D2
P2 X D0 D1 D2
P1 D0 D1 D2 X
Figure 5. Service parallel execution diagram of the workflow of figure1
3.4. Services parallelism
Input data sets are likely to be independent from each other. This is for example the case when a single workflow is iterated in parallel on many input data sets.
Services parallelism denotes that the processing of two
different data sets by two different services are totally inde-pendent. This pipelining model, very successfully exploited inside CPUs, can be adapted to sequential parts of service-based workflows. Consider again the simple workflow rep-resented in figure 1, to be executed on the 3 independent input data sets D0, D1and D2. Figure5presents a service parallel execution diagram of this workflow. Service par-allelism occurs when different data sets appear on different cells of the same column. We here supposed that a given service can only process a single data set at a given time (data parallelism is disabled).
Data synchronization barriers, presented in section 2.3, are of course a limitation to services parallelism. In this case, this level of parallelism cannot be exploited because the input data sets are dependent from each other.
Here again, we show in the next section that service par-allelism is of major importance to optimize the execution of service-based workflows. In task-based workflow, this level of parallelism does not make any sense because it is included in the workflow parallelism.
3.5. Theoretical performance analysis
The data and service parallelism described above are specific to the service-based workflow approach. To
pre-cisely quantify how they influence the application perfor-mances we model the workflow execution time for differ-ent configurations. We first presdiffer-ent general results and then study particular cases, making assumptions on the type of application run.
3.5.1 Definitions and notations
In the workflow, a path denotes a set of processors linking an input to an output. The critical path of the workflow denotes the longest path in terms of execution time.
nW denotes the number of services on the critical path of the workflow and nDdenotes the number of data sets to be executed by the workflow.
i denotes the index of the ithservice of the critical path of the workflow (i∈ [0, nW − 1]). Similarly j denotes the index of the jth data set to be executed by the workflow (j∈ [0, nD− 1]).
Ti,j denotes the duration in seconds of the treatment of the data set j by the service i. If the service submits jobs to a grid infrastructure, this duration includes the overhead in-troduced by the submission, scheduling and queuing times.
Σ denotes the total execution time of the workflow
3.5.2 Hypotheses
The critical path is assumed not to depend on the data set. This hypothesis seems reasonable for most applications but may not hold in some cases as for example the one of work-flows including algorithms containing optimization loops whose convergence time is likely to vary in a complex way w.r.t the nature of the input data set.
Data parallelism is assumed not to be limited by infras-tructure constraints. We justify this hypothesis consider-ing that our target infrastructure is a grid, whose computconsider-ing power is sufficient for our application.
In this section, workflows are assumed not to contain any synchronization processors. Workflows containing such synchronization barriers may be analyzed as two sub work-flows respectively corresponding to the parts of the ini-tial workflow preceding and succeeding the synchronization barrier.
3.5.3 Execution times modeling
Under those hypotheses, we can determine the expression of the total execution time of the workflow for different ex-ecution policies:
• Sequential case (without service nor data parallelism): Σ = X
i<nW X
j<nD
Ti,j (1)
• Case DP: Data parallelism only ΣDP = X i<nW max j<nD {Ti,j} (2)
• Case SP: Service parallelism only
ΣSP = TnW−1,nD−1+ mnW−1,nD−1 (3) with: ∀i 6= 0 and ∀j 6= 0,
mi,j= max(Ti−1,j+ mi−1,j, Ti,j−1+ mi,j−1) and: m0,j = X k<j T0,k and mi,0= X k<i Tk,0
• Case DSP: both Data and Service parallelism ΣDSP = max j<nD ( X i<nW Ti,j ) (4)
All the above expressions of the execution times can be demonstrated recursively. By lack of space, these proofs are not expanded here.
3.5.4 Asymptotic speed-ups
To better understand the properties of each kind of paral-lelism, it is interesting to study the asymptotic speed-ups resulting from service and data parallelism in particular ap-plication cases.
Massively data-parallel workflows. Let us consider a massively (embarrassingly) data-parallel application (sin-gle processor P0, very large number of input data). In this case, nW = 1 and the execution time is:
ΣDP = ΣDSP = max j<nD (T0,j) ≪ Σ = ΣSP = X j<nD T0,j
In this case, data parallelism leads to a significant speed-up. Service parallelism is useless but it does not lead to any overhead.
Non data intensive workflows. In such workflows, nD= 1 and the execution time is:
ΣDSP = ΣDP = ΣSP = Σ = X
i<nW Ti,0
In this case, neither data nor service parallelism lead to any speed-up. Nevertheless, none of them does introduce any overhead.
Data intensive complex workflows. In this case, we will suppose that nW > 1 and nD > 1. In order to analyze the speed-ups introduced by service and data parallelism, we make the simplifying assumption of constant execution times: Ti,j = T . The workflow execution time then re-sumes to:
Σ = nD× nW × T ΣDP = ΣDSP = nW × T
ΣSP = (nD+ nW − 1) × T If service parallelism is disabled, the speed-up intro-duced by data parallelism is:
SDP = Σ ΣDP
= nD
If service parallelism is enabled, the speed-up introduced by data parallelism is:
SDSP = ΣSP ΣDSP
= nD+ nW − 1 nW
If data parallelism is disabled, the speed-up induced by service parallelism is:
SSP = Σ ΣSP
= nD× nW nD+ nW− 1
Service parallelism does not lead to any speed-up if it is coupled with data parallelism: SSDP =
ΣDP
ΣDSP = 1 . Thus, under those assumptions, service parallelism may not be of any use on fully distributed systems. However, section 4
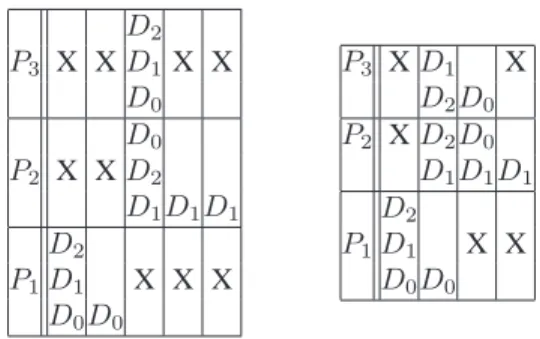
will show that even in case of homogeneous input data sets, T is hardly constant in production systems because of the high variability of the overhead due to submission, schedul-ing and queuschedul-ing times on such large scale and multi-user platforms. The constant execution time hypothesis does not hold. This appears to be a significant difference between grid computing and traditional cluster computing. Figure6
illustrates on a simple example why service parallelism do provide a speed-up even if data parallelism is enabled, if the assumption of constant execution times does not hold. The left diagram does not take into account service parallelism whereas the right one does. The processing time of the data set D0is twice as long as the other ones on service P0and the execution time of the data set D1is three times as long as the other ones on service P1. It can for example occur if D0was submitted twice because an error occurred and if D1remained blocked on a waiting queue. In this case, ser-vice parallelism improves performances beyond data paral-lelism as it enables some computations overlap. It justifies the experimental observations done in section4.
D2 P3 X X D1X X D0 D0 P2 X X D2 D1D1D1 D2 P1D1 X X X D0D0 P3 X D1 X D2D0 P2 X D2D0 D1D1D1 D2 P1D1 X X D0D0
Figure 6. Workflow execution time without (left) and with (right) service parallelism when the execution time is not constant.
3.6. Grouping services and targeting the
ex-ecution platform
In addition to the known strategies described so far, we propose a processors grouping strategy to further optimize the execution time of a workflow. Processors grouping con-sists in merging multiple jobs into a single one. It reduces the grid overhead induced by the submission, scheduling, queuing and data transfers times whereas it may also reduce the parallelism. In particular sequential processors grouping is interesting because those processors do not benefit from any parallelism. For example, considering the workflow of our application presented on figure 9we can, for each data set, group the execution of thecrestLinesand the
crestMatchjobs on the one hand and thePFMatchICP
and thePFRegisterones on the other hand.
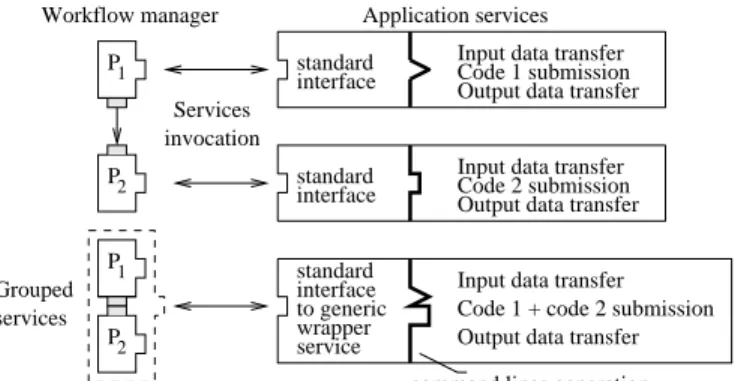
Grouping jobs in the task-based approach is straightfor-ward and it has already been proposed for optimization [2]. Conversely, jobs grouping in the service-based approach is usually not possible given that (i) the services composing the workflow are totally independent from each other (each service is providing a different data transfer and job submis-sion procedure) and (ii) the grid infrastructure handling the jobs does not have any information concerning the flow and the job dependencies. Consider the simple work-flow represented on the left side of figure7. On top, the ser-vices for P1and P2are invoked independently. Data trans-fers are handled by each service and the connection between the output of P1and the input of P2is handled at the work-flow engine level. On the bottom, P1 and P2 are grouped in a virtual single service. This service is capable of invok-ing the code embedded in both services sequentially, thus resolving the data transfer and independent code invocation issues. It breaks the hypothesis of all services seen as black boxes whose internal logic is unknown.
The solution we propose to enable job grouping in a service-based workflow is to use a generic submission
ser-Grouped services P1 2 P 2 P P1 interface standard interface
standard Code 1 submission
to generic
Input data transfer Output data transfer
Code 2 submission Input data transfer Output data transfer
Output data transfer Code 1 + code 2 submission Input data transfer interface
standard wrapper service
command lines generation Workflow manager Application services
invocation Services
Figure 7. Classical services invocation (top) and services grouping (bottom).
vice. This service is able to wrap any executable code. It exposes a standard interface that takes as input (i) a generic descriptor of the executable command line and (ii) the input parameters and data of this executable. The command line description has to be complete enough to allow dynamic composition of the command line from the list of param-eters at the service invocation time and to access the ex-ecutable and input data files. As a consequence, the exe-cutable descriptor contains:
1. The name and access method of the executable. In our current implementation, access methods can be a URL, a Grid File Name (GFN) or a local file name. The wrapper is responsible for fetching the data according to different access methods.
2. The name and access method of the sandboxed files. Sandboxed files are external files such as dynamic li-braries or scripts that may be needed for the execution although they do not appear on the command-line. 3. The access method and command-line option of the
input data. As our approach is service-based, the ac-tual name of the input data files is not mandatory in the description. Those values will be defined at the execution time. This feature differs from various job description languages used in the task-based middle-wares. The command-line option allows the service to dynamically build the actual command-line at the exe-cution time.
4. The command-line option of the input parameters: pa-rameters are values of the command-line that are not files and thus does not have any access method. 5. The access method and command-line option of the
output data. This information enables the service to
register the output data in a suitable place after the ex-ecution.
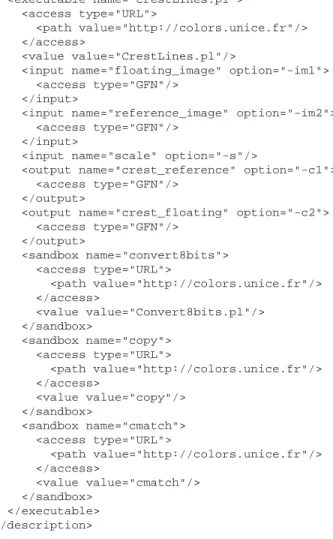
We gather all this information into an XML file. An example of such as description file is presented in fig-ure 8. It corresponds to the description of the service
crestLines of the workflow of figure 9. It describes the script CrestLines.plwhich is available from the servercolors.unice.frand takes 3 input arguments: 2 files (options-im1and-im2of the command-line) that are already registered on the grid as GFNs at execution time and 1 parameter (option-sof the command-line). It pro-duces 2 files that will be registered on the grid. It also re-quires 3 sandboxed files that are available from the server
colors.unice.fr.
This generic service highly simplifies application devel-opment because it is able to wrap any legacy code with a minimal effort. The application developer only needs writ-ing the executable descriptor for her code to become service aware. But its main advantage is in enabling the sequential services grouping optimization. Indeed, as the workflow enactor has access to the executable descriptors, it is able to dynamically create a virtual service, composing the com-mand lines of the codes to be invoked, and submitting a single job corresponding to this sequence of command lines invocation.
It is important to notice that our solution remains com-patible with the services standards. The workflow can still be executed by other enactors, as we did not introduce any new invocation method. Those enactors will make standard service calls (e.g. SOAP ones) to our generic wrapping ser-vice.
4. Results using our enhanced workflow
enac-tor prototype
The goal of this section is to present experimental re-sults that quantify the relevance of the optimizations de-scribed above on a real service-based data-intensive appli-cation workflow. We first present the design of an enhanced workflow enactor prototype that implements those features and we then evaluate its performance on the EGEE produc-tion grid infrastructure.
4.1. Workflow enactment
We implemented a prototype of a workflow enactor tak-ing into account the optimizations mentioned in section3: workflow, data and service parallelism and sequential pro-cessors grouping. Our hoMe-made OpTimisEd scUfl en-actoR (MOTEUR) prototype was implemented in Java, in order to be platform independent. It is available under Ce-CILL Public License (a GPL-compatible open source li-cense) at http://www.i3s.unice.fr/˜ glatard.
<description> <executable name="CrestLines.pl"> <access type="URL"> <path value="http://colors.unice.fr"/> </access> <value value="CrestLines.pl"/>
<input name="floating_image" option="-im1"> <access type="GFN"/>
</input>
<input name="reference_image" option="-im2"> <access type="GFN"/>
</input>
<input name="scale" option="-s"/>
<output name="crest_reference" option="-c1"> <access type="GFN"/>
</output>
<output name="crest_floating" option="-c2"> <access type="GFN"/> </output> <sandbox name="convert8bits"> <access type="URL"> <path value="http://colors.unice.fr"/> </access> <value value="Convert8bits.pl"/> </sandbox> <sandbox name="copy"> <access type="URL"> <path value="http://colors.unice.fr"/> </access> <value value="copy"/> </sandbox> <sandbox name="cmatch"> <access type="URL"> <path value="http://colors.unice.fr"/> </access> <value value="cmatch"/> </sandbox> </executable> </description>
Figure 8. Example of an executable descrip-tion file.
To our knowledge, this is the only service-based workflow enactor providing all these levels of optimization.
The workflow description language adopted is the Sim-ple Concept Unified Flow Language (Scufl) used by the Taverna workbench [23]. This language is currently becom-ing a standard in the e-Science community. Apart from de-scribing the data links between the services, the Scufl lan-guage allows to define so-called coordination constraints. A coordination constraint is a control link which enforces an order of execution between two services even if there is no data dependency between them. We used those co-ordination constraints to identify services that require data synchronization.
We developed an XML-based language to be able to de-scribe input data sets. This language aims at providing a file format to save and store the input data set in order to be able to re-execute workflows on the same data set. It simply describes each item of the different inputs of the workflow.
Handling the iteration strategies presented in section2.2
in a service and data parallel workflow is not straightfor-ward because produced data sets have to be uniquely iden-tified. Indeed they are likely to be computed in a different order in every service, which could lead to wrong dot prod-uct computations. Moreover, due to service parallelism, several data sets are processed concurrently and one can-not number all the produced data once computations com-pleted. We have implemented a data provenance strategy to sort out the causality problems that may occur. Attached to each processed data segment is a history tree containing all the intermediate results computed to process it. This tree unambiguously identifies the data.
Finally, MOTEUR is implementing an interface to both Web Services and GridRPC instrumented application code.
4.2. Bronze Standard application
We made experiments considering a medical imaging rigid registration application. Medical image registration consists in searching a transformation (that is to say 6 pa-rameters in the rigid case – 3 rotation angles and 3 transla-tion parameters) between two images, so that the first one (the floating image) can superimpose on the second one (the reference image) in a common 3D frame. Medical im-age registration algorithms are a key component of medical imaging workflows.
The application we are working on aims at assessing registration results with a statistical approach called the Bronze-Standard [22]. The goal is basically to compute the registration of a maximum of image pairs with a maximum number of registration algorithms so that we obtain a largely overestimated system to relate the geometry of all the im-ages. As a consequence, the mean registration should be more precise and is called a bronze-standard. It implies that
we are first able to process registrations of many pairs of images, which is a data-intensive problem.
The workflow of our application is represented on figure 9. The two inputs referenceImage and
floatingImagecorrespond to the image sets on which the evaluation is to be processed. The first registra-tion algorithm is crestMatch. Its result is used to initialize the other registration algorithms which are
Baladin,YasminaandPFMatchICP/PFRegister.
crestLines is a pre-processing step. Finally, the
MultiTransfoTestservice is responsible for the evalu-ation of the accuracy of the registrevalu-ation algorithms, leading to the outputs values of the workflow. This service eval-uates the accuracy of a specified registration algorithm by comparing its results with means computed on all the oth-ers. Thus, the MultiTransfoTest service has to be synchronized: it must be enacted once every of its ancestor is inactive. This is why we figured it with a double square on figure9.
We chose this particular application because it is a real example of data-intensive workflow in the medical imaging field. Moreover, it embeds a synchronization barrier and thus provides an interesting case of complex service-based workflow.
Input image pairs are taken from a database of injected T1 brain MRIs from the cancer treatment center ”Centre Antoine Lacassagne” in Nice, France, courtesy of Dr Pierre-Yves Bondiau. All images are 256×256×60 and coded on 16 bits, thus leading to a 7.8 MB size per image (approxi-mately 2.3 MB when compressed without loss).
4.3. Execution platform
In order to evaluate the relevance of our prototype and to compare real executions to theoretically expected results, we made experiments on the EGEE production grid infras-tructure. This platform is a pool of thousands computing (standard PCs) and storage resources accessible through the LCG2 middleware. The resources are assembled in comput-ing centers, each of them runncomput-ing its internal batch sched-uler. Jobs are submitted from a user interface to a central Resource Broker which distributes them to the available re-sources. Not only workflow and service parallelism but also data parallelism make sense on such a grid infrastructure. Indeed, every instance of a service will be submitted to the grid and thus executed on a different processor.
4.4. Experiments
We executed our workflow on 3 different inputs data sets, with various sizes, corresponding to the registration of 12, 66 and 126 image pairs from the above mentioned database, corresponding to images from1, 7 and 25 patients
respec-Configuration Computation time (s)
12 images 26 images 126 images
NOP 32855 76354 133493 JG 22990 68427 125503 SP 18302 63360 120407 DP 17690 26437 34027 SP+DP 7825 12143 17823 SP+DP+JG 5524 9053 14547
Table 1. Execution time for each configura-tion
y-intercept Slope (seconds) (s/data sets)
NOP 20784 884 JG 11093 900 SP 6382 897 DP 16328 143 SP+DP 6625 88 SP+DP+JG 4310 79
Table 2. Y-intercept and slope of the obtained straight lines, for each configuration
tively on whom acquisitions have been done at several time points to monitor the growth of brain tumors. Each of the input image pair was registered with the 4 algorithms and leads to 6 job submissions, thus producing a total number of72, 396 and 756 job submissions respectively. We sub-mitted each dataset 6 times with 6 different optimization configurations in order to identify the specific gain provided by each optimization.
4.5. Results
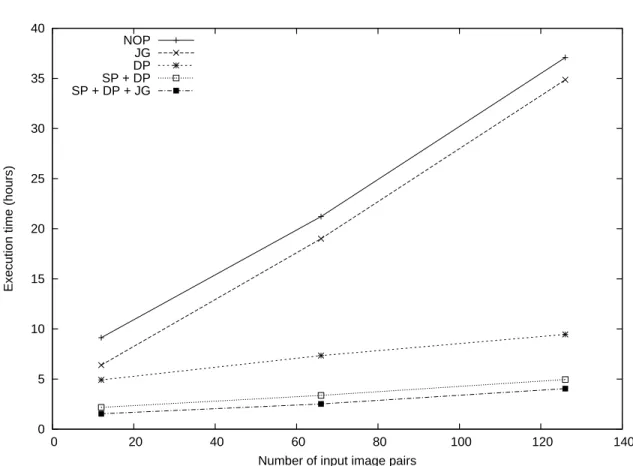
Figure10displays the experimental results we obtained for each of execution configuration mixing Data Parallelism (DP), Service Parallelism (SP) and Job Grouping (JG). The configuration with no optimization (NOP) only includes workflow parallelism. The corresponding numeric values are presented in table 1 with execution times in seconds. The full experiment lead to a total running time of 9 days and 8 hours.
We can notice on figure10that the graphical representa-tions of the execution times with respect to the size of the input data set size are almost straight lines. This could be expected as the infrastructure is large enough to support the increasing load.
referenceImage floatingImage getFromEGEE getFromEGEE PFRegister Yasmina Baladin PFMatchICP getFromEGEE getFromEGEE MethodToTest MultiTransfoTest crestMatch crestLines accuracy_rotation accuracy_translation
Figure 9. Workflow of the application
0 5 10 15 20 25 30 35 40 0 20 40 60 80 100 120 140
Execution time (hours)
Number of input image pairs NOP
JG DP SP + DP SP + DP + JG
5. Discussion
5.1. Metrics for the analysis
To analyze performances, the first relevant metric from the user point of view is the speed-up, measured as the ra-tio of the execura-tion time over the reference execura-tion time. We also introduce two other metrics, y-intercept and slope ratios of the time curves versus input data size, that allow a more precise interpretation of experiments on production grid infrastructures.
Indeed, on multi-users systems, the overhead introduced by submission, scheduling, queuing and data transfers times can be very high (around 10 minutes) and quite variable (± 5 minutes) as we already noticed before. This overhead is measured by the y-intercept value of the curves: this value denotes the time spent for the processing of0 data set and thus corresponds to the incompressible amount of time re-quired to access the infrastructure. Therefore, we introduce the y-intercept ratio as a metric to compare the influence of methods on the system’s overhead. This ratio compares the y-intercept value of the analyzed line with the one of a reference line.
Besides, given the linear aspect of the execution time curves, we approximate them as lines by linear regression. The slope of these regression lines measure the data scal-ability of the grid, that is to say its scal-ability to process huge data sets with the same level of performance. Consequently, we introduce the slope ratio as a metric to compare the influ-ence of methods on the infrastructure data scalability. This ratio compares the slope value of the analyzed line with the one of a reference line. The higher the number of data to process, the more important the slope ratio parameter is compared to the y-intercept one.
In case of low latency infrastructures such as local clus-ters, the y-intercept ratio would be meaningless because it would be close to0. This metric is thus more specific to pro-duction grid infrastructures such as the one we described in section4.3.
In the following sections, we use the slope and y-intercept ratios in addition to the speed-up metric. For each configuration, we reported the y-intercept and the slope of the lines in table2. Those values were obtained by linear re-gressions on measurements displayed in table1. We relate our experimental results to the theoretical ones that we pre-sented in section3.5. As our data set is quite homogeneous (all the images have the same size), we make the hypothesis of constant execution times and thus refer to the results pre-sented in the last paragraph of section3.5.4and in particular to SDP, SSP and SSDP. For our application, nW is5 and nDis either12, 66 or 126, depending on the input data set.
5.2. Impact of the data and service
paral-lelism
DP versus NOP. Given the data-intensive nature of the application, the first level of parallelism to enable to im-prove performances is data parallelism. In this case, the last paragraph of section3.5.4predicted a speed-up SD = nD. We obtain speed-ups of1.86, 2.89 and 3.92 for nD = 12, 66 and 126 image pairs respectively. This speed-up is effec-tively growing with the number of input images as predicted by the theory, although it is lower than expected. Indeed, this experiment shows that the system variability (on trans-fer and queuing time in particular) and the increasing load of the middleware services on a production infrastructure cannot be neglected.
To go further in the analysis, we can compute from ta-ble2that in this case, data parallelism leads to a slope ratio of6.18 and to a y-intercept ratio of 1.27. Data parallelism thus mainly influences the slope ratio. It is coherent as this metric is designed to evaluate the data scalability of the sys-tem. Although a higher slope ratio could be expected on a dedicated system to some extent (until the number of ded-icated resources is reached), we can see that in our experi-ment the grid infrastructure smoothly accepts the increasing load (no saturation effect). This is interesting for applica-tions such as the Bronze Standard that needs the highest number of data to be processed as possible.
(DP + SP) versus DP. One can notice is that service paral-lelism does introduce a significant speed-up even if data par-allelism is enabled. Indeed, it leads to a speed-up of2.26, 2.17 and 1.90 for 12, 66 and 126 image pairs respectively whereas the theory predicted a speed-up of SSDP = 1. This result can be justified by noticing that the constant times hy-pothesis may not hold on such a production infrastructure, as already suggested in section3.5.4. On a traditional clus-ter infrastructure, service parallelism would be of minor im-portance whereas it is a very important optimization on the production infrastructure we used.
Moreover, we can then notice that in case of data par-allelism, service parallelism leads to a slope ratio of 1.62 and to a y-intercept ratio of 2.46. This is another argu-ment which demonstrates that service parallelism is particu-larly important on production infrastructures. On traditional clusters indeed, y-intercept values may be close to 0 and such systems would therefore be less impacted by a reduc-tion of this metric.
5.3. Impact of the job grouping
JG vs NOP. The speed-up introduced by job grouping is 1.43, 1.12 and 1.06 for 12, 66 and 126 image pairs respec-tively. It leads to a slope ratio of0.98 and to a y-intercept
ratio of1.87. Job grouping only influences the y-intercept ratio. It is coherent because it has been designed to lower the system’s overhead which is evaluated by the y-intercept value.
(JG + SP + DP) vs (SP + DP) In addition to data and service parallelism, job grouping introduces a speed-up of 1.42, 1.34 and 1.23 for 12, 66 and 126 image pairs respec-tively. It leads to a slope ratio of1.11 and to a y-intercept ratio of 1.54. Here again, job grouping mainly improves the y-intercept ratio, which is coherent with the expected behavior.
We can thus conclude that job grouping effectively ad-dresses the problem for which it as been designed as it leads to a significant reduction of the system’s overhead.
5.4. Optimization perspectives
The y-intercept and slope values are able to quantify how an application could be improved, without any reference to the scale of the infrastructure. Indeed, an ideal system would have a null slope and a close to zero y-intersect.
The y-intercept value of DP+SP+JG quantifies the poten-tial overhead reduction that could be targeted. In the future, we plan to address this problem by grouping jobs of a single service, thus finding an trade-off between data parallelism and the system’s overhead.
Besides, the slope value of DP+SP+JG quantifies the po-tential data scaling improvement that could be targeted. On an ever-loaded production infrastructure, middleware ser-vices such as the user interface or the resource broker may be critical bottlenecks. The theoretical modeling does not take into account these limitations. A probabilistic model-ing considermodel-ing the variable nature of the grid infrastructure is probably an interesting future path to explore for further optimizing this value [12].
5.5. Conclusions
Grids have a very interesting potential for processing data intensive applications and composing new applications from services wrapping application code. However, the level of flexibility introduced by the service based approach also lowers the computations efficiency.
In this paper we have reviewed several optimization strategies that can be exploited to efficiently process such applications. We proposed a method for grouping job sub-missions in a service-based workflow. We designed a com-plete prototype of an optimized workflow enactor taking into account workflow, services and data parallelism and which is able to group sequential jobs in order to speed-up the execution on a grid infrastructure. The implemented prototype is able to deal with existing standard workflows
and services description languages. To our knowledge no other workflow enactor does exploit all these strategies to-day. The modeling of the overall execution times demon-strates that in different scenarios, the workflow manager never leads to performance drops and that it is particularly efficient for dealing with data-intensive applications. This is confirmed by an experiment on a medical image regis-tration application which precisely quantifies the impact of these optimizations. In addition to the traditional speed-up metric, we introduced the y-intercept and slope ratios which are particularly suited for the interpretation of optimizations on production grids.
We have plans for further optimizing the workflow en-gine. In particular, we are thinking of an optimal strategy to adapt the jobs’ granularity to the grid load and a prob-abilistic modeling of the ever-changing production grid in-frastructure.
6. Acknowledgment
This work is partially funded by the French research program “ACI-Masse de donn´ees” (http://acimd.labri.fr/), AGIR project (http://www.aci-agir.org/). We are grateful to the EGEE European project for providing the grid infras-tructure and user assistance.
References
[1] D. Arnold, S. Agrawal, S. Blackford, J. Dongarra, M. Miller, K. Seymour, K. Sagi, Z. Shi, and S. Vadhiyar. Users’ Guide to NetSolve V1.4.1. Technical Report ICL-UT-02-05, Uni-versity of Tennessee, Knoxville, jun 2002.
[2] J. Blythe, S. Jain, E. Deelman, Y. Gil, K. Vahi, A. Mandal, and K. Kennedy. Task Scheduling Strategies for Workflow-based Applications in Grids. In CCGrid, Cardiff, UK, 2005. [3] F. Cappello, F. Desprez, M. Dayde, E. Jeannot, Y. Jegou, S. Lanteri, N. Melab, R. Namyst, P. Vicat-Blanc Primet, O. Richard, E. Caron, J. Leduc, and G. Mornet. Grid’5000: A Large Scale, Reconfigurable, Controlable and Moni-torable Grid Platform. In 6th IEEE/ACM International
Workshop on Grid Computing (Grid’2005), Seattle,
Wash-ington, USA, nov 2005.
[4] E. Caron, B. Del-Fabbro, F. Desprez, E. Jeannot, and J.-M. Nicod. Managing Data Persistence in Network Enabled Servers. Scientific Programming Journal, 2005.
[5] E. Caron, F. Desprez, F. Lombard, J.-M. Nicod, M. Quin-son, and F. Suter. A Scalable Approach to Network Enabled Servers. In 8th International EuroPar Conference (), vol-ume 2400 of LNCS, pages 907–910, Paderborn, Germany, aug 2002. Springer-Verlag.
[6] H. Casanova, A. Legrand, D. Zagorodnov, and F. Berman. Heuristics for Scheduling Parameter Sweep Applications in Grid Environments. In 9th Heterogeneous Computing
[7] D. Churches, B. S. Sathyaprakash, M. Shields, I. Taylor, and I. Wand. A Parallel Implementation of the Inspiral Search Algorithm using Triana. In Proceedings of the UK e-Science
All Hands Meeting (), Nottingham, UK, sep 2003.
[8] European IST project of the FP6, Enabling Grids for E-sciencE, apr. 2004-mar. 2006.
http://www.eu-egee.org/.
[9] I. Foster. Globus Toolkit Version 4: Software for Service-Oriented Systems. In International Conference on Network
and Parallel Computing (IFIP), volume 3779, pages 2–13.
Springer-Verlag LNCS, 2005.
[10] I. Foster, C. Kesselman, J. Nick, and S. Tuecke. The Phys-iology of the Grid: An Open Grid Services Architecture for Distributed Systems Integration. Technical report, Open Grid Service Infrastructure WG, Global Grid Forum, June 2002.
[11] T. Glatard, J. Montagnat, and X. Pennec. Grid-enabled workflows for data intensive medical applications. In 18th
IEEE International Symposium on Computer-Based Medi-cal Systems (ISCBMS), jun 2005.
[12] T. Glatard, J. Montagnat, and X. Pennec. Probabilistic and dynamic optimization of job partitioning on a grid in-frastructure. In 14th euromicro conference on Parallel,
Distributed and network-based Processing, pages 735–745,
Montbliard-Sochaux, France, Feb. 2006. [13] gLite middleware.http://www.gLite.org.
[14] R. Irani and S. J. Bashna. AXIS: Next Generation Java SOAP. Wrox Press, may 2002.
[15] P. Kacsuk, A. Goyeneche, T. Delaitre, T. Kiss, Z. Farkas, and T. Boczko. High-Level Grid Application Environment to Use Legacy Codes as OGSA Grid Services. In
Proceed-ings of the Fifth IEEE/ACM International Workshop on Grid Computing (GRID ’04), pages 428–435, Washington, DC,
USA, 2004. IEEE Computer Society.
[16] LCG2 middleware. http://lcg.web.cern.ch/LCG/activities/-middleware.html.
[17] P. Lord, P. Alper, C. Wroe, and C. Goble. Feta: A light-weight architecture for user oriented semantic service dis-covery. In European Semantic Web Conference (), 2005. [18] B. Ludscher, I. Altintas, C. Berkley, D. Higgins, E. Jaeger,
M. Jones, E. A. Lee, J. Tao, and Y. Zhao. Scientific Work-flow Management and the Kepler System. Concurrency and
Computation: Practice & Experience, 2005.
[19] J. Montagnat, F. Bellet, H. Benoit-Cattin, V. Breton, L. Brunie, H. Duque, Y. Legr´e, I. Magnin, L. Maigne, S. Miguet, J.-M. Pierson, L. Seitz, and T. Tweed. Medical images simulation, storage, and processing on the european datagrid testbed. Journal of Grid Computing, 2(4):387–400, Dec. 2004.
[20] H. Nakada, S. Matsuoka, K. Seymour, J. Dongarra, C. Lee, and H. Casanova. A GridRPC Model and API for End-User Applications. Technical report, Global Grid Forum (GGF), jul 2005.
[21] National Research Grid Initiative (NAREGI).
http://www.naregi.org.
[22] S. Nicolau, X. Pennec, L. Soler, and N. Ayache. Evalua-tion of a New 3D/2D RegistraEvalua-tion Criterion for Liver Radio-Frequencies Guided by Augmented Reality. In International
Symposium on Surgery Simulation and Soft Tissue Modeling
(IS4TM’03), volume 2673 of LNCS, pages 270–283,
Juan-les-Pins, 2003. INRIA Sophia Antipolis, Springer-Verlag. [23] T. Oinn, M. Addis, J. Ferris, D. Marvin, M. Senger,
M. Greenwood, T. Carver, K. Glover, M. R. Pocock, A. Wipat, and P. Li. Taverna: A tool for the composition and enactment of bioinformatics workflows. Bioinformatics
journal, 17(20):3045–3054, 2004.
[24] Open Science Grid (OSG).
http://www.opensciencegrid.org.
[25] M. Senger, P. Rice, and T. Oinn. Soaplab - a unified Sesame door to analysis tool. In UK e-Science All Hands Meeting (), pages 509–513, Nottingham, sep 2003.
[26] Y. Tanaka, H. Nakada, S. Sekiguchi, T. Suzumura, and S. Matsuoka. Ninf-G: A Reference Implementation of RPC-based Programming Middleware for Grid Computing.
Jour-nal of Grid Computing (JGC), 1(1):41–51, 2003.
[27] I. Taylor, M. Shields, I. Wand, and R. Philp. Grid Enabling Applications Using Triana. In Workshop on Grid
Applica-tions and Programming Tools (). Held in Conjunction with
GGF8, 2003.
[28] I. Taylor, I. Wand, M. Shields, and S. Majithia. Distributed computing with Triana on the Grid. Concurrency and
Com-putation: Practice & Experience, 17(1–18), 2005.
[29] R. A. Van Engelen and K. A. Gallivan. The gSOAP Toolkit for Web Services and Peer-to-Peer Computing Networks. In Proceedings of the 2nd IEEE/ACM International
Sym-posium on Cluster Computing and the Grid (CCGRID ’02),
page 128, Washington, DC, USA, 2002. IEEE Computer So-ciety.
[30] W. World Wide Web Consortium. Web Services Description Language (WSDL) 1.1, mar 2001.
[31] J. Yu and R. Buyya. A taxonomy of scientific workflow sys-tems for grid computing. ACM SIGMOD Record, 34(3):44– 49, Sept. 2005.
[32] J. Zhao, C. Goble, R. Stevens, D. Quan, and M. Green-wood. Using Semantic Web Technologies for Represent-ing e-Science Provenance. In Third International
Seman-tic Web Conference (ISWC2004), pages 92–106, Hiroshima,