HAL Id: hal-02155709
https://hal.archives-ouvertes.fr/hal-02155709
Submitted on 25 May 2021
HAL is a multi-disciplinary open access
archive for the deposit and dissemination of
sci-entific research documents, whether they are
pub-lished or not. The documents may come from
teaching and research institutions in France or
abroad, or from public or private research centers.
L’archive ouverte pluridisciplinaire HAL, est
destinée au dépôt et à la diffusion de documents
scientifiques de niveau recherche, publiés ou non,
émanant des établissements d’enseignement et de
recherche français ou étrangers, des laboratoires
publics ou privés.
Detection by voxel-wise statistical analysis of significant
changes in regional cerebral glucose uptake in an
APP/PS1 transgenic mouse model of Alzheimer’s
disease
Albertine Dubois, Anne-Sophie Herard, Benoit Delatour, Philippe Hantraye,
Gilles Bonvento, Marc Dhenain, Thierry Delzescaux
To cite this version:
Albertine Dubois, Anne-Sophie Herard, Benoit Delatour, Philippe Hantraye, Gilles Bonvento, et al..
Detection by voxel-wise statistical analysis of significant changes in regional cerebral glucose uptake
in an APP/PS1 transgenic mouse model of Alzheimer’s disease. NeuroImage, Elsevier, 2010, 51 (2),
pp.586-598. �10.1016/j.neuroimage.2010.02.074�. �hal-02155709�
Detection by voxel-wise statistical analysis of signi
ficant changes in regional cerebral
glucose uptake in an APP/PS1 transgenic mouse model of Alzheimer's disease
Albertine Dubois
a,b,⁎
, Anne-Sophie Hérard
a, Benoît Delatour
c, Philippe Hantraye
a, Gilles Bonvento
a,
Marc Dhenain
a, Thierry Delzescaux
aa
CEA-DSV-I2BM-MIRCen-LMN, Orsay, France b
CEA-DSV-I2BM-Neurospin-LRMN, Gif-sur-Yvette, France c
CNRS UMR 8620, Orsay, France
a b s t r a c t
a r t i c l e i n f o
Article history: Received 16 November 2009 Revised 17 February 2010 Accepted 25 February 2010 Available online 4 March 2010 Keywords:3D reconstruction
Voxel-wise statistical analysis Transgenic mouse brain Alzheimer's disease Cerebral glucose uptake Autoradiography
Biomarkers and technologies similar to those used in humans are essential for the follow-up of Alzheimer's disease (AD) animal models, particularly for the clarification of mechanisms and the screening and validation of new candidate treatments. In humans, changes in brain metabolism can be detected by 1-deoxy-2-[18F] fluoro-D-glucose PET (FDG-PET) and assessed in a user-independent manner with dedicated software, such as Statistical Parametric Mapping (SPM). FDG-PET can be carried out in small animals, but its resolution is low as compared to the size of rodent brain structures. In mouse models of AD, changes in cerebral glucose utilization are usually detected by [14C]-2-deoxyglucose (2DG) autoradiography, but this requires prior manual outlining of regions of interest (ROI) on selected sections. Here, we evaluate the feasibility of applying the SPM method to 3D autoradiographic data sets mapping brain metabolic activity in a transgenic mouse model of AD. We report the preliminary results obtained with 4 APP/PS1 (64 ± 1 weeks) and 3 PS1 (65 ± 2 weeks) mice. We also describe new procedures for the acquisition and use of “blockface” photographs and provide the first demonstration of their value for the 3D reconstruction and spatial normalization of post mortem mouse brain volumes. Despite this limited sample size, our results appear to be meaningful, consistent, and more comprehensive thanfindings from previously published studies based on conventional ROI-based methods. The establishment of statistical significance at the voxel level, rather than with a user-defined ROI, makes it possible to detect more reliably subtle differences in geometrically complex regions, such as the hippocampus. Our approach is generic and could be easily applied to other biomarkers and extended to other species and applications.
© 2010 Elsevier Inc. All rights reserved.
Introduction
Alzheimer's disease (AD) is a neurodegenerative process leading to progressive and irreversible impairments of cognition and behavior. It is associated with a severe neuronal loss, and the accumulation of amyloid-β (Aβ) plaques and neurofibrillary tangles (NFT) (Goedert and Spillantini, 2006).
Definitive diagnosis of AD still requires the post mortem examina-tion of brain tissue, to obtain evidence that these specific neuropath-ological lesions are present. Over the last 30 years, considerable progress has been made in the development of biomarkers to bridge the gap between the“gold standard” of post mortem neuropatholog-ical confirmation and the clinical diagnosis of AD on the basis of cognitive deficits and the exclusion of other dementia disorders. Among other techniques, functional neuroimaging with positron
emission tomography (PET) is being investigated as a possible source of biomarkers for AD. In particular, 1-deoxy-2-[18F]fluoro-D-glucose
(FDG)-PET detects changes in cerebral metabolism during both the prodomal and clinical phases of AD. It is highly sensitive and can thus identify target structures at high risk of disruption by AD (Reiman et al., 1996; Minoshima et al., 1997). Recently developed PET tracers, such as Pittsburgh Compound B (PIB) and 2-(1-6-[(2-18F-fluoroethyl) (methyl)amino]2-naphthylethylidene)-malononitrile (FDDNP) have been used to visualize Aβ plaques and NFT in AD patients ( Shoghi-Jadid et al., 2002; Klunk et al., 2004; Small et al., 2006). FDDNP binds to both amyloid plaques and tangles, whereas PIB selectively labels amyloid plaques.
Several potential treatments for AD are currently being developed and are tested in transgenic animal models – mostly mice – overexpressing a mutated form of the human Aβ precursor protein (APP) gene associated with familial forms of AD. Both single (PDAPP, (Games et al., 1995); Tg2576, (Hsiao et al., 1996) and double (APP × mutated PS1, PSAPP) transgenic mice develop plaques in the brain. However, co-expression with the gene encoding human
⁎ Corresponding author. CEA-DSV-I2BM-SHFJ Inserm U803, 4 place du Général Leclerc, 91401 Orsay Cedex, France. Fax: +33 1 69 86 77 45.
E-mail address:albertine.dubois@cea.fr(A. Dubois).
1053-8119/$– see front matter © 2010 Elsevier Inc. All rights reserved. doi:10.1016/j.neuroimage.2010.02.074
Contents lists available atScienceDirect
NeuroImage
mutated presenilin 1 significantly decreases the age at which the first plaques are detected (Duff et al., 1996; Holcomb et al., 1998). The pathological features observed in these APP and PSAPP transgenic mice include diffuse amyloid deposits and dense core (fibrillar) plaques mimicking the senile plaques of human AD patients. These transgenic mice provide a means to detect and track biomarker changes similar to those observed in humans. They are therefore of potential interest in the understanding of the disease mechanisms, such as biological aspects of the changes in cerebral glucose utilization, and the preclinical screening of new disease-slowing treatments.
(FDG)-PET can be performed in small animals, but its spatial resolution (∼0.5 to 3 mm) is low as compared to the size of rodent brain structures, making it impossible to avoid the inclusion of tissues with different rates of metabolism within a single voxel or region of interest (ROI). In mouse models of AD, changes in cerebral glucose utilization are therefore usually detected by high-resolution autora-diography (∼100–200 µm), which remains the reference technique for functional neuroimaging in small-animal research. Quantitative autoradiographic studies are classically analyzed through manual segmentation of ROIs on a limited number of 2D sections (Dodart et al., 1999; Reiman et al., 2000; Niwa et al., 2002; Sadowski et al., 2004; Valla et al., 2006). These techniques, however, may be subject to observer bias and inaccurate manual delineation, particularly when the ROI is defined directly on autoradiographic modality images. Moreover, ROI-based analyses are intrinsically hypothesis-driven, and significant effects in areas away from the pre-defined ROIs may be overlooked.
The inherent limitations of ROI-based analysis have been tackled by the use of methods combining data from different subjects into a common spatial referential. This spatial normalization of data from individual subjects to a standardized brain volume makes it possible to use voxel-wise statistical analysis for group comparisons. The recent application of these methods to 3D-reconstructed autoradio-graphic images led to the identification of significant functional differences in various brain regions, between two groups of rats in specific experimental conditions (treadmill walking, (Nguyen et al., 2004); cortical deafness model, (Lee et al., 2005); conditioned fear, (Holschneider et al., 2006); and visual stimulus, (Dubois et al., 2008b). In the current study, we evaluated the feasibility and the reliability of applying spatial normalization and voxel-wise statis-tical analysis to 3D autoradiographic data sets first time mapping brain metabolic activity in a mouse model of AD (smallest brain structures and species investigated so far). We report the preliminary results obtained in such a pathological context with a limited sample size (n = 7). We also describe new procedures for the acquisition and use of photographs of the brain face taken during sectioning, generally referred to as“blockface photographs”, and provide the first demonstration of their value for the 3D reconstruction and spatial normalization of post mortem mouse brain volumes. Despite being limited by the relatively small sample size, we discuss the reliability of our preliminaryfindings and the likely contribution of voxel-wise analysis to increasing knowledge about neurodegenerative diseases and to the efficient development and exhaustive validation of new therapeutic approaches.
Materials and methods Animals
Experiments were conducted on adult APP/PS1 transgenic mice. This transgenic line is based on the overexpression of both human amyloid precursor protein (APP driven by the Thy-1 promoter and harboring three familial mutations, the Swedish K670M/N671L and London V717I mutations) and mutant presenilin 1 (PS1 with the M146L mutation). The mutated presenilin 1 gene accelerates amyloid
deposition (Blanchard et al., 2003). In these transgenic mice, amyloid deposition begins at the age of 2.5 months (Wirths et al., 2001). Heterozygous APP/PS1 mice were obtained by crossing heterozygous transgenic APP(+/−) mice with homozygous transgenic PS1(+/+)
mice. The APP(−/−)/PS1(+/−)mouse littermates (PS1) resulting from
crossings were used as controls as they display no amyloid plaques and can therefore allow to specifically evaluate the effects of the APP transgene on amyloid deposition in the brain (Delatour et al., 2006; El Tannir El Tayara et al., 2006; Dhenain et al., 2009). All the procedures were designed to minimize animal suffering and were carried out in accordance with the recommendations of the EEC (86/609/EEC) and the French National Committee (87/848) for the use of laboratory animals.
Measurement of [14C]-2-deoxyglucose (2-DG) uptake
We measured 2-DG uptake in 4 APP/PS1 (64 ± 1 weeks) and 3 PS1 (65 ± 2 weeks) mice. Experiments were performed on conscious, lightly restrained animals. Animals were fasted but had free access to water for 12 h before the experiment. On the day of the experiment, mice were anesthetized with isoflurane and a catheter was inserted intraperitoneally. Body temperature was monitored rectally and maintained at 37 °C with a thermostatically controlled heating pad. Mice were allowed to recover from anesthesia for 1 h and were then injected with 2-DG (16.5 µCi/100 g body weight). Uptake occurred over a period of 45 min and the animals were then euthanized by injection of a lethal dose of sodium pentobarbital. The entire brain was removed and split into its left and right hemispheres. For each animal, we evaluated cerebral glucose uptake in the right hemisphere by quantitative autoradiography, whereas the left hemisphere was processed for amyloid deposit detection by standard Congo red staining.
Congo red staining
The left hemispheres were fixed in 10% buffered formalin and stored in thisfixative, at 4 °C, until processing for histology. They were cut into 40 µm-thick coronal sections on a freezing microtome after cryoprotection in 20% glycerin and 2% dimethyl sulfoxide in 0.1 M phosphate buffer. Amyloid deposits were labeled by standard Congo red staining (incubation for 30 min in an 80% ethanol solution saturated with Congo red and sodium chloride). Each Congo red-stained section was digitized, using a high-resolutionflatbed scanner with 4000 dpi in-plane resolution (pixel size 6.35 × 6.35 µm2).
Data acquisition and 3D reconstruction of blockface, autoradiographic and histological post mortem volumes
The right hemispheres, destined for autoradiography, were snap-frozen in isopentane at −40 °C. They were then embedded in a custom-made mixture of M1 embedding matrix (Shandon, Pittsburg, PA, USA) and Fast Green (Sigma-Aldrich, Lyon, France) and cut into 20 µm-thick coronal sections on a cryostat. Every fourth section was mounted on Superfrost glass slides, rapidly heat-dried and placed against autoradiographicfilm for one week, together with radioactive [14C] standards. The same sections were then processed for Nissl
staining. The olfactory bulb and the cerebellum were excluded from the sectioning process.
Blockface volume
Images from the surface of the frozen hemisphere were recorded with a digital camera (Canon Powershot G5 Pro) before the cutting of each fourth section. These photographs were taken at the end of the cryostat wheel crank course, ensuring that the brain was in the same position for all sections (X and Y axes) and at the same distance from the camera (Z axis). An optic fiber-ring light was fixed onto the
objective of the camera. This provided uniform, reproducible illumination of the sample. A computer was used to control the camera, making it possible to take images remotely, and the images were stored directly on this computer. For each right hemisphere, we obtained a series of about 120 blockface photographs with an in-plane resolution of 27 × 27μm2(Fig. 1A). The calibration factor between the
number of pixels in the images and the corresponding distance in millimeters was determined by obtaining an image of a piece of graph paper in the focal plane before sectioning. To reduce thefield of view, the photographs were first cropped manually by interactively selecting the four points defining the coordinates of the right, left, top and bottom borders (Fig. 1B). They were then automatically segmented to separate the brain tissue from the embedding medium and to set the background to zero (Fig. 1C). Series of segmented photographs were stacked in the Z direction, to create a 3D consistent blockface volume (Fig. 1D). No registration was required due to the natural spatial consistency of the images.
Autoradiographic and histological volumes
The autoradiographs, the corresponding Nissl-stained sections and the [14C] standards were digitized as 8-bit gray-scale images, using a
flatbed scanner with 1200 dpi in-plane resolution (pixel size 21 × 21 µm2). As previously described (Dubois et al., 2007), the
sections were extracted from the scans, individualized, stacked in the Z direction and rigidly registered so as to obtain spatially consistent 3D volumes. Corresponding computerized procedures are now included in our in-house image processing software, BrainVISA, which can be freely downloaded from the Internet ( http://brain-visa.info/dowloadpage.html). They are collected into an add-on module package, called Brain Reconstruction and Analysis Toolbox (BrainRAT) and available for version 3.1.4 and higher (personal communication:Dubois et al., 2008a).
First applications of voxel-wise statistical analysis to post mortem data solely required the alignment of 2D autoradiographic sections into a 3D volume (Nguyen et al., 2004; Lee et al., 2005; Holschneider
Fig. 1. (A) Blockface photograph of one mouse hemisphere recorded with a digital camera. (B) The same blockface photograph, obtained after reducing thefield of view. (C) Corresponding binary image obtained after separation of the brain tissue from the embedding medium, by setting the background to zero. (D) Blockface volume, achieved by stacking the series of segmented photographs (green component obtained after RGB separation) in the Z direction. This volume is represented in three orthogonal views and as a 3D volume-rendered image.
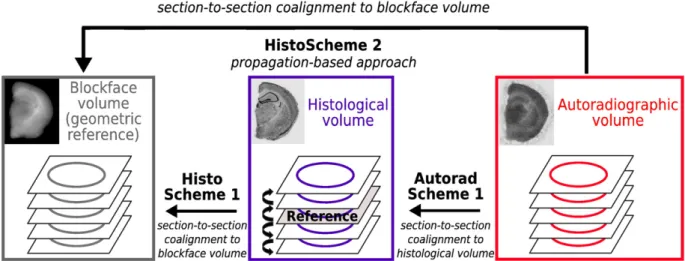
et al., 2006; Holschneider and Maarek, 2008). In our previous work (Dubois et al., 2008b), we better used a co-registration strategy of autoradiographic with corresponding histological sections, benefiting from greater anatomical detail provided by Nissl staining as compared to autoradiography. In the current study, we dealt with three different imaging modalities: autoradiography, histology and blockface pho-tography. We therefore proposed an original strategy for 3D reconstruction of post mortem volume images (Fig. 2), combining 1) co-registration of each histological section with its corresponding photograph from the blockface volume (HistoScheme 1) and 2) co-registration of each autoradiographic section with its corresponding registered histological section (AutoradScheme 1).
To validate this approach, we first compared the histological volume reconstructed with HistoScheme 1 to that resulting from the registration of each histological section with a reference one in the stack, using a propagation-based approach as described by (Dubois et al., 2007) (HistoScheme 2). The consistency of each 3D-reconstructed histological volume was assessed by visual inspection of internal structures viewed in different orthogonal incidences and by visual inspection of the 3D surface renderings of the corresponding volumes. The blockface volume was used as a reference for the comparison of the two methods. We also compared the anatomo-functional superimposition obtained with AutoradScheme 1 to that derived from the co-registration of each 2D autoradiographic section with its corresponding blockface photograph from the blockface volume (AutoradScheme 2). The accuracy of anatomo-functional super-impositions was assessed by superimposing the histological volumes from the 7 hemispheres onto their corresponding autoradiographic volumes.
Lastly, the gray-scale level intensities were calibrated, using the co-exposed [14C] standard scale, and converted to activity values
(nCi/g of tissue).
Creation of a study-specific template and spatial normalization Individual 3D-reconstructed autoradiographic volumes for each right hemisphere were spatially normalized into a standardized coordinate space defined by a study-specific template of the mouse right hemisphere. Creation of such a template has been described in previous works (Nguyen et al., 2004; Lee et al., 2005; Dubois et al., 2008b). Spatial normalization was achieved by applying a 12-parameter affine transformation and then estimating non-linear deformations with a linear combination of 3D discrete cosine transform basis functions (Ashburner and Friston, 1999). Spatially
normalized hemispheres from all seven mice were then individually smoothed with a Gaussian kernel (FWHM = 3 times the voxel dimensions) for further processing. Given the voxel dimensions, 21 × 21 ×80 µm3, thefinal spatial resolution of the smoothed images
was 63 × 63 × 240 µm3, which was compatible with estimate of
misregistration error and anatomic variability (Nguyen et al., 2004). The template of the mouse right hemisphere was created and spatial normalization was carried out with the SPM5 software package (http://www.fil.ion.ucl.ac.uk/spm/).
In a previous study (Dubois et al., 2008b), we compared two spatial normalization techniques based on a histological or autora-diographic template. We found that histological template-based method did not provide accurate spatial normalizations and failed to reach the high level of spatial specificity obtained with autoradio-graphic template-based method. The autoradioautoradio-graphic template was therefore more appropriate for spatial normalization than the histological template. In the present study, we also compared the autoradiographic template-based method with a blockface photo-graphic template-based method. With the blockface template, deformation parameters were calculated entirely from a photographic template and then applied to the corresponding autoradiographic volume images. The accuracy of the spatial normalization techniques based on photographic and autoradiographic templates was assessed by calculating voxel-by-voxel mean and standard deviation images of spatially normalized autoradiographic volumes from PS1 and APP/ PS1 hemispheres, separately (Ashburner and Friston, 1999). Statistical design and analysis in SPM
Overall differences in the absolute amount of radiotracer delivered to the brain were beforehand adjusted in each animal by scaling the voxel intensities so that the mean intensity for all seven hemispheres studied was the same. Regional differences in cerebral glucose uptake between APP/PS1 and PS1 transgenic mice were then assessed with SPM5 software. We subtracted the background and excluded the lateral ventricle from the analysis and performed the SPM5 two-sample t-test. Two contrasts were evaluated separately, making it possible to produce two statistical parametric maps: maps showing voxels of lower intensity in APP/PS1 than in PS1 mice (lower levels of glucose uptake in APP/PS1 than in PS1 mice) and maps displaying voxels of higher intensity in APP/PS1 than in PS1 animals (higher levels of glucose uptake in APP/PS1 than in PS1 mice). As in previous studies, we considered Pb0.01 (uncorrected for multiple compar-isons) to indicate statistical significance for individual voxels within
clusters of contiguous voxels, and we used a minimum cluster size of 1500 contiguous voxels, amounting to∼0.05 mm3, with a resolution
of 21 × 21 × 80 µm3. We then evaluated the location of signi
ficant voxels within the whole hemisphere and the significance of clusters of contiguous voxels exceeding the minimum cluster size. The Marsbar toolbox included in SPM5 (Brett et al., 2003) was used to calculate the mean intensity (i.e., activity) for each cluster. Brain regions were identified with an anatomical atlas of the mouse brain (Paxinos and Franklin, 2001).
The impact of the two spatial normalization techniques on the voxel-wise statistical analysis was also evaluated. For each contrast, the set of results obtained with the photographic template-based normalization method was compared with those obtained with the autoradiographic template.
Results
Cerebral Aβ deposition
Congo red staining revealed numerous Aβ deposits in the left hemispheres of APP/PS1 mice (Fig. 3A). Amyloid deposits were mostly observed in iso- and archicortical (hippocampus) brain areas and in certain subcortical regions (e.g., thalamus, septal nuclei,
amygdala, accumbens nucleus), as previously shown (Blanchard et al., 2003; Delatour et al., 2006). Within the hippocampus, plaques were limited to the outer and inner part of the molecular layer of the dentate gyrus and the stratum lacunosum moleculare of CA1. PS1 animals had no amyloid deposits, as expected (Fig. 3B).
Data acquisition and 3D reconstruction of blockface, autoradiographic and histological post mortem volumes
For each series of blockface photographs, the automatic segmen-tation successfully separated the brain tissue from the embedding medium, making it possible to remove background from images. For each mouse, a spatially consistent 3D blockface volume was obtained by directly stacking the series of photographs. No registration was required due to reproducible positioning of the tissue in the cutting plane before the cutting of each section.
The evaluation of the consistency of each 3D-reconstructed histological volume demonstrated that, globally, HistoScheme 1 was more reliable than HistoScheme 2. Indeed, the discontinuities between consecutive histological sections, due to possible registration errors, were greater with HistoScheme 2 than with HistoScheme 1 (black arrows inFigs. 4A and C). In addition, the overall shape and geometry of the histological volume reconstructed with HistoScheme 1 more closely resembled those of the blockface volume than did those obtained with HistoScheme 2 (Figs. 4B and D). As the blockface volume was regarded as a consistent 3D geometric reference, closely resembling the original geometry in vivo, HistoScheme 1 was therefore considered to ensure greater intra-volume consistency in the 3D-reconstructed histological volume than HistoScheme 2. Nevertheless, the histological volume reconstructed with His-toScheme 2 presented a slightly higher definition and morphological accuracy of inner structures, including the striatum (CPu), the corpus callosum (cc) and the hippocampus (Hp).
The evaluation of the quality of anatomo-functional superimposi-tions showed AutoradScheme 1 to be more reliable than Auto-radScheme 2. Indeed, with AutoAuto-radScheme 1, the external contours (Ext) and the outer edges of the cortex (OutCx), subcortical structures (e.g., corpus callosum (cc)) and Aβ plaque-like deposits (Aβ) in the histological volume (Figs. 5A, B and C) were correctly superimposed onto the same areas in the corresponding autoradiographic volume (Figs. 5D and F). By contrast, AutoradScheme 2 led to misregistrations and incorrect superimpositions in some cases, resulting in lower inter-volume consistency (Figs. 5E and G).
Thus, the best global strategy for the 3D reconstruction of both histological and autoradiographic volumes from all seven mice was our proposed approach i.e. combining HistoScheme 1 and Auto-radScheme 1.
Spatial normalization: comparison of photographic and functional templates
The two different spatial normalization techniques based on photographic and autoradiographic templates were compared (Fig. 6A) and shown to provide similar results for both PS1 and APP/PS1 hemispheres (Figs. 6B and C, respectively). Indeed, the mean images obtained with both template-based normalization methods displayed similar levels of contrast for the various structures in the brain of PS1 or APP/PS1 mice. Sharpness and the consistency of contours for the various structures were equivalent in all cases, regardless of the method used. The standard deviation images from PS1 or APP/PS1 mice showed similar values, demonstrating that the intensity differences between normalized hemispheres were similar. However, differences at the outer edges of the cortex appeared to be less marked with the autoradiographic template than with the photographic method. Another comparison involved superimposition of the edge contours calculated from the normalized reference
Fig. 3. Coronal antero-posterior Congo red-stained sections from left hemisphere of one APP/PS1 (A) and one PS1 (B) mice. Note the high density of Aβ deposits in iso- and archicortical brain areas (isoCx), accumbens nucleus (Acb), septal nuclei (S), hippocampus, thalamus (Th) and amygdala (Amg). In the hippocampus, plaques are limited to the outer and inner parts of the molecular layer of the dentate gyrus (DG) and stratum lacunosum moleculare of CA1 (CA1). PS1 animals did not show any amyloid deposits.
hemisphere used to generate both the photographic and autoradio-graphic templates onto the spatially normalized autoradioautoradio-graphic data from individual mice (Fig. 6C). The photographic template-based normalization method led to slight misregistrations of the outer edges of the cortex. However, with both template-based normalization methods, the edges defining the subcortical structures, such as the striatum, thalamus and inner edges of the cortex in the template were correctly superimposed onto the same structures in each of the 7 normalized hemispheres.
As both template-based methods appeared to be suitable for the spatial normalization of 3D-reconstructed autoradiographic volumes, we additionally compared the statistical outcome of each method in subsequent voxel-wise analysis, to determine if one or the other of these approaches performed better.
Statistical analysis
Brain regions with cluster-level significant differences in glucose uptake between APP/PS1 and PS1 transgenic mice are displayed in
Fig. 7. In thisfigure, the color-coded statistical maps of t values represent the results of the voxel-wise statistical group comparison between the 4 APP/PS1 and the 3 PS1 hemispheres, using an uncorrected P value of Pb0.01. These maps were overlaid on several coronal stained histological sections from a spatially normalized hemisphere, to facilitate the identification of brain regions. Clusters of significant differences in glucose uptake between animals are also represented as 3D volume-rendered images.
Differences between statistical t maps for voxel-wise analysis with photographic and autoradiographic template-based normalization methods are summarized inTables 1 and 2. Clusters exceeding the threshold and displaying a significant difference in glucose uptake between animals were obtained within the same anatomical brain structures with both templates. They also had similar P values and covered a similar area. Limited differences in the detection sensitivity and morphology terms were found between the two normalization methods. Hence, neither the assessment of accuracy nor the statistical outcome of the two different spatial normalization techniques in subsequent voxel-wise analysis was sufficiently discriminating to
Fig. 4. Evaluation of the two methods for 3D reconstruction of the histological volume. Histological volume and corresponding 3D surface rendering in horizontal (A and B) and sagittal (C and D) views obtained from one mouse hemisphere by co-registering each histological section with its corresponding photograph from the blockface volume (HistoScheme 1; middle panel) or by registering each histological section with a reference section in the stack, using a propagative approach, as described by citetDubois07a (HistoScheme 2; right panel). The blockface volume from the same animal and its corresponding 3D surface rendering are displayed in the same view and used as a reference for the comparison of the two methods (left panel). cc: corpus callosum, Hp: hippocampus and CPu: striatum.
identify one method as being better than the other. Given these findings, we chose to analyze further only the results obtained with the photographic template-based normalization method.
Glucose uptake levels were lower in APP/PS1 than in PS1 mice mostly within the cortical (cingulate, retrosplenial and somatosenso-ry), striatal and thalamic regions, as well as hippocampal regions (lacunosum moleculare and radial layers of the CA1 and CA3 regions). Regions of higher levels of glucose uptake were also detected in other cortex areas (piriform and perirhinal) in these mice, and in the amygdaloid, dorsal endopiriform and accumbens nuclei, the dentate gyrus and the dorsal part of the hippocampus (oriens and pyramidal cell layers of the CA1 and CA3 regions).
The differences in activity (percentage), obtained with the Marsbar toolbox from the statistical analysis are presented in Table 3. This table illustrates the low inter-individual variability in activity values for animals of a given genotype. Indeed, in APP/PS1 and PS1 mice, each region of higher or lower glucose uptake presented a coefficient of variation of less than 5%. Much greater inter-individual variability in activity values between genotypes was observed. Indeed, the percentage difference between the mean activity values in APP/ PS1 and PS1 mice, measured for all clusters of significant difference in glucose uptake detected by the statistical analysis, was about 20%. The activity in the hippocampus (the lacunosum moleculare and radial layers) of APP/PS1 mice was 24.6% lower than in PS1 mice. Activity
Fig. 5. Evaluation of the two methods for 3D reconstruction of the autoradiographic volume. (A) Nissl-stained section extracted from the histological volume of one APP/PS1 mouse hemisphere. (B) Binary image of the same section, result of a threshold operation. (C) Superimposition of (A) and (B). External contours (Ext), outer edges of the cortex (OutCx), pyramidal cell layers of the hippocampus (Py) and A-β plaque-like deposits (Aβ) are shown in white. (D) and (E) Superimposition of (B) onto the corresponding autoradiographic section. Images on the left were derived using AutoradScheme 1; those on the right were derived using AutoradScheme 2. Note the misregistrations of Ext and OutCx with AutoradScheme 2 (black and white arrows). (F) and (G) Magnification of the hippocampal and thalamic regions, showing incorrect superimpositions with AutoradScheme 2 concerning the location of the corpus callosum (cc; dark blue area) and Aβ deposits (Aβ; hyperintense red spots, arrowheads) as compared to superimposition with AutoradScheme1.
levels were 23.3% lower in the somatosensory cortex, 35.6% lower in the cingulate cortex, 26.1% lower in the retrosplenial cortex, 22.4% lower in the striatum and 28.8% lower in the thalamus. As mentioned above, the voxel-wise analysis revealed the existence of regions with significantly higher levels of glucose uptake. This uptake activity was 25.8% higher in the oriens and pyramidal cell layers of the hippocampus, 25.2% higher in the dentate gyrus, 22.9% higher in the amygdala, 33.7% higher and 20.4% higher in the dorsal endopiriform and accumbens nuclei, respectively, 21.5% higher in the piriform cortex and 19.3% higher in the perirhinal cortex.
Discussion
In this study, we evaluated the feasibility to apply our analysis method, combining computerized procedures for the acquisition and 3D reconstruction of autoradiographic volume images, spatial normalization, and voxel-wise statistical analysis (Dubois et al., 2008b) to autoradiographic data mapping brain metabolic activity in a mouse model of AD. Because mice are widely used models for
biological and medical research, demonstrating the feasibility of such an approach in mice was of prime importance. The preliminary results obtained in this pathological context highlight the likely contribution of voxel-wise analysis to assessing regional and quantitative information, to increasing knowledge about disease mechanisms and to the efficient development and exhaus-tive validation of new therapeutic approaches. This work also constitutes the first validation of such procedures for their future application to larger post mortem pathology data sets from transgenic animals.
Data acquisition and 3D reconstruction of blockface, histological and autoradiographic post mortem volumes
Acquisition of blockface photographs
Although slightly complex (positioning on the cryostat, size, need for consistent quality and highly reproducible illumination), our blockface photograph acquisition system was well-adapted to the cryostat and provided high-quality images. Our custom-made green
Fig. 6. Evaluation of spatial normalization with study-specific templates. (A) Photographic and autoradiographic templates. (B) Mean and standard deviation of spatially normalized 3D autoradiographic volume images from PS1 hemispheres. (C) Mean and standard deviation of spatially normalized 3D autoradiographic volume images from APP/PS1 hemispheres. Images on the left were derived using the photographic template; those on the right were derived using the autoradiographic template. (C) Superimposition of the contours of the normalized reference hemisphere used to generate both photographic and autoradiographic templates onto the spatially normalized hemisphere of another mouse after spatial normalization with the photographic and autoradiographic templates, respectively.
embedding matrix gave a high level of contrast between brain tissues and background, making it possible to automate segmentation of the brain in the blockface photographs. 3D consistent blockface volumes were obtained by directly stacking the photographs, as this acquisi-tion system guaranteed the direct alignment of all the images within the brain. The comprehensive procedure for processing blockface photographs has been integrated into BrainVISA and gathered in dedicated plugged-in modules. These latter are not yet available with BrainRAT package but might be part of its next release.
Nevertheless, the blockface photographs remained an intermedi-ate modality used mainly for methodology purposes since brain
tissues were unstained and blockface photographs could be acquired only remotely, with a digital camera in reflection mode. The resolution and contrast between specific brain tissues were therefore limited compared to stained histological sections. Previous works in nonhuman primates overcame some of these limitations by using a special dye injected in vivo. This dye enhanced the contrast on blockface photographs of post mortem brains (Annese et al., 2006). However, the use of such a dye would be incompatible with further quantitative [14C]-2-DG autoradiography. Indeed, it requires prior fixation of the brain tissue by perfusion with 4% paraformaldehyde solution and cryopreservation by successive immersion in graded
Fig. 7. Brain areas in which regional levels of glucose uptake were significantly lower (top panel, blue color scale) and higher (bottom panel, red color scale) in APP/PS1 hemispheres than in PS1 hemispheres. These areas are overlaid on several coronal stained histological sections issued from the spatially normalized reference mouse hemisphere. These areas are also represented as 3D volume-rendered images of the statistical t maps repositioned within the 3D volume-rendered image of the same hemisphere. Significance is indicated with t statistic color scales, corresponding to the level of significance at voxel level. Cg: cingulate cortex, CPu: striatum, RSG: retrosplenial granular cortex, Th: thalamus, S1: somatosensory cortex, Rad & LMol: radial layers and lacunosum moleculare of the CA1 and CA3 regions of the hippocampus, Acb: accumbens nucleus, Pir: piriform cortex, Amg: amygdaloid nucleus, PRh: perirhinal cortex, Or & Py: oriens and pyramidal cell layers of the CA1 and CA3 regions of the hippocampus, DG: dentate gyrus.
solutions of sucrose, which would wash out the 2DG trapped in the brain.
Use of the blockface volume as a 3D geometric reference
We observed that the use of individual photographs from the blockface volume as a reference for the reconstruction of histological volume was more reliable than our previously proposed method (Dubois et al., 2007). This latter, based on the block-matching rigid pairwise registration algorithm (Ourselin et al., 2001), has been intensively validated and is acknowledged to be the most compre-hensive registration algorithm, in the absence of a 3D geometric reference (Malandain et al., 2004; Pitiot et al., 2006; Dauguet et al., 2007). However, it has also been criticized because if an error occurs in the registration of a section with the previous section, this error will be propagated through the entire volume (Nikou et al., 2003). If the number of sections to be registered is large, an overall offset of the volume, due to error accumulation, may occur. Obviously, this issue is more pronounced when distant sections are involved in the
registration. Thus, a modification of the global shape of the 3D reconstructed volume may be observed. Moreover, in the absence of a 3D geometric reference, a rigid pairwise registration of 2D sections does not provide a volume with the real geometry of the object under study (i.e., the brain after extraction from the skull but before sectioning and staining). Indeed, another major difficulty in the reconstruction of a 3D volume from 2D sections comes from the so-called“banana problem”: a curved 3D object cannot be reconstructed from cross-sections in the absence of additional information ( Strei-cher et al., 1997; Malandain et al., 2004). By providing additional information about the real geometry of the object under study, the co-alignment of the 2D histological sections with the corresponding blockface photographs made it possible to preserve the 3D curvature of the post mortem brain, thereby overcoming the“banana problem”. We also showed that a propagation-based approach was locally more reliable than the use of individual photographs from the blockface volume as a reference for the reconstruction of histological volume. Indeed, the contrast between specific brain tissues and resolution of Nissl-stained histological sections were higher as compared to blockface photographs. Nissl-stained sections provide greater anatomical detail than blockface photographs, hence allowing their locally more accurate matching on consecutive sections. However, the differences were really subtle and mainly located in strongly contrasting structures, which did not justify ignoring the value of blockface photographs for preserving the 3D curvature of the post mortem brain.
Anatomy as a reference for the 3D reconstruction of autoradiographic data sets
The use of the histological volume as a reference for the reconstruction of the autoradiographic volume provided thefinest section-by-section superimpositions of histological and autoradio-graphic volumes, to the scale of Aβ plaques (∼100 µm in diameter), as shown in Fig. 6, thereby giving the best inter-volume consistency. Hence, the global strategy we proposed for the 3D reconstruction of histological and autoradiographic volumes optimized both intra- and inter-volume consistency as well as the use of the three imaging techniques available in this study.
The block-matching registration technique is based on both the section edges and the whole image, so the result of the 3D reconstruction depends on the type of data processed, corresponding to the information available from the sections. The independent co-registration of histological and autoradiographic sections with the corresponding blockface photographs, despite relating to the same
Table 1
Comparison of APP/PS1 and PS1 hemispheres, using the photographic template (Pb0.01 uncorrected for multiple comparisons; extent threshold=1500).
Cluster level Voxel level Brain region Pcorr Ke Punc Pcorr Punc T Ze
Areas of lower levels of glucose uptake in APP/PS1 than in PS1 mice
0.000 42,892 0.000 0.103 0.000 48.25 5.39 Hippocampus (Rad and LMol of CA1 and CA3) 0.000 55,678 0.000 0.103 0.000 35.94 5.11 Thalamus 0.000 12,495 0.000 0.103 0.000 31.35 4.98 Somatosensory cortex 0.000 4760 0.000 0.103 0.000 26.89 4.84 Striatum 0.000 22,688 0.000 0.103 0.000 26.63 4.83 Cingulate cortex 0.000 3715 0.000 0.126 0.000 16.78 4.35 Striatum 0.000 2005 0.000 0.137 0.000 14.2 4.16 Striatum 0.000 2052 0.000 0.152 0.000 12.62 4.03 Retrosplenial cortex Areas of higher levels of glucose uptake in APP/PS1 than in PS1 mice
0.000 13,127 0.000 0.438 0.000 32.64 5.02 Hippocampus (Or and Py of CA1 and CA3) 0.000 17,676 0.000 0.528 0.000 22.67 4.66 Piriform cortex 0.000 2028 0.000 0.528 0.000 19.58 4.51 Dentate gyrus 0.000 9109 0.000 0.528 0.000 18.79 4.47 Dorsal endopiriform nucleus 0.000 5153 0.000 0.528 0.000 18.45 4.45 Amygdaloid nucleus 0.000 1983 0.000 0.528 0.000 17.91 4.42 Perirhinal cortex 0.000 4135 0.000 0.528 0.000 15.24 4.24 Accumbens nucleus Table 2
Comparison of APP/PS1 and PS1 hemispheres, using the autoradiographic template (Pb0.01 uncorrected for multiple comparisons; extent threshold=1500).
Cluster level Voxel level Brain region Pcorr Ke Punc Pcorr Punc T Ze
Areas of lower levels of glucose uptake in APP/PS1 than in PS1 mice
0.000 58,218 0.000 0.128 0.000 35.71 5.11 Hippocampus (Rad and LMol of CA1 and CA3) 0.000 61,087 0.000 0.128 0.000 32.3 5.01 Thalamus 0.000 19,992 0.000 0.128 0.000 30.37 4.95 Somatosensory cortex 0.000 3161 0.000 0.128 0.000 27.08 4.84 Striatum 0.000 31,204 0.000 0.128 0.000 24.84 4.76 Cingulate and retrosplenial cortices 0.000 12,407 0.000 0.128 0.000 22.27 4.65 Striatum
Areas of higher levels of glucose uptake in APP/PS1 than in PS1 mice
0.000 18,387 0.000 0.006 0.000 96.79 5.98 Hippocampus (Or and Py of CA1 and CA3) 0.000 9110 0.000 0.166 0.000 32.48 5.02 Dorsal endopiriform nucleus 0.000 32,702 0.000 0.166 0.000 31.72 5.00 Piriform cortex 0.000 4062 0.000 0.169 0.000 26.21 4.81 Amygdaloid nucleus 0.000 3075 0.000 0.319 0.000 10.37 3.80 Dentate gyrus 0.000 1860 0.000 0.328 0.000 9.85 3.74 Perirhinal cortex Table 3
Regional 2-DG uptake values, mean ± standard deviation (nCi/g), percentage differ-ence, and associated P values between APP/PS1 and PS1 mice.
Region APP/PS1 PS1 % difference P value
Areas of lower levels of glucose uptake in APP/PS1 than in PS1 mice
Cingulate cortex 254.5 ± 12.0 345.1 ± 17.0 −35.6 b10− 3 Retrosplenial cortex 275.4 ± 2.9 347.2 ± 12.9 −26.1 0.004 Thalamus 259.6 ± 3.6 334.5 ± 11.4 −28.8 0.002 Somatosensory cortex 267.8 ± 3.2 330.2 ± 11.0 −23.3 0.004 Hippocampus (Rad and
LMol of CA1 and CA3)
241.6 ± 5.4 301.1 ± 7.0 −24.6 b10− 3 Striatum 242.9 ± 6.9 297.2±8.8 −22.4 0.001 Areas of higher levels of glucose uptake in APP/PS1 than in PS1 mice
Perirhinal cortex 271.5 ± 4.1 227.7 ± 4.2 19.3 b10− 3 Piriform cortex 303.7 ± 5.8 250.0 ± 7.3 21.5 b10− 3 Dorsal endopiriform nucleus 320.8 ± 12.5 239.9 ± 5.1 33.7 b10− 3 Accumbens nucleus 297.9 ± 4.8 247.4 ± 1.7 20.4 b10− 3 Amygdaloid nucleus 311.6 ± 11.3 253.5 ± 3.1 22.9 0.001 Dentate gyrus 238.1 ± 6.4 190.1 ± 6.4 25.2 b10− 3 Hippocampus (Or and
Py of CA1 and CA3)
physical sections, did not give identical results or perfect section-by-section anatomical and functional superimposition. By contrast, the use of the reconstructed histological volume (resulting from the registration of histological sections with the corresponding photo-graphs) as a reference for reconstruction of the functional volume ensured an identical 3D geometry for thefinal two volumes.
Thus, the best overall method for the 3D reconstruction of both histological and autoradiographic volumes combined the intrinsic spatial consistency of the blockface volume with the high-quality contrast and structural accuracy of histological information. The blockface volume and the 3D-reconstructed histological and autora-diographic volumes not only had similar geometries, but their anatomical and functional co-registration was optimal.
Spatial normalization
We previously demonstrated (Dubois et al., 2008b) that an autoradiographic template was more appropriate for spatial normal-ization (pre-requisite to voxel-wise statistical analysis) than a histological template. Here, we compared an autoradiographic to a photographic template-based spatial normalization technique.
The intensity-based approach used for the non-linear spatial normalization procedure minimizes the sum of squared differences between the images to be normalized and the template. The best procedure must provide the smallest standard deviation values. Free from potential between-group differences between PS1 and APP/PS1 mice, standard deviation images showed similar values and thus demonstrated that the intensity differences between the images and the template were equivalently reduced by the two different spatial normalization techniques. Moreover, the photographic and autora-diographic template-based methods also gave similar results in terms of its influence on the detection of functional differences between animals. However, we preferred the photographic template-based method over the autoradiographic method for two reasons. First, blockface imaging provides a consistent 3D geometric reference free from possible deformation artefacts associated with the sectioning process (displacements, torn or missing parts, folds). Non-linear transformations, such as those used in SPM5, are generally more sensitive to these artefacts, because they include larger numbers of degrees of freedom than linear transformations. Consequently, estimation of the non-linear transformations between photographic volumes and the corresponding template image should give more accurate results than estimation based on autoradiographic volumes. Second, unlike autoradiography, blockface photographs are unbiased in terms of the functional changes studied and the photographic template-based normalization method therefore prevents possible misregistrations due to differences in intensity between animals resulting from their physiological and/or pathological status or the experimental paradigm used.
Statistical analysis and biological assessments
Few studies have evaluated changes in cerebral glucose uptake in transgenic mouse models of AD. The reported studies to date have been realized by a classical ROI-based analysis of autoradiographic data. The authors observed progressive decreases in glucose uptake within some cerebral structures (Hsiao et al., 1996; Dodart et al., 1999; Niwa et al., 2002; Sadowski et al., 2004; Valla et al., 2006), including the posterior cingulate cortex in particular (Reiman et al., 2000; Valla et al., 2008). Some of them have also reported an increase in glucose uptake particularly within the cortex, the hippocampus and the striatum. However, evidence for statistically significant variations in glucose uptake was often provided after further segmentation of “meta-structures” like the hippocampal formation.
The present study is therefore the first to report changes in cerebral glucose uptake in transgenic mouse models of AD obtained
by using a fully automated whole-brain analysis without any anatomical a priori. Thus, we detected significantly lower levels of cerebral glucose uptake in APP/PS1 than PS1 mice, within the hippocampus (lacunosum moleculare and radial layers of the CA1 region), the cortex, the striatum and the thalamus. We also identified regions with significantly higher levels of cerebral glucose uptake. These regions included cortical areas, the amygdala, the dorsal endopiriform and accumbens nuclei, the dentate gyrus and the dorsal part of the hippocampus (the oriens and pyramidal cell layers of the CA1 and CA3 regions). The APP/PS1 mice we studied are known to show only slight neuronal loss, as demonstrated by comparisons with PS1 mice (Blanchard et al., 2003). However, these mice have been reported to display changes in behavior (Cudennec et al., 2008). Our results highlight a complex pattern of decreases and increases in glucose uptake in various brain areas, which might account for some of the behavioral changes in these animals. These findings are consistent with the results of other studies in the APP/PS1 transgenic mouse model of AD (Sadowski et al., 2004). The precise cause of these changes in glucose uptake however remains to be determined. A causal relationship between the impairment of glucose utilization in APP/PS1 mice and Aβ accumulation may be suggested. Future investigations are therefore required. They could benefit from the use of neuropathology-free PS1 littermates (they do not display amyloid deposits) as controls so as to specifically assess the APP related effects of amyloid deposition on brain metabolism.
As mentioned above, individual regions of lower and higher levels of glucose uptake than for PS1 mice were concomitantly detected within the hippocampus of APP/PS1 mice (Fig. 8). To the best of our knowledge, this is thefirst report of such differences. This original result may be accounted for by conceptual differences between previous studies, based on conventional ROI analysis, and this study, based on voxel-wise analysis. Indeed, voxel-wise analysis automat-ically provides statistical between-group differences, whereas ROI-based analysis is dependent on the subjective placement of ROIs. For brain structures with irregular borders or a mosaic organization of afferent and efferent projections, it remains difficult to define ROIs accurately. This is precisely the case for the hippocampus, the complex shape of which makes it difficult to place the corresponding ROI exactly. We calculated that the regions displaying lower and
Fig. 8. (A) Clusters of significantly lower (blue) and higher (red) levels of glucose uptake in APP/PS1 than in PS1 mice, obtained within the hippocampus, are represented as 3D surface renderings. They are also repositioned within a 3D volume-rendering of the hippocampal region, manually delineated on the histological volume of the reference hemibrain, previously spatially normalized using the deformation para-meters derived from the corresponding blockface volume. The orientation of the hippocampus is indicated by (B). Rad & LMol: radial layers and lacunosum moleculare of CA1 and CA3 regions of the hippocampus, Or & Py: oriens and pyramidal cell layers of the CA1 and CA3 regions of the hippocampus and DG: dentate gyrus.
higher levels of glucose uptake within the hippocampus encompassed only 11% and 3% of the total volume of the hippocampus, respectively. Given these low percentages, some of the corresponding information might be unexploited, or even missed, in a classic ROI-based approach. Nevertheless, there are some limitations associated with the present study. First, our preliminary results are obviously severely limited by the small sample size (n = 7). Caution must be applied, as thefindings might not be extended to any population of APP/PS1 transgenic mice. However, they tend to show that voxel-wise statistical analysis may constitute a reliable alternative to classical ROI-based approaches, allowing biologists both to improve their understanding of the pathophysiology of AD and the investigation of the efficacy of new treatments. Second, methods combining data from different subjects into a common spatial referential may encounter issues related tofinal spatial resolution or image deformation. We performed analyses with different smoothing extents (isotropic and anisotropic Gaussian kernel widths) and found no major differences in the location of detected clusters and their spatial extents (data not shown). As mentioned byNguyen et al. (2004), the observed cluster size depends on the intrinsic resolution of the data and the inter-section spacing. Thus, interpretation of clusters is based on neuroan-atomic correlation, as adjacent regions may fuse into a single cluster. As regards image deformation, the underlying assumption in employ-ing the anatomical standardization of an individual subject image is that the intersubject anatomical variability should be within the range of the values expected by the spatial normalization algorithm. In the present study, this assumption may be unrealistic since different mouse strains are more variable than rats in brain anatomy and APP/ PS1 transgenic mice exhibit anatomical abnormalities. Indeed, as previously described (Delatour et al., 2006), aged (24 months) APP/ PS1 mice showed a moderate global brain atrophy in posterior brain regions as compared to age-matched PS1 animals. The impact of image deformation was however reduced by the use of a study-specific template, which was generated by averaging the individual images spatially normalized onto an initial target hemisphere. Thus, we minimized registration errors between the images and the template due to the possible singularity in the selected target hemisphere. Third, we reported significant results that only reached Pb0.01 uncorrected for multiple comparisons. As we pointed out (Dubois et al., 2008b), to obtain results that meet the community standards for statistical significance (Pb0.05 corrected for multiple comparisons), prior assumptions must be made to reduce the number of voxels to be compared. We are therefore currently developing a strategy for automatically defining anatomically relevant volumes of interest so that only specific subdivisions of the brain are analyzed for significant regions. Our strategy is based on the registration of an MRI-based 3D digital atlas of the mouse brain with the 3D-reconstructed post mortem data (personal communication: (Lebenberg et al., 2009). Lastly, since no young animals were studied, additional studies are needed to determine which of the reported changes in glucose uptake reflect progressive pathology, and how they are related to the time course of amyloid pathology.
Conclusion
We showed the feasibility of applying computerized procedures for the acquisition, 3D reconstruction, spatial normalization and voxel-wise statistical analysis to autoradiographic data sets mapping brain metabolic activity in a mouse model of AD. To the best of our knowledge, this work is thefirst validation study of such an approach in a mouse model of human neurodegenerative disease. Using only seven mice, we obtained preliminary results that appear to be meaningful, consistent, and more comprehensive thanfindings from previously published studies based on conventional ROI-based methods. The establishment of statistical significance at the voxel level, rather than with a user-defined ROI, made it possible to detect
subtle differences in geometrically complex regions, such as the hippocampus, more reliably. We also provided thefirst demonstration of the value of blockface photographs for the 3D reconstruction and spatial normalization of post mortem mouse brain volumes. The use of individual photographs from the blockface volume as a reference for the reconstruction of histological volume ensures greater intra-volume consistency and robustness than our previously published approach (Dubois et al., 2007). Blockface photographs are also free from possible deformation artefacts associated with the sectioning process and unbiased in terms of the functional changes studied, both facilitating the spatial normalization.
By allowing an operator-independent analysis and guaranteeing objective results, this approach might also constitute a standardized method for the objective comparison of changes in cerebral glucose utilization across ages and between lines of transgenic mice. This method could be more widely used in animal models of various human neurodegenerative diseases to establish relationships be-tween histopathological features and regional brain function, to help clarify disease mechanisms, and to screen candidate treatments, guiding their selection for testing in expensive, time-consuming preclinical trials.
Acknowledgment
This work was partially supported by Medicen Paris Région, program TransAl. We would like to thank the Sanofi-Aventis Neuro-degenerative Disease Group for generously providing the transgenic animals involved in this study.
References
Annese, J., Sforza, D.M., Dubach, M., Bowden, D., Toga, A.W., 2006. Postmortem high-resolution 3-dimensional imaging of the primate brain: blockface imaging of perfusion stained tissue. Neuroimage 30 (1), 61–69.
Ashburner, J., Friston, K.J., 1999. Nonlinear spatial normalization using basis functions. Hum. Brain Mapp. 7 (4), 254–266.
Blanchard, V., Moussaoui, S., Czech, C., Touchet, N., Bonici, B., Planche, M., Canton, T., Jedidi, I., Gohin, M., Wirths, O., Bayer, T.A., Langui, D., Duyckaerts, C., Tremp, G., Pradier, L., 2003. Time sequence of maturation of dystrophic neurites associated with Abeta deposits in APP/PS1 transgenic mice. Exp. Neurol. 184 (1), 247–263. Brett, M., Valabregue, R., Poline, J.-B., 2003. Region of interest analysis using an SPM
toolbox (abstract). Neuroimage 16 ((Suppl.) (CD-ROM)).
Cudennec, C.L., Faure, A., Ly, M., Delatour, B., 2008. One-year longitudinal evaluation of sensorimotor functions in APP751SL transgenic mice. Genes Brain Behav. 7 (Suppl 1), 83–91.
Dauguet, J., Delzescaux, T., Condé, F., Mangin, J.-F., Ayache, N., Hantraye, P., Frouin, V., 2007. Three-dimensional reconstruction of stained histological slices and 3D non-linear registration with in-vivo MRI for whole baboon brain. J. Neurosci. Methods 164 (1), 191–204.
Delatour, B., Guégan, M., Volk, A., Dhenain, M., 2006. In vivo MRI and histological evaluation of brain atrophy in APP/PS1 transgenic mice. Neurobiol. Aging 27 (6), 835–847.
Dhenain, M., El Tannir El Tayara, N., Wu, T.-D., Guégan, M., Volk, A., Quintana, C., Delatour, B., 2009. Characterization of in vivo MRI detectable thalamic amyloid plaques from APP/PS1 mice. Neurobiol. Aging 30 (1), 41–53.
Dodart, J.C., Mathis, C., Bales, K.R., Paul, S.M., Ungerer, A., 1999. Early regional cerebral glucose hypometabolism in transgenic mice overexpressing the V717F beta-amyloid precursor protein. Neurosci. Lett. 277 (1), 49–52.
Dubois, A., Dauguet, J., Hérard, A.-S., Besret, L., Duchesnay, E., Frouin, V., Hantraye, P., Bonvento, G., Delzescaux, T., 2007. Automated three-dimensional analysis of histological and autoradiographic rat brain sections: application to an activation study. J. Cereb. Blood Flow. Metab. 27 (10), 1742–1755.
Dubois, A., Dauguet, J., Souedet, N., Hérard, A.-S., Rivière, D., Cointepas, Y., Bonvento, G., Hantraye, P., Frouin, V., Delzescaux, T., 2008a. BrainRAT: Brain Reconstruction and Analysis Toolbox. A freely available toolbox for the 3D reconstruction of anatomo-functional brain sections in rodents. 38th Annual Meeting of the Society for Neuroscience. Washington, USA.
Dubois, A., Hérard, A.-S., Flandin, G., Duchesnay, E., Besret, L., Frouin, V., Hantraye, P., Bonvento, G., Delzescaux, T., 2008b. Quantitative validation of voxel-wise statistical analyses of autoradiographic rat brain volumes: application to unilateral visual stimulation. Neuroimage 40 (2), 482–494.
Duff, K., Eckman, C., Zehr, C., Yu, X., Prada, C.M., Perez-tur, J., Hutton, M., Buee, L., Harigaya, Y., Yager, D., Morgan, D., Gordon, M.N., Holcomb, L., Refolo, L., Zenk, B., Hardy, J., Younkin, S., 1996. Increased amyloid-beta42(43) in brains of mice expressing mutant presenilin 1. Nature 383 (6602), 710–713.
El Tannir El Tayara, N., Delatour, B., Cudennec, C.L., Guégan, M., Volk, A., Dhenain, M., 2006. Age-related evolution of amyloid burden, iron load, and MR relaxation times in a transgenic mouse model of Alzheimer's disease. Neurobiol. Dis. 22 (1), 199–208. Games, D., Adams, D., Alessandrini, R., Barbour, R., Berthelette, P., Blackwell, C., Carr, T., Clemens, J., Donaldson, T., Gillespie, F., 1995. Alzheimer-type neuropathology in transgenic mice overexpressing V717F beta-amyloid precursor protein. Nature 373 (6514), 523–527.
Goedert, M., Spillantini, M.G., 2006. A century of Alzheimer's disease. Science 314 (5800), 777–781.
Holcomb, L., Gordon, M.N., McGowan, E., Yu, X., Benkovic, S., Jantzen, P., Wright, K., Saad, I., Mueller, R., Morgan, D., Sanders, S., Zehr, C., O'Campo, K., Hardy, J., Prada, C.M., Eckman, C., Younkin, S., Hsiao, K., Duff, K., 1998. Accelerated Alzheimer-type phenotype in transgenic mice carrying both mutant amyloid precursor protein and presenilin 1 transgenes. Nat. Med. 4 (1), 97–100.
Holschneider, D.P., Maarek, J.-M.I., 2008. Brain maps on the go: functional imaging during motor challenge in animals. Methods 45 (4), 255–261.
Holschneider, D.P., Yang, J., Sadler, T.R., Nguyen, P.T., Givrad, T.K., Maarek, J.-M.I., 2006. Mapping cerebral bloodflow changes during auditory-cued conditioned fear in the nontethered, nonrestrained rat. Neuroimage 29 (4), 1344–1358.
Hsiao, K., Chapman, P., Nilsen, S., Eckman, C., Harigaya, Y., Younkin, S., Yang, F., Cole, G., 1996. Correlative memory deficits, Abeta elevation, and amyloid plaques in transgenic mice. Science 274 (5284), 99–102.
Klunk, W.E., Engler, H., Nordberg, A., Wang, Y., Blomqvist, G., Holt, D.P., Bergström, M., Savitcheva, I., Huang, G.-F., Estrada, S., Ausén, B., Debnath, M.L., Barletta, J., Price, J.C., Sandell, J., Lopresti, B.J., Wall, A., Koivisto, P., Antoni, G., Mathis, C.A., Långström, B., 2004. Imaging brain amyloid in Alzheimer's disease with Pittsburgh Compound-B. Ann. Neurol. 55 (3), 306–319.
Lebenberg, J., Hérard, A.-S., Dubois, A., Dhenain, M., Hantraye, P., Frouin, V., Delzescaux, T., 2009. Segmentation of anatomo-functional 3D post mortem data using a MRI-based 3D digital atlas: transgenic mouse brains study. The Sixth IEEE International Symposium on Biomedical Imaging. Boston, USA.
Lee, J., Ahn, S.-H., Lee, D., Oh, S., Kim, C., Jeong, J., Park, K., Chung, J.-K., Lee, M., 2005. Voxel-based statistical analysis of cerebral glucose metabolism in the rat cortical deafness model by 3D reconstruction of brain from autoradiographic images. Eur. J. Nucl. Med. Mol. Imaging 32 (6), 696–701.
Malandain, G., Bardinet, E., Nelissen, K., Vanduffel, W., 2004. Fusion of autoradiographs with an MR volume using 2-D and 3-D linear transformations. NeuroImage 23 (1), 111–127.
Minoshima, S., Giordani, B., Berent, S., Frey, K.A., Foster, N.L., Kuhl, D.E., 1997. Metabolic reduction in the posterior cingulate cortex in very early Alzheimer's disease. Ann. Neurol. 42 (1), 85–94.
Nguyen, P., Holschneider, D., Maarek, J., Yang, J., Mandelkern, M., 2004. Statistical parametric mapping applied to an autoradiographic study of cerebral activation during treadmill walking in rats. NeuroImage 23 (1), 252–259.
Nikou, C., Heitz, F., Nehlig, A., Namer, I., Armspach, J., 2003. A robust statistics-based global energy function for the alignment of serially acquired autoradiographic sections. J. Neurosci. Methods 124 (1), 93–102.
Niwa, K., Kazama, K., Younkin, S.G., Carlson, G.A., Iadecola, C., 2002. Alterations in cerebral bloodflow and glucose utilization in mice overexpressing the amyloid precursor protein. Neurobiol. Dis. 9 (1), 61–68.
Ourselin, S., Roche, A., Subsol, G., Pennec, X., Ayache, N., 2001. Reconstructing a 3D structure from serial histological sections. Image Vis. Comput. 19 (1–2), 25–31. Paxinos, G., Franklin, K., 2001. The Mouse Brain in Stereotaxic Coordinates. Academic
Press, San Diego, CL.
Pitiot, A., Bardinet, E., Thompson, P.M., Malandain, G., 2006. Piecewise affine registration of biological images for volume reconstruction. Med. Image Anal. 10 (3), 465–483.
Reiman, E.M., Caselli, R.J., Yun, L.S., Chen, K., Bandy, D., Minoshima, S., Thibodeau, S.N., Osborne, D., 1996. Preclinical evidence of Alzheimer's disease in persons homo-zygous for the epsilon 4 allele for apolipoprotein E. N. Engl. J. Med. 334 (12), 752–758.
Reiman, E.M., Uecker, A., Gonzalez-Lima, F., Minear, D., Chen, K., Callaway, N.L., Berndt, J.D., Games, D., 2000. Tracking Alzheimer's disease in transgenic mice using fluorode-oxyglucose autoradiography. NeuroReport 11 (5), 987–991.
Sadowski, M., Pankiewicz, J., Scholtzova, H., Ji, Y., Quartermain, D., Jensen, C.H., Duff, K., Nixon, R.A., Gruen, R.J., Wisniewski, T., 2004. Amyloid-beta deposition is associated with decreased hippocampal glucose metabolism and spatial memory impairment in APP/PS1 mice. J. Neuropathol. Exp. Neurol. 63 (5), 418–428.
Shoghi-Jadid, K., Small, G.W., Agdeppa, E.D., Kepe, V., Ercoli, L.M., Siddarth, P., Read, S., Satyamurthy, N., Petric, A., Huang, S.-C., Barrio, J.R., 2002. Localization of neurofibrillary tangles and beta-amyloid plaques in the brains of living patients with Alzheimer disease. Am. J. Geriatr. Psychiatry 10 (1), 24–35.
Small, G.W., Kepe, V., Ercoli, L.M., Siddarth, P., Bookheimer, S.Y., Miller, K.J., Lavretsky, H., Burggren, A.C., Cole, G.M., Vinters, H.V., Thompson, P.M., Huang, S.-C., Satyamurthy, N., Phelps, M.E., Barrio, J.R., 2006. PET of brain amyloid and tau in mild cognitive impairment. N. Engl. J. Med. 355 (25), 2652–2663.
Streicher, J., Weninger, W.J., Müller, G.B., 1997. External marker-based automatic congruencing: a new method of 3D reconstruction from serial sections. Anat. Rec. 248 (4), 583–602.
Valla, J., Schneider, L., Reiman, E.M., 2006. Age- and transgene-related changes in regional cerebral metabolism in PSAPP mice. Brain Res. 1116 (1), 194–200. Valla, J., Gonzalez-Lima, F., Reiman, E.M., 2008. FDG autoradiography reveals
developmental and pathological effects of mutant amyloid in PDAPP transgenic mice. Int. J. Dev. Neurosci. 26 (3–4), 253–258.
Wirths, O., Multhaup, G., Czech, C., Blanchard, V., Moussaoui, S., Tremp, G., Pradier, L., Beyreuther, K., Bayer, T.A., 2001. Intraneuronal Abeta accumulation precedes plaque formation in beta-amyloid precursor protein and presenilin-1 double-transgenic mice. Neurosci. Lett. 306 (1–2), 116–120.