HAL Id: hal-02284266
https://hal.uca.fr/hal-02284266
Submitted on 13 Nov 2020
HAL is a multi-disciplinary open access archive for the deposit and dissemination of sci-entific research documents, whether they are pub-lished or not. The documents may come from teaching and research institutions in France or abroad, or from public or private research centers.
L’archive ouverte pluridisciplinaire HAL, est destinée au dépôt et à la diffusion de documents scientifiques de niveau recherche, publiés ou non, émanant des établissements d’enseignement et de recherche français ou étrangers, des laboratoires publics ou privés.
Thermal Conductivity of FeS and Its Implications for
Mercury’s Long-Sustaining Magnetic Field
Geeth Manthilake, J. Chantel, J. Monteux, Denis Andrault, Mohamed Ali
Bouhifd, Nathalie Bolfan-Casanova, E. Boulard, N. Guignot, A. King, J. Itié
To cite this version:
Geeth Manthilake, J. Chantel, J. Monteux, Denis Andrault, Mohamed Ali Bouhifd, et al.. Ther-mal Conductivity of FeS and Its Implications for Mercury’s Long-Sustaining Magnetic Field. Journal of Geophysical Research. Planets, Wiley-Blackwell, 2019, 124 (9), pp.2359 - 2368. �10.1029/2019JE005979�. �hal-02284266�
This article has been accepted for publication and undergone full peer review but has not been through the copyediting, typesetting, pagination and proofreading process which may
Manthilake Geeth (Orcid ID: 0000-0001-8161-081X)
Monteux Julien (Orcid ID: 0000-0002-1059-6165)
Boulard Eglantine (Orcid ID: 0000-0003-2865-6098)
Thermal conductivity of FeS and its implications for Mercury’s long sustaining
magnetic field
G. Manthilake1*, J. Chantel2, J. Monteux1, D. Andrault1,M.A. Bouhifd1, N. Bolfan
Casanova1, E. Boulard3, N. Guignot3, A. King3, J.P. Itie3
1. Laboratoire Magmas et Volcans, Université Clermont Auvergne, CNRS, IRD, OPGC,
63000 Clermont-Ferrand, France.
2.
Unite Matériaux et Transformations, CNRS, Université de Lille, 59655 Villeneuve d’Ascq, France.
3. Synchrotron SOLEIL, 91192 Gif-sur-Yvette, France.
*Corresponding author: G. Manthilake (geeth.manthilake@uca.fr)
Key points
Incorporation of S significantly reduces both electrical and thermal conductivities of FeS.
The low thermal conductivity of FeS may have prevented the Mercurian core from rapid solidification.
Abstract
The MESSENGER mission revealed that Mercury’s magnetic field might have
operated since 3.7-3.9 Ga. While the intrinsic magnetism suggests an active dynamo
within Mercury’s core, mechanism that is responsible for sustaining the dynamo for
prolonged period of time remains unknown. Here we investigate the electrical
conductivities of Fe-S alloys at pressure of 8 GPa and temperatures up to 1700 K. We
show that the electrical conductivity of Fe-S alloys at 1500 K is about 103 S/m, two
orders of magnitude lower than the previously assumed value for dynamo calculations.
The thermal conductivity was estimated using the Wiedemann–Franz law. The total
thermal conductivity of FeS is estimated to be ~ 4 Wm-1K-1 at the Mercurian
core-mantle boundary conditions. The low thermal conductivity suggests that a thermally
driven dynamo operating on Mercury is more likely than expected. If coupled with
chemical buoyancy sources, it is possible to sustain an intrinsic dynamo during
timescales compatible with the MESSENGER observations.
Plain language summary
Mercury's weak magnetic field intensity that persisted over the last 3.9 billion years has long baffled the planetary science community. Various explanations have been proposed; nevertheless, there has been no consensus on how the intrinsic dynamo with such weak energetics exists in Mercury for prolonged period. In our submitted manuscript, we exclusively looked at the electrical and thermal conductivity in Fe-S alloys, the dominant phase in Planet Mercury's outer core. Our results indicate that electrical conductivity of Fe-S alloys is two orders of magnitude lower than the previously assumed value for dynamo calculations. The low thermal conductivity obtained in this study suggests that the heat extraction from Mercury's core through the solid Fe-S layer is a highly inefficient process. Our estimations suggest the heat-flux from the core only produces less than 1 TW of energy. The low heat flux prevents the Mercurian core from rapid solidification, sustaining an intrinsic dynamo in Mercury since ~3.9 Ga.
1. Introduction
The planet Mercury currently exhibits a surface magnetic field with a field strength
representing 1.1% that of the Earth's magnetic field (Anderson et al., 2011). The spin-aligned
axisymmetric and offset dipole-dominated field is considered unique among planetary
magnetic fields (Tian, Zuber, & Stanley, 2015). The low-altitude magnetic field
measurements by the MESSENGER mission have revealed a remnant magnetization in Mercury’s crust with age of magnetization in the range of 3.7-3.9 Ga (Johnson et al., 2015).
The presence of a magnetic field in the early in Mercury’s history as early as 3.9 Ga and the
extremely weak magnetic field strengths in present day Mercury may suggest that Mercury’s
magnetic field may have been active for the last 3.7-3.9 Ga. While the observed intrinsic
magnetism suggests an active dynamo generated in Mercury’s liquid outer core, how Mercury’s magnetic field sustained for a prolonged period of time remains puzzling even in
the light of our current understanding of the Earth and planetary dynamos (Johnson et al.,
2015).
It has been suggested that Mercury‘s dynamo is currently generated by chemical
convection (Breuer, Rueckriemen, & Spohn, 2015; Cao et al., 2014; Chen, Li, & Hauck,
2008; Dumberry & Rivoldini, 2015). The low magnetic field intensity of planet Mercury has
been discussed using thermoelectric (D. J. Stevenson, 1987), thin shell (Stanley, Bloxham,
Hutchison, & Zuber, 2005), thick shell (Heimpel, Aurnou, Al-Shamali, & Gomez Perez,
2005) and feedback (Glassmeier, Auster, & Motschmann, 2007) dynamo models. Recent
dynamo studies linked the low intensity and the axisymmetry of the magnetic field to a stably
stratified layer with latitudinal heat-flux variations (Ulrich R. Christensen & Wicht, 2008;
Ulrich R Christensen, 2006; Schubert, Chan, Liao, & Zhang, 2004; Tian et al., 2015).
The chemical composition and the internal structure of Mercury remain poorly
Padovan, & Peale, 2018). Mercury’s solid outer shell overlying the liquid core is estimated to
be ~ 400 km thick and believed to consist mainly of silicate minerals (Hauck et al., 2013;
Rivoldini & Van Hoolst, 2013). Recent gravity field analyses indicate that Mercury’s internal
structure consists of an Fe-S-Si liquid outer core (Chabot, Wollack, Klima, & Minitti, 2014;
Hauck et al., 2013; Knibbe & van Westrenen, 2015; Margot et al., 2018; Rivoldini & Van
Hoolst, 2013; D. E. Smith et al., 2012). A substantial number of studies have considered S
and Si as principal alloying element in the liquid outer core (Chabot et al., 2014; Hauck et al.,
2013; Malavergne, Toplis, Berthet, & Jones, 2010; Namur, Charlier, Holtz, Cartier, &
McCammon, 2016; Rivoldini, Van Hoolst, & Verhoeven, 2009; Schubert, Ross, Stevenson,
& Spohn, 1988; David J. Stevenson, Spohn, & Schubert, 1983). The presence of an inner
core in Mercury has been debated (Margot et al., 2018). The Mercury interior models also
suggest the presence of a solid inner core, which may have formed as a result of planetary
cooling (Veasey & Dumberry, 2011). Recent estimations indicate that the diameter of the
solid inner core would be 0.3-0.7 of the diameter of Mercury’s core (Genova et al., 2019) .
The elemental composition analyses during the MESSENGER mission indicate 1-4 wt. % of Fe and S in Mercury’s surface (Evans et al., 2012; Nittler et al., 2011). The high S
abundance in the Mercury’s mantle and coupled with low surface abundance of Fe suggests
Mercury may have formed from highly reduced CB chondrites (Namur et al., 2016). The
recent based on S solubility in reduced mafic silicate melts suggest 7-11 wt.% S in the
mantle and < 1.5 wt.5 S in the metallic inner core for a bulk S contents of 4 wt. % in Mercury
(Namur et al., 2016). Similarly, metal-silicate partitioning experiments indicate that decrease
of S contents in the core when Si contents increases (Chabot et al., 2014). These experimental
results indicate that Mercury’s core must contain Si if the S contents in the core is < 20 wt.%.
If Si contents in the core would be > 10 wt.%, the S contents in the core should be < 2 wt.%
The unusual feature in Mercury’s internal structure models is the possibility of a solid
FeS layer at the core-mantle boundary (D. E. Smith et al., 2012). The higher bulk density observed for Mercury’s outer shell appears to be compatible with a silicate mantle with FeS
layer with a thickness of ~ 90 km (Hauck et al., 2013; Namur et al., 2016). The immiscibility
of Fe-S and Fe-Si liquids in the Fe-S-Si ternary system would result segregation of Fe-S
liquids from Fe-S-Si ternary system when the pressure is below 15 GPa (Morard & Katsura,
2010; Sanloup & Fei, 2004). The S contents up to 4 wt.% in silicate appear to fall within the
liquid- liquid immiscibility field of Fe-S-Si system at the Mercury core mantle boundary
(CMB) pressure (Chabot et al., 2014; Namur et al., 2016). The origin of a FeS layer can be
explained by the crystallization of FeS in binary Fe-FeS system from the segregated S rich
Fe liquids (Fei, Bertka, & Finger, 1997; Hauck et al., 2013). Due to the density contrast in
solid FeS in Fe-S-Si liquid, the crystalized FeS is expected to float, forming a stable layer
beneath the silicate mantle (Hauck et al., 2013). The possibility of a liquid FeS rich layer
overlying Fe-S-Si core has also been discussed in a recent study (Pommier, Leinenweber, &
Tran, 2019). In this model, an insulating liquid FeS layer with the thickness > 40 km is
expected to control the heat-flow from the core influencing the generation and the sustainability of mercury’s magnetic field (Pommier et al., 2019).
While a solid FeS layer at the CMB has been an important feature in Mercury’s
interior models, a number of recent studies have supported the low S contents or S absent
conditions in Mercury’s core, thereby questioning the stability of FeS later at the CMB
(Chabot et al., 2014; Genova et al., 2019; Knibbe & van Westrenen, 2018; Margot et al.,
2018). The silicate-metal partitioning experiments (Chabot et al., 2014) suggest S-free
conditions, if the Si contents exceeds 25 wt.% in the Mercury’s core. However, such extreme
partitioning of Si into the core would alter the major element ratios in the silicate mantle.
2015) reported higher density for FeS compared to the residual liquids, requiring a separate
mechanism to stabilize a FeS layer at the base of Mercury’s mantle. The recent geodetic
constrains indicate a slightly higher value for gravitational potential Love number than
previous estimations, supporting for a warm and weak mantle rather than rigid FeS late at Mercury’s CMB (Genova et al., 2019).
The presence of solidified FeS layer the boundary between Mercury’s liquid outer
core and solid silicate mantle is assumed, this could have significant implications for the core
dynamics. It has been suggested that the weak magnetic field strength observed for Mercury
can be explained by the presence of conductive layer overlying the convective liquid
outer-core (Ulrich R Christensen, 2006). Due to the stratification of the liquid outer-core, the convection
driven dynamo operates only at deep part of the liquid core and the dynamo field may
diffuses through the overlying conductive layers producing weak magnetic field strengths
(Ulrich R Christensen, 2006). The heat flow across the CMB controls the solidification of the
liquid core and the buoyancy sources available to generate a planetary dynamo (B. Buffett,
2003). The electrical and thermal conductivities of Fe-S compounds are therefore key
physical properties to understand Mercury’s core dynamics. In this study, we investigate the
electrical and thermal conductivities of Fe-S alloys at high pressure and temperature, the principal constituent of Mercury’s core-mantle boundary, with the aim of understanding the
influence of Fe-S layer on the heat extraction from Mercury’s core. We discuss how the outer
core composition evolution influences the heat extraction from the core of Mercury and favor
an intrinsic dynamo driven by thermal and chemical buoyancy forces and sustained for a
2. Methods
Three different FeSx samples with varying sulfur contents (x, in mol) 0.01, 0.02 and
0.05 were prepared mixing reagent grade Fe and S powders. For the FeS (x=0.5) composition
we used commercially available reagent grade FeS power. The powder mixtures were
compressed to desired pressure and kept at 1000 K for more than 1 hours to obtain solid
cylindrical samples for electrical conductivity measurements in multi-anvil apparatus. The
high-pressure and high-temperature experiments were conducted at 8 GPa up to 1700 K using
the 1200-ton DIA-type multi-anvil module at the PSICHE beamline in SOLEIL Synchrotron
(France). Additional off-line experiments were performed using 1500-ton multi-anvil press at
the Laboratoire Magmas et Volcans, France. For high-pressure generation, we used an
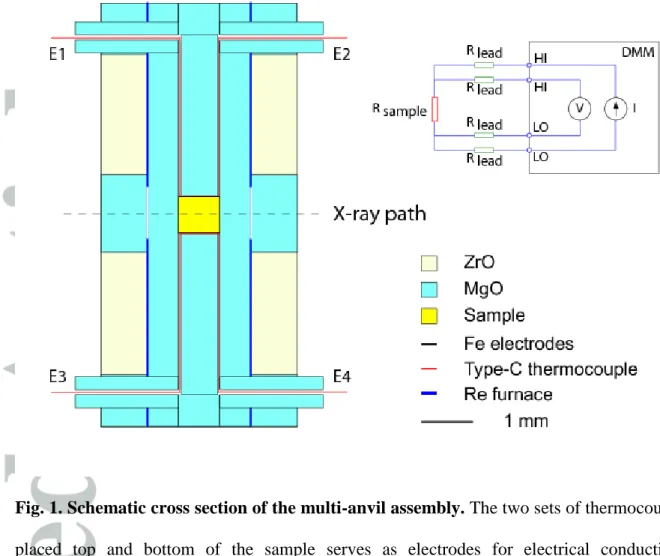
octahedral MgO+Cr2O3 pressure medium in a 10/4 multi-anvil configuration. In order to
electrically insulate the sample from the Re furnace during the measurements of electrical
conductivity, we placed the polycrystalline Fe-S samples within a MgO capsule. The two iron
(Fe) discs placed on the top and at the bottom of the cylindrical Fe-S sample served as
electrodes for electrical conductivity measurements. Sample temperature was monitored
using a tungsten-rhenium (W95Re5-W74Re26) thermocouple junction located at one end of the
sample (Fig. 1).
Energy-dispersive x-ray diffraction using a CAESAR-type diffractometer (Wang et
al., 2004) was used to determine the sample pressure and verify the sample state. We use the
pressure–volume–temperature equation of state of MgO to determine the sample pressure and
the accuracy of pressure determination is estimated to be ~0.5 GPa. Diffraction peaks
corresponding to Fe-S alloys are clearly visible in solid samples and the melting of Fe-S is
characterized by a broad band of diffuse scattering as described previously elsewhere
(Andrault et al., 2018). We also acquired radiographic images of the sample to determine the
each temperature. The focused beam configuration used in these experiments has the
advantage to produce almost flat field corrected images, a feature usually not available when
using multi-anvil modules (Andrault et al., 2018).
The electrical conductivity measurements were performed using the Kelvin resistance
measurement technique (e.g. Deng, Seagle, Fei, & Shahar, 2013). In this method, the digital
multi-meter measured the current going through the subject and the voltage drop across it,
eliminating the lead and contact resistance from the measurement (Fig 1). This is an
advantage for precise measurement of sample with low resistance values such as metals. The
electrical conductivity at each temperature can be calculated using the sample dimensions obtained using the X ray radiograph using, 𝜎 = 𝑙 𝑅𝐴⁄ where σ is the electrical conductivity, l is the sample length, R is the measured sample resistance and A is the area of the cylindrical
cross section. The temperature dependence of the electrical conductivity σ can be described by the Arrhenius equation: 𝜎 = 𝜎0𝑒−∆𝐻 𝑘𝑇⁄ , where σ0 is the pre-exponential factor, ΔH is the
activation enthalpy in eV, k is the Boltzmann constant in eV/K, and T is absolute temperature
in K.
Thermal conductivity of Fe-S alloys was estimated using the Wiedemann–Franz law 𝜅 = 𝐿0𝜎𝑇, an empirical law expressing the thermal conductivity (k) as a function of the
electrical conductivity of a metal (σ) and the temperature (T) through a proportionality
constant Lorenz ratio (L). The Lorenz ratio approaches the Sommerfeld derivation L0,
2.44×10⁻⁸ WK-2 provided the thermal conductivity is purely electronic, the electron gas is
highly degenerate and the relaxation time is same for electrical and thermal conduction
(Klemens, 1989). The deviation of the Lorenz ratio has been observed for Fe alloys (de
Koker, Steinle-Neumann, & Vlcek, 2012; Secco, 2017). In metallic alloys such as Fe-S, the
thermal transport is a complex process due to the coexistence of electron and phonon
and its phononic component (ph). In high purity metals, the electronic component dominates
the thermal conduction, however, in metallic alloys the heat conduction through phonon
vibration becomes significant (Klemens & Williams, 1986; Konôpková, McWilliams,
Gómez-Pérez, & Goncharov, 2016).
3. Results
Our findings show that the electrical conductivity of Fe-S compounds decreases with
increasing temperature characteristic to the electrical conduction in metals and metal alloys
(Fig. 2a). We observe that even a minor increase of sulfur contents reduces the electrical
conductivity of Fe-S alloys (Fig.2a). At 1000 K, the incorporation of 0.01 mol of S in Fe-S
alloys decreases the electrical conductivity by two orders of magnitude to 104 S/m compared
to pure Fe (106 S/m) (Powell, 1939). The electrical conductivity of FeS, corresponding to the
sulfur content expected at the solid layer at the Mercury’s core-mantle boundary is expected
to be about 102 S/m at 1700 K. This value is about three orders of magnitude smaller than
the value of 105 S/m used in previous dynamo models (D. J. Stevenson, 2003). A change in
activation enthalpy on melting of FeS(Fig. 2b) suggests the change of conduction mechanism
from electronic conduction in a solid to electrolytic conduction in Fes melt.
The melting of FeSis confirmed by the disappearance of peaks above 1500 K (Fig. 3),
consistent with experimentally derived Fe-S phase relations (Urakawa et al., 2004). The
electrical conductivity of molten FeS is about 102 S/m at 1700 K and remains relatively
unchanged with increasing temperature.
Our measured electrical conductivity of Fe-S compositions at 8 GPa indicate
significant lower values compared to the previously reported values for Fe-S alloys
(Pommier, 2018) (Fig. 4). While we could not determine the exact cause of the discrepancy
originated from the presence of impurities in Fe-S alloys For example, the experiments
conducted on Al and Sr doped FeS2 (Osuwa & Nwaokeorie, 2014) indicate 0.02 M
concentration of Al And Sr would increase the electrical conductivity of FeS2 by more than
factor 10. However, calculations based on first-principles electronic band structure
calculation of hcp Fe-based alloys at 40 GPa (Gomi & Yoshino, 2018) indicate Si impurity
concentrations up to 30 at. % is required to decrease the electrical conductivity by factor 100.
Another possibility for high electrical conductivity could be the partial reaction of Fe and S to
form Fe-S alloy with high Fe contents.
4. Discussion
In metallic alloys, the electrical conduction is controlled solely by the movements of
electrons, while heat is carried by both electron vibrations and phonon collisions (Klemens &
Williams, 1986). It is generally assumed that the phonon (lattice) thermal conductivity is
negligible in metals and the electronic component is determined via the Sommerfeld value of
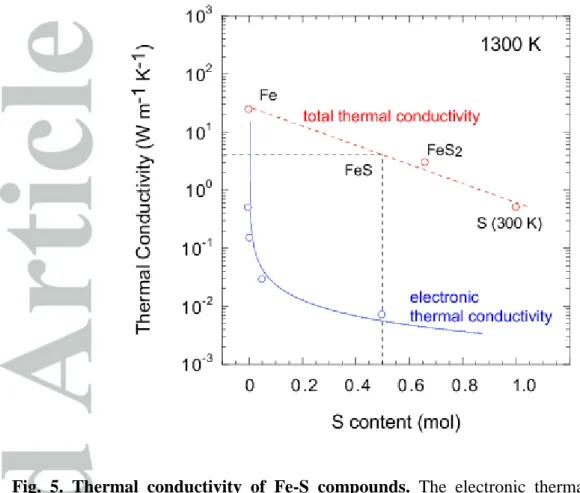
the Lorentz ratio (L0). The estimated electronic component of thermal conductivity varies
from 0.5 Wm-1K-1 for FeS0.01 to 0.006 Wm-1K-1 for FeS at 1300 K (Fig. 5). These values
represents the lower bound of the thermal conductivity for Fe-S alloys (Pommier, 2018).
In metallic alloys however, scattering of electrons by solute atoms greatly reduces the
electronic thermal conductivity, making heat transport via lattice vibrations a dominant factor
(Klemens & Williams, 1986). Thus for metallic alloys at high temperature, the thermal
conductivity is described by the Smith-Palmer equation (C. S. Smith & Palmer, 1935), 𝜅 = 𝐿0𝜎𝑇 + 𝐷, an empirical relation linking thermal conductivity to electrical conductivity via a constant D, which describes the temperature dependent phonon thermal conductivity (𝜅 = 𝐿0𝜎𝑇 + 𝐷𝑇−𝑎). Due to strong solute scattering, the phonon thermal conductivity of
1986). For example, the lattice thermal conductivity Fe-Cr-Ni alloy systems converge into a
narrow range of 4.6 – 6.0 W/m K at 1000 K (Klemens & Williams, 1986).
The lattice thermal conductivity measurements of Fe-S alloys were limited to FeS2
composition, which was reported at super-cooled conditions in the temperature range 50-300
K (Popov, Fedorov, & Kuznetsov, 2013). The thermal conductivity of FeS2 at 300 K is
estimated to be 42 ± 1 Wm-1K-1. Extrapolation of this value to high temperature based on the
theoretically predicted temperature dependence of phonon thermal conductivity of T-a
(Klemens & Williams, 1986) indicates the thermal conductivity of FeS2 at 1300 K would be
about 3.6 W/m K. In order to estimate the total thermal conductivity of FeS (electronic +
lattice), we have modeled the thermal conductivity of end member Fe-S compositions
together with data from the FeS2 system (Fig 4). The thermal conductivity of Fe was
calculated from electrical conductivity data of (Powell, 1939) Thermal conductivity of S at
300 K was obtained from (Slack, 1965). By fitting of total thermal conductivity of Fe, FeS2
and S with power law relation, we obtain thermal conductivity ~ 4 Wm-1K-1 for the FeS at
1300 K, (Fig. 5).
The temperature at the Mercury’s core mantle boundary have been investigated in
numerous previous studies (Grott, Breuer, & Laneuville, 2011; Hauck et al., 2013; Tosi,
Grott, Plesa, & Breuer, 2013). The solidification of FeS below the CMB can be expected if
the temperatures at the core mantle boundary decrease below 1700 K (Breuer et al., 2015).
We have obtained the thermal conductivity at 1300 K, close to the eutectic temperature of
Fe-FeS system at 10 GPa (Fei et al., 1997; Morard et al., 2007). Due to the weak temperature
dependence of thermal conductivity at high temperature, a significant variation to the
estimated phonon thermal conductivity could not be expected within 1200-1700 K
Based on our estimation of the thermal conductivity of 4 Wm-1K-1 assumed for FeS at
1300 K, we have computed the Mercurian core heat flow for a range of thermal boundary
layer (TBL) thicknesses and possible temperature gradients across the TBL (Hauck et al.,
2013; Rivoldini et al., 2009; Tosi et al., 2013) (Fig. 6). It is worth noting that our estimated
value for the Fe-S thermal conductivity at the CMB conditions is close to the mantle thermal
conductivity value usually assumed for Mercury’s mantle convection models (Breuer,
Labrosse, & Spohn, 2010; Tosi et al., 2013) meaning that the two reservoirs may be indistinct
in terms of thermal conductivity. We have calculated the heat flow Q based on the Fourier’s
law of thermal conduction:
𝑄 = 4𝜋𝑅𝑐2𝑘
𝑡𝑜𝑡(Δ𝑇/𝛿)
with Rc the core radius (=2000 km for Mercury), ΔT the temperature difference across
the thermal boundary layer and δ the boundary layer thickness. The estimated heat flows
computed from our thermal conductivity model indicate that the energy evacuated by core heat flow is ≈10 TW for a TBL with a thickness of 10 km and a temperature contrast of 500
K (Fig 4). The heat flow from the core is substantially reduced when increasing the TBL thickness, to ≈1 TW for a 100 km thick TBL layer.
To drive a dynamo in a terrestrial planet, three conditions are necessary (e.g.
Monteux, Jellinek, & Johnson, 2011) (1) The metallic core has to convect meaning that the
heat flow out of the core needs to overcome the adiabatic heat flow (David J. Stevenson et al.,
1983), (2) The rate of gravitational potential energy released by convection has to be much
larger than the rate of ohmic dissipation (B. A. Buffett, 2002) (3) The convective motions has
to exhibit a complex structure to carry the magnetic field lines (leading to a critical magnetic
Reynolds number) (U R Christensen & Aubert, 2006). Fig. 6 shows that the heat flow
inferred from our study is larger than the adiabatic heat flow for a wide range of temperature
process on Mercury. Low values for both thermal and electrical conductivities remain puzzling to explain Mercury’s magnetic field. In the Earth’s core, values of the thermal
conductivity range between 90 and 150 W m−1K−1 (de Koker et al., 2012; Pozzo, Davies,
Gubbins, & Alfè, 2012). Recent laboratory measurements suggested that the thermal
conductivity of polycrystalline iron at Mercury’s core conditions is 113–125 Wm−1−1 (Deng
et al., 2013). Large thermal conductivities increase the heat flux along the core adiabat and
reduce the lifetime of a thermally driven dynamo (Breuer et al., 2015). The electrical
conductivity of Fe-S at P/T conditions compatible with Mercury’s core is about two orders of
magnitude lower than for pure iron. To overcome a critical magnetic Reynolds number of 50
(Wicht et al., 2007), 20 mm/s typical flow speed is required to maintain an active dynamo for Mercury, which is about 200 times stronger than that of the Earth’s outer core. Moreover, if
sulfur is the major light element in Mercury's core and if its weak magnetic field is related to
a low electrical conductivity, our results would also suggest a very weak magnetic field for
Ganymede, which contradicts Galileo magnetometer measurements (Kivelson et al., 1996).
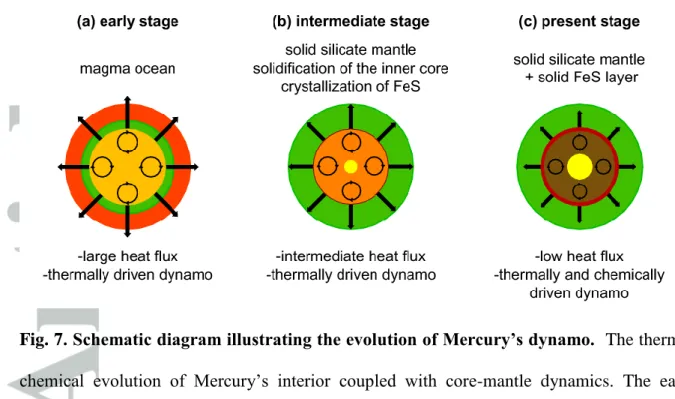
It is worth noting that the heat flux from the core is controlled by the thermal
evolution of the mantle. In the early history of Mercury, its core was likely to be liquid with
Fe alloys (Fe-S, Fe-Si) (Fig. 7a). Consequently, the thermal conductivity of the core was
large; the primitive heat was efficiently evacuated possibly enhanced by a surrounding
partially molten silicate magma ocean. In this early regime, the dynamo was only thermally
driven. Numerical models (Tosi et al., 2013) assuming a core thermal conductivity of 40 Wm
-1
K-1 indicate that a thermally driven dynamo would be feasible during the first few hundred
million years of the evolution of Mercury. The value of the thermal conductivity inferred
from our study would reduce the adiabatic core heat flux threshold for thermally driven dynamo from ≈20mW/m2
(Tosi et al., 2013) to ≈3mW/m2. According to Tosi et al. (2013), such a low threshold heat flux value could be overcome during the last ≈2 Gyr of Mercury’s
history. Our estimations (Fig.6) indicate that such heat-flux values can be achieved even with
a presence of a thin (< 1 km) FeS layer.
A low thermal conductivity within the core can enhance thermal convection by
reducing the threshold for thermally driven dynamo. In the case of a vigorous and thermally–
driven convection, a stratified outer core would be difficult to envision as well as a strong
skin-effect attenuation (Ulrich R. Christensen, Holzwarth, & Reiners, 2009). However, a low
thermal conductivity of the core combined with an overlying solid mantle would also limit
the heat evacuation and favor the formation of a stable layer below the CMB. For a thick
Fe-S layer to form and to possibly affect the magnetic field of Mercury, a complementary
process can be invoked such as the formation of FeS layer during the solidification of Mercury’s core. The growth of the inner core leads to an increase of the S concentration in
the outer core (Fig. 7b). However, for crystallization to progress, the energy barrier for the
formation of the first nucleus need to be overcome (Huguet, Van Orman, Hauck, & Willard,
2018). In the classical view, either a critical super cooling of the core of order of 1000 K or
transportation of solid metallic seeds from the mantle to the core when core reached liquidus
temperature, are possible mechanisms that may surpass the nucleation energy barrier. It has
been proposed recently that such nucleation substrates can be present in the core during the early in the Planet’s history, leading to a slower inner core growth with smaller buoyancy
flux (Huguet et al., 2018).
As the Fe-S concentration increases, the thermal conductivity of the outer core should
decrease (Pommier, 2018). The low thermal conductivity (4 Wm-1K-1) inferred from our
experiments means that dynamo action in Fe-S liquid core can be driven by thermal
convection. At present, the second source of buoyancy force is likely to be related to
chemical processes driven by crystallization in the iron rich core (Breuer et al., 2015;
dynamo can be both thermally and chemically driven (Fig. 7c). The sum of these two
processes may explain the longevity of the dynamo of Mercury. Moreover, by limiting the
amount of heat flowing from the core, the solidification of the Fe-S layer may have prevented the Mercurian core (and potentially the Ganymede’s core) from rapid solidification,
sustaining an intrinsic dynamo by buoyancy forces in Mercury for timescales larger than
1Gyr compatible with the MESSENGER mission observations.
Acknowledgements
Discussions with David Stevenson and Ulrich R. Christensen help improved the manuscript.
We thank the Editor Steven A. Hauck, II, A. Pommier and the unanimous reviewer for their
constructive comments. G.M. acknowledges funding from the French PNP program
(INSU-CNRS). This research was financed by the French Government Laboratory of Excellence
initiative n°ANR-10-LABX-0006, the Région Auvergne and the European Regional
Development Fund. This is ClerVolc contribution number xx. The authors confirm that the
raw data supporting the findings of this study are available within the article (Figures 2, 3 and
4).
References
Anderson, B. J., Johnson, C. L., Korth, H., Purucker, M. E., Winslow, R. M., Slavin, J. A., …
Zurbuchen, T. H. (2011). The Global Magnetic Field of Mercury from MESSENGER
Orbital Observations. Science, 333, 1859–1862. https://doi.org/10.1126/science.1211001
Andrault, D., Pesce, G., Manthilake, G., Monteux, J., Bolfan-Casanova, N., Chantel, J., …
Hennet, L. (2018). Deep and persistent melt layer in the Archaean mantle. Nature
Geoscience, 11, 139–143. https://doi.org/10.1038/s41561-017-0053-9
TRANSACTIONS OF THE METALLURGICAL SOCIETY OF AlME, 215(December),
909–912.
Breuer, D., Labrosse, S., & Spohn, T. (2010). Thermal evolution and magnetic field
generation in terrestrial planets and satellites. Space Science Reviews, 152(1–4), 449–
500. https://doi.org/10.1007/s11214-009-9587-5
Breuer, D., Rueckriemen, T., & Spohn, T. (2015). Iron snow, crystal floats, and inner-core
growth: modes of core solidification and implications for dynamos in terrestrial planets
and moons. Progress in Earth and Planetary Science, 2, 39.
https://doi.org/10.1186/s40645-015-0069-y
Buffett, B. (2003). The thermal state of Earth’s core. Science, 299, 1675–1677.
https://doi.org/10.1126/science.1081518
Buffett, B. A. (2002). The Thermal State of Earth ’ s Core.
Cao, H., Aurnou, J. M., Wicht, J., Dietrich, W., Soderlund, K. M., & Russell, C. T. (2014). A dynamo explanation for Mercury ’ s anomalous magnetic field, (May).
https://doi.org/10.1002/2014GL060196.Recent
Chabot, N. L., Wollack, E. A., Klima, R. L., & Minitti, M. E. (2014). Experimental
constraints on Mercury’s core composition. Earth and Planetary Science Letters, 390,
199–208. https://doi.org/10.1016/j.epsl.2014.01.004
Chen, B., Li, J., & Hauck, S. A. (2008). Non-ideal liquidus curve in the Fe-S system and Mercury’s snowing core. Geophysical Research Letters, 35(7), 10–14.
https://doi.org/10.1029/2008GL033311
Christensen, U R, & Aubert, J. (2006). Scaling properties of convection-driven dynamos in
rotating spherical shells and application to planetary magnetic fields. Geophysical
Journal International, 166, 97–114. https://doi.org/10.1111/j.1365-246X.2006.03009.x
magnetic field strength of planets and stars. Nature, 457, 167–169.
https://doi.org/10.1038/nature07626
Christensen, Ulrich R., & Wicht, J. (2008). Models of magnetic field generation in partly
stable planetary cores: Applications to Mercury and Saturn. Icarus, 196(1), 16–34.
https://doi.org/10.1016/j.icarus.2008.02.013
Christensen, Ulrich R. (2006). A deep dynamo generating Mercury’s magnetic field. Nature,
444(7122), 1056–1058. https://doi.org/10.1038/nature05342
de Koker, N., Steinle-Neumann, G., & Vlcek, V. (2012). Electrical resistivity and thermal conductivity of liquid Fe alloys at high P and T, and heat flux in Earth’s core.
Proceedings of the National Academy of Sciences, 109(11), 4070–4073.
https://doi.org/10.1073/pnas.1111841109
Deng, L., Seagle, C., Fei, Y., & Shahar, A. (2013). High pressure and temperature electrical
resistivity of iron and implications for planetary cores. Geophysical Research Letters,
40, 33–37. https://doi.org/10.1029/2012GL054347
Dumberry, M., & Rivoldini, A. (2015). Mercury’s inner core size and core-crystallization
regime. Icarus, 248, 254–268.
https://doi.org/https://doi.org/10.1016/j.icarus.2014.10.038
Evans, L. G., Peplowski, P. N., Rhodes, E. A., Lawrence, D. J., McCoy, T. J., Nittler, L. R., … Goldsten, J. O. (2012). Major-element abundances on the surface of mercury: Results
from the messenger gamma-ray spectrometer. Journal of Geophysical Research E:
Planets, 117(11), E00L07. https://doi.org/10.1029/2012JE004178
Fei, Y., Bertka, C. M., & Finger, L. W. (1997). High-pressure iron-sulfur compound Fe3S2,
and melting relations in the system Fe–FeS. Science, 275, 1621–1623.
Genova, A., Goossens, S., Mazarico, E., Lemoine, F. G., Neumann, G. A., Kuang, W., …
Geophysical Research Letters, 46(7), 3625–3633.
https://doi.org/10.1029/2018GL081135
Glassmeier, K. H., Auster, H. U., & Motschmann, U. (2007). A feedback dynamo generating Mercury’s magnetic field. Geophysical Research Letters, 34(22), 1–5.
https://doi.org/10.1029/2007GL031662
Gomi, H., & Yoshino, T. (2018). Impurity Resistivity of fcc and hcp Fe-Based Alloys :
Thermal Stratification at the Top of the Core of Super-Earths. Frontiers in Earth
Sciences, 6(217), 1–22. https://doi.org/10.3389/feart.2018.00217
Grott, M., Breuer, D., & Laneuville, M. (2011). Thermo-chemical evolution and global
contraction of mercury. Earth and Planetary Science Letters, 307(1–2), 135–146.
https://doi.org/10.1016/j.epsl.2011.04.040
Hauck, S. A., Margot, J. L., Solomon, S. C., Phillips, R. J., Johnson, C. L., Lemoine, F. G., … Zuber, M. T. (2013). The curious case of Mercury’s internal structure. Journal of
Geophysical Research E: Planets, 118(6), 1204–1220.
https://doi.org/10.1002/jgre.20091
Heimpel, M. H., Aurnou, J. M., Al-Shamali, F. M., & Gomez Perez, N. (2005). A numerical
study of dynamo action as a function of spherical shell geometry. Earth and Planetary
Science Letters, 236(1–2), 542–557. https://doi.org/10.1016/j.epsl.2005.04.032
Huguet, L., Van Orman, J. A., Hauck, S. A., & Willard, M. A. (2018). Earth’s inner core
nucleation paradox. Earth and Planetary Science Letters, 487, 9–20.
https://doi.org/10.1016/j.epsl.2018.01.018
Johnson, C. L., Phillips, R. J., Purucker, M. E., Anderson, B. J., Byrne, P. K., Denevi, B. W., … Solomon, S. C. (2015). Low-altitude magnetic field measurements by MESSENGER
reveal Mercury’s ancient crustal field. Science, 348, 892–895.
Kivelson, M. ., Khurana, K. ., Russell, C. T., Walker, R. ., Warnecke, J., Coroniti, F. ., … Schubert, G. (1996). Discovery of Ganymede’s magnetic field by the Galileo spacecraft.
Nature, 384, 537–541.
Klemens, P. G. (1989). Theory of Lorenz Ratio of Metals and Alloys. In D. P. H. Hasselman
& J. R. Thomas (Eds.), Thermal Conductivity 20 (pp. 63–69). Boston, MA: Springer US.
https://doi.org/10.1007/978-1-4613-0761-7_6
Klemens, P. G., & Williams, R. K. (1986). Thermal conductivity of metals and alloys.
International Materials Reviews, 31(5), 197–215.
https://doi.org/10.1179/095066086790324294
Knibbe, J. ., & van Westrenen, W. (2015). The interior configuration of planet Mercury
constrained by moment of inertia and planetary contraction. Journal of Geophysical
Research Planets, 120, 1904–1923. https://doi.org/10.1002/2015JD023618.Received
Knibbe, J. ., & van Westrenen, W. (2018). The thermal evolution of Mercury’s Fe–Si core.
Earth and Planetary Science Letters, 482, 147–159.
https://doi.org/10.1016/j.epsl.2017.11.006
Konôpková, Z., McWilliams, R. S., Gómez-Pérez, N., & Goncharov, A. F. (2016). Direct
measurement of thermal conductivity in solid iron at planetary core conditions. Nature,
534, 99–101. https://doi.org/10.1038/nature18009
Malavergne, V., Toplis, M. J., Berthet, S., & Jones, J. (2010). Highly reducing conditions
during core formation on Mercury: Implications for internal structure and the origin of a
magnetic field. Icarus, 206(1), 199–209. https://doi.org/10.1016/j.icarus.2009.09.001
Margot, J.-L., Hauck, S. A., Mazarico, E., Padovan, S., & Peale, S. J. (2018). Mercury’s
Internal Structure. In S. C. Solomon, B. J. Anderson, & L. . Nittler (Eds.), Mercury - The
view after MESSENGER. Cambridge University Press. Retrieved from
Monteux, J., Jellinek, A. M., & Johnson, C. L. (2011). Why might planets and moons have
early dynamos? Earth and Planetary Science Letters, 310(3–4), 349–359.
https://doi.org/10.1016/j.epsl.2011.08.014
Morard, G., & Katsura, T. (2010). Pressure-temperature cartography of Fe-S-Si immiscible
system. Geochimica et Cosmochimica Acta, 74(12), 3659–3667.
https://doi.org/10.1016/j.gca.2010.03.025
Morard, G., Sanloup, C., Fiquet, G., Mezouar, M., Rey, N., Poloni, R., & Beck, P. (2007).
Structure of eutectic Fe-FeS melts to pressures up to 17 GPa: Implications for planetary
cores. Earth and Planetary Science Letters, 263(1–2), 128–139.
https://doi.org/10.1016/j.epsl.2007.09.009
Namur, O., Charlier, B., Holtz, F., Cartier, C., & McCammon, C. (2016). Sulfur solubility in
reduced mafic silicate melts: Implications for the speciation and distribution of sulfur on
Mercury. Earth and Planetary Science Letters, 448, 102–114.
https://doi.org/10.1016/j.epsl.2016.05.024
Nittler, L. R., Starr, R. D., Weider, S. Z., McCoy, T. J., Boynton, W. V., Ebel, D. S., …
Sprague, A. L. (2011). The major-element composition of Mercury’s surface from
MESSENGER X-ray spectrometry. Science, 333(6051), 1847–1850.
https://doi.org/10.1126/science.1211567
Osuwa, J. C., & Nwaokeorie, S. E. (2014). Analysis of Structural and Electrical Properties of
Iron Sulfide (FeS2)Thin Films doped with Aluminum and Strontium impurities. IOSR
Journal of Applied Physics, 6(6), 42–46. https://doi.org/10.9790/4861-06624246
Pommier, A. (2018). Influence of sulfur on the electrical resistivity of a crystallizing core in
small terrestrial bodies. Earth and Planetary Science Letters, 496, 37–46.
https://doi.org/10.1016/j.epsl.2018.05.032
by an insulating liquid outermost core ? Earth and Planetary Science Letters, 517, 125–
134. https://doi.org/10.1016/j.epsl.2019.04.022
Popov, P. A., Fedorov, P. P., & Kuznetsov, S. V. (2013). Thermal conductivity of FeS2
pyrite crystals in the temperature range 50–300 K. Crystallography Reports, 58(2), 319–
321. https://doi.org/10.1134/s1063774513020223
Powell, R. W. (1939). Further measurements of the thermal and electrical conductivity of
iron at high temperature. Proc. Phys. Soc., 51, 407–418.
Pozzo, M., Davies, C., Gubbins, D., & Alfè, D. (2012). Thermal and electrical conductivity of iron at Earth’s core conditions. Nature, 485, 355–358.
https://doi.org/10.1016/j.epsl.2014.02.047
Rivoldini, A., & Van Hoolst, T. (2013). The interior structure of Mercury constrained by the
low-degree gravity field and the rotation of Mercury. Earth and Planetary Science
Letters, 377–378, 62–72. https://doi.org/10.1016/j.epsl.2013.07.021
Rivoldini, A., Van Hoolst, T., & Verhoeven, O. (2009). The interior structure of Mercury and
its core sulfur content. Icarus, 201(1), 12–30.
https://doi.org/10.1016/j.icarus.2008.12.020
Sanloup, C., & Fei, Y. (2004). Closure of the Fe-S-Si liquid miscibility gap at high pressure.
Physics of the Earth and Planetary Interiors, 147(1), 57–65.
https://doi.org/10.1016/j.pepi.2004.06.008
Schubert, G., Chan, K. H., Liao, X., & Zhang, K. (2004). Planetary dynamos: Effects of
electrically conducting flows overlying turbulent regions of magnetic field generation.
Icarus, 172(2), 305–315. https://doi.org/10.1016/j.icarus.2004.06.007
Schubert, G., Ross, M. ., Stevenson, D. J., & Spohn, T. (1988). Mercury’s thermal history
and the generation of its magnetic field. In F. Vilas, C. R. Chapman, & M. . Matthews
Secco, R. A. (2017). Thermal conductivity and Seebeck coefficient of Fe and Fe-Si alloys:
Implications for variable Lorenz number. Physics of the Earth and Planetary Interiors,
265, 23–34. https://doi.org/10.1016/j.pepi.2017.01.005
Slack, G. A. (1965). Thermal Conductivity of Elements with Complex Lattices:
\uppercase{B}, \uppercase{P}, \uppercase{S}. Phys. Rev., 139(2A), A507--A515.
https://doi.org/10.1103/PhysRev.139.A507
Smith, C. S., & Palmer, E. W. (1935). Thermal and electrical conductivities of copper alloys.
Transactions Of The American Institute Of Mining And Metallurgical Engineers, 117,
225–243.
Smith, D. E., Zuber, M. T., Phillips, R. J., Solomon, S. C., Hauck, S. A., Lemoine, F. G., …
Taylor, A. H. (2012). Gravity Field and Internal Structure of Mercury from
MESSENGER. Science, 336(6078), 214–217. https://doi.org/10.1126/science.1218809
Stanley, S., Bloxham, J., Hutchison, W. E., & Zuber, M. T. (2005). Thin shell dynamo
models consistent with Mercury’s weak observed magnetic field. Earth and Planetary
Science Letters, 234(1–2), 27–38. https://doi.org/10.1016/j.epsl.2005.02.040
Stevenson, D. J. (1987). Mercury’s magnetic field: a thermoelectric dynamo? Earth and
Planetary Science Letters, 82(1–2), 114–120.
https://doi.org/10.1016/0012-821X(87)90111-7
Stevenson, D. J. (2003). Planetary magnetic fields. Earth and Planetary Science Letters, 208,
1–11. https://doi.org/10.1029/GL006i003p00213
Stevenson, David J., Spohn, T., & Schubert, G. (1983). Magnetism and Thermal Evolution of
the Terrestrial Planets. Icarus, 54, 466–489.
Tian, Z., Zuber, M. T., & Stanley, S. (2015). Magnetic field modeling for Mercury using
dynamo models with a stable layer and laterally variable heat flux. Icarus, 260, 263–
Tosi, N., Grott, M., Plesa, A. C., & Breuer, D. (2013). Thermochemical evolution of
Mercury’s interior. Journal of Geophysical Research E: Planets, 118(12), 2474–2487.
https://doi.org/10.1002/jgre.20168
Urakawa, S., Someya, K., Terasaki, H., Katsura, T., Yokoshi, S., Funakoshi, K. ichi, …
Irifune, T. (2004). Phase relationships and equations of state for FeS at high pressures
temperatures and implications for the internal structure of Mars. Physics of the Earth
and Planetary Interiors, 143(1–2), 469–479. https://doi.org/10.1016/j.pepi.2003.12.015
Veasey, M., & Dumberry, M. (2011). The influence of Mercury’s inner core on its physical
libration. Icarus, 214, 265–274. https://doi.org/10.1016/j.icarus.2011.04.025
Wang, Y., Uchida, T., Von Dreele, R., Rivers, M. L., Nishiyama, N., Funakoshi, K. I., …
Kaneko, H. (2004). A new technique for angle-dispersive powder diffraction using an
energy-dispersive setup and synchrotron radiation. Journal of Applied Crystallography,
37(6), 947–956. https://doi.org/10.1107/S0021889804022502
Wicht, J., Mandea, M., Takahashi, F., Christensen, U. R., Matsushima, M., & Langlais, B. (2007). The origin of Mercury’s internal magnetic field. Space Science Reviews, 132(2–
Fig. 1. Schematic cross section of the multi-anvil assembly. The two sets of thermocouples
placed top and bottom of the sample serves as electrodes for electrical conductivity
measurements. Inset, a schematic diagram showing the electrode connections for the Kelvin
Fig. 2. Electrical conductivity of Fe-S compounds. (a) As a function of reciprocal
temperature for various sulfur contents. Note that the compositions are shown next to the
fitting lines. Previous works on electrical conductivity of iron alloys are shown for
comparison: A59 (Argyriades, Derge, & Pound, 1959); D13 (Deng et al., 2013); P18
(Pommier, 2018); P19 (Pommier et al., 2019) (b) Electrical conductivity before and after
melting of FeS. The activation enthalpy changes with melting and the electrical conductivity
Fig. 3. X-ray diffraction patterns of FeSrecorded at high temperature. (a) Evolution with
increasing temperature of the diffraction pattern for the run performed at ~8 GPa. Red and
blue dots correspond to diffraction peaks indexed based on FeS-V and Fe3O4 magnetite,
suggests presence of magnetite in the sample, which Fe3O4 could come from the unavoidable
oxidation of FeS starting material. The general drift of diffraction peaks toward low energies
is due to thermal expansion. Diffraction peaks get thinner at high temperatures due to the
release of deviatoric stresses built upon compression at 300 K. The melting of the sample
occurs between 1400 and 1500 K.(b, c, d) At 1700 K after melting of FeS at two-theta
Fig.4. Electrical conductivity as a function of sulfur content in Fe-S alloys. Electrical
conductivity decreases with increasing sulfur contents. Previous electrical conductivity data
of Fe-S alloys and Fe are shown for comparison. P18 (Pommier, 2018), A59 (Argyriades et
Fig. 5. Thermal conductivity of Fe-S compounds. The electronic thermal conductivity
estimated based on the Sommerfeld derivation of the Wiedemann–Franz law for our Fe-S
compositions are shown in blue circles. The total thermal conductivity (electronic + phonon)
of Fe, FeS2 and S are shown in red circles. The thermal conductivity of FeS was estimated to
Fig. 6. Mercury’s core-mantle boundary heat flow. The calculations are based on an
average total thermal conductivity (electron + phonon) of 4 Wm-1K-1 for FeS for diverse
thermal boundary layer thicknesses as a function of the temperature contrast across the TBL.
The adiabatic heat flow (Qad=4πRc2ktotαcgcTc/Cp) is represented with a black horizontal
dashed line (considering Rc=2000 km, αc=7E-5 K-1, gc=4 m s-2, Tc=1800 K and Cp=850 Jkg
-1
Fig. 7. Schematic diagram illustrating the evolution of Mercury’s dynamo. The
thermo-chemical evolution of Mercury’s interior coupled with core-mantle dynamics. The early
stages of Mercury core evolution (a, b) indicate largely a thermally driven dynamo in
Mercury due to high heat flux from the core. The present Mercury should have a low heat
flux due to the presence of FeS layer at the core-mantle boundary and the dynamo may be