HAL Id: hal-03035727
https://hal.umontpellier.fr/hal-03035727
Submitted on 2 Dec 2020
HAL is a multi-disciplinary open access
archive for the deposit and dissemination of
sci-entific research documents, whether they are
pub-lished or not. The documents may come from
teaching and research institutions in France or
abroad, or from public or private research centers.
L’archive ouverte pluridisciplinaire HAL, est
destinée au dépôt et à la diffusion de documents
scientifiques de niveau recherche, publiés ou non,
émanant des établissements d’enseignement et de
recherche français ou étrangers, des laboratoires
publics ou privés.
Distributed under a Creative Commons Attribution - NonCommercial - NoDerivatives| 4.0
International License
Updated site compilation of the Latin American Pollen
Database
Suzette G.A. Flantua, Henry Hooghiemstra, Eric Grimm, Hermann Behling,
Mark Bush, Catalina González-Arango, William Gosling, Marie-Pierre Ledru,
Socorro Lozano-García, Antonio Maldonado, et al.
To cite this version:
Suzette G.A. Flantua, Henry Hooghiemstra, Eric Grimm, Hermann Behling, Mark Bush, et al..
Up-dated site compilation of the Latin American Pollen Database. Review of Palaeobotany and
Palynol-ogy, Elsevier, 2015, 223, pp.104 - 115. �10.1016/j.revpalbo.2015.09.008�. �hal-03035727�
Updated site compilation of the Latin American Pollen Database
Suzette G.A. Flantua
a,⁎
, Henry Hooghiemstra
a,⁎
, Eric C. Grimm
b, Hermann Behling
c, Mark B. Bush
d,
Catalina González-Arango
e, William D. Gosling
a,f, Marie-Pierre Ledru
g, Socorro Lozano-García
h,
Antonio Maldonado
i, Aldo R. Prieto
j, Valentí Rull
k, John H. Van Boxel
aa
Institute for Biodiversity and Ecosystem Dynamics (IBED), University of Amsterdam, Science Park 904, 1098 XH Amsterdam, The Netherlands bIllinois State Museum, Research and Collections Center, 1011 East Ash Street, Springfield, IL 62703, USA
c
Georg-August-University of Göttingen, Albrecht-von-Haller-Institute for Plant Sciences, Department of Palynology and Climate Dynamics, Untere Karspüle 2, 37073, Göttingen, Germany d
Florida Institute of Technology, Department of Biology, 150 West University Blvd., Melbourne, FL 32901, USA e
Departamento de Ciencias Biológicas, Universidad los Andes, A.A. 4976 Bogotá, Colombia f
Department of Environment, Earth and Ecosystems, Center for Earth, Planetary, Space and Astronomical Research (CEPSAR), The Open University, Walton Hall, Milton Keynes MK7 6AA, UK g
Institut des Sciences de l'Evolution, ISEM (UMR 226— IRD/CNRS/UM2), Place Eugene Bataillon, CC 061, 34095 Montpellier Cedex 05, France h
Instituto de Geología, Universidad Nacional Autónoma de México, México D.F. 04520, Mexico
iCentro de Estudios Avanzados en Zonas Áridas (CEAZA), Universidad de La Serena, Casilla 599, La Serena, Chile j
Laboratorio de Paleoecología y Palinología, Facultad de Ciencias Exactas y Naturales, Universidad Nacional de Mar del Plata, 7600 Mar del Plata, Argentina k
Institute of Earth Sciences“Jaume Almera” (ICTJA-CSIC). C. Lluís Solé Sabarís s/n, 08028 Barcelona, Spain
a b s t r a c t
a r t i c l e i n f o
Article history: Received 7 July 2014
Received in revised form 9 September 2015 Accepted 20 September 2015
Available online 9 October 2015 Keywords:
Pollen analysis Latin America Site distribution patterns Age control density Publication history LAPD
The updated inventory of the Latin American Pollen Database (LAPD) offers a wide range of new insights. This paper presents a systematic compilation of palynological research in Latin America. A comprehensive inventory of publications in peer-reviewed and grey literature shows a major expansion of studies over the last decades. The inventory includes 1379 cores and sections with paleoecological data and more than 4800 modern samples from throughout the continent. Through the years, pollen datasets extend over increasing spans of time and show improved taxonomic and temporal resolution. Currently, these datasets are from 12 modern biomes and 30 countries, covering an altitudinal range of 0 to 6300 m asl. The most densely sampled regions are the Colombian Andes, the southeast coast of Brazil, and Patagonia. Underrepresented biomes are the warm temper-ate mixed forest (3%), dry forests (3%), and warm tempertemper-ate rainforest (1%); whereas steppe, tropical rainforest, and cool grass shrublands, such as the páramos, are generally well represented (allN17%). There are 126 records that span the late Pleistocene to the Last Glacial Maximum transition (21,000 cal yr BP), andN20% of the records cover the Younger Dryas interval and the Pleistocene/Holocene transition. Reanalysis of numerous sites using multiproxy tools emphasize the informative value of this approach in paleoenvironmental reconstruction. We make suggestions for several pollen sites and regions to be visited again; similarly we identify some key research questions that have yet to be answered. The updated LAPD now provides the platform to support an exciting new phase of global palynological research in which multi-site data are being integrated to address current cutting-edge research questions. The LAPD compilation of sites and the literature database will be available through the Neotoma Paleoecology Database website and a new LAPD website by the end of 2015.
© 2015 The Authors. Published by Elsevier B.V. This is an open access article under the CC BY-NC-ND license (http://creativecommons.org/licenses/by-nc-nd/4.0/).
1. Introduction
1.1. Global pollen databases
Although analyses of individual sites remain crucially important and are the basis of all integrative studies, pollen analysis is moving from an emphasis on single-site analyses to multisite integrative analyses and
the generation of spatial summaries of ecosystem dynamics (Bradshaw, 2013). Integration of multi-site and multiproxy data facilitates investiga-tion of a range of key research quesinvestiga-tions, such as response lags (Seppä and Bennett, 2003), the direction and rates of species migration and pop-ulation expansions and contractions (Blois et al., 2011), acclimation and eventual microevolutionary adaptation (Feeley et al., 2012), ecological resilience (Willis et al., 2010), asynchronous ecosystem responses to (abrupt) climate change (Kohfeld and Harrison, 2000), microrefugia (Rull, 2009; Mosblech et al., 2011; Collins et al., 2013), and no-analog eco-system formation (Williams and Jackson, 2007; Correa-Metrio et al., 2012). Furthermore, a continent-wide overview of sites highlights ⁎ Corresponding authors.
E-mail addresses:S.G.A.Flantua@uva.nl(S.G.A. Flantua),H.Hooghiemstra@uva.nl (H. Hooghiemstra).
http://dx.doi.org/10.1016/j.revpalbo.2015.09.008
0034-6667/© 2015 The Authors. Published by Elsevier B.V. This is an open access article under the CC BY-NC-ND license (http://creativecommons.org/licenses/by-nc-nd/4.0/). Contents lists available atScienceDirect
Review of Palaeobotany and Palynology
available data for both generating and answering research questions (Seddon et al., 2014). Therefore, global databases of environmental data from the past and present will become increasingly important for en-abling new research directions, to facilitate large accessible archives and collaborative thinking between research groups.
1.2. Regional pollen database of Latin America
The lack of a comprehensive inventory of pollen sites from“Latin America” (Caribbean region, México, and Central and South America) has inhibited synoptic studies of the region and has caused an unaware-ness of the spatial and temporal coverage potentially available for global-scale assessments (Kohfeld and Harrison, 2000; Gajewski, 2008; Bartlein et al., 2011). After the Latin American Pollen Database (LAPD) was initiated in 1994, it passed through several institutions, to finally reappear again without new updates in 2007, when it was incor-porated into the Neotoma Paleoecology Database (www.neotomadb. org;Grimm et al., 2013). Beginning in 2014, new data contributed by in-dividual investigators was added to LAPD/Neotoma; however most of the LAPD data in Neotoma are from a 2002 version of LAPD. It is impor-tant to present the full extent of the growing palynological efforts in Latin America so that the potential for continental-scale synoptic studies can be assessed and researchers are aware of the available data for inclusion in their research. A comprehensive and updated database would be also useful to better address the origin and temporal evolution of“Latitudinal Diversity Gradients,” as well as to analyze the relationships between pollen diversity and vegetation diversity in time and space. Finally, it is important to have identified those areas where sampling effort should be focused in the near future so as to com-plete the picture of different biotic and climate dynamic changes. 1.3. Aims of paper
The aim of this paper is to present an updated inventory and synthe-sis of palynological sites in Latin America, identifying spatial patterns, research tendencies and potential research opportunities. Unique and contrastingfindings are highlighted and metadata are summarized. The objectives of this paper are to stimulate collaborative palynological opportunities, foster intra-, and inter-database comparisons, and ap-prise the best available data for multidisciplinary research.
2. Methods
2.1. Database compilation 2.1.1. History of LAPD
In 1994, Vera Markgraf at the University of Colorado (USA) started an open database of Latin American pollen data. During the period between 1998 and 2003, management of the LAPD was based at the University of Amsterdam, where Robert Marchant served as coordina-tor. Among numerous papers by Marchant and collaborators two are key for this paper. One was a synthesis of the distribution and ecology of taxa in the LAPD (Marchant et al., 2002), and the other was pollen-based biome reconstructions for Latin America (Marchant et al., 2009). The version of the LAPD in Amsterdam ultimately incorporated about 500 pollen sites, including data from cores, archeological, cave and alluvial sites and surface samples and sites from Central America, the Caribbean, and South America. However, this database was never pub-licly available. Through the NOAA Paleoclimatology website and several workshops, the idea of sharing data was promoted, especially before data become lost or abandoned over time (Michener et al., 1997). Active management of LAPD at Amsterdam ended in 2003, and no further updates were made to the website and related database. Meanwhile, publication of new data from Latin America has accelerated, and the current LAPD is outdated, a common problem of shared databases (Costello et al., 2014).
2.1.2. Description of the data compilation
As afirst step to updating LAPD and for developing a plan for acqui-sition of new data, we have developed an inventory of existing data for potential incorporation into LAPD. We carried out an exhaustive search for published pollen datasets and compiled the following metadata: site latitude-longitude coordinates and altitude, proxies analyzed, chrono-logical control, and estimated time range covered. The inventory includes both paleodata and modern pollen samples and data from ter-restrial and marine environments. Although historically LAPD has focused on the Quaternary period, the new inventory also includes pol-len records from the Pliocene and late Miocene, especially long records that also span the Quaternary. Direct access to Colombian universities facilitated the addition of“grey” literature (including Master and Ph.D. theses and unindexed national journals). The inventory of such resources from other countries is limited to that revealed by digital resources, and is less exhaustive than that available from Colombia. Thus, opportunity exists in other countries to inventory more datasets from these kinds of publications. Therefore we emphasize the opportu-nity to extend the compilation provided in this paper based on unpub-lished literature.
2.2. Spatial and temporal assessment of the LAPD 2.2.1. Paleomapping
Across Latin America, investigators have employed various techniques to elucidate emergent properties from spatial arrays of pollen data, including i) isopollen maps of modern pollen samples (Paez et al., 2001; Hooghiemstra et al., 2006; Tonello and Prieto, 2008; Urrego et al., 2009), ii) translation of pollen data into biomes (Marchant and Hooghiemstra, 2004; (Marchant et al., 2002, 2009), iii) quantitative climate reconstruction combining modern pollen as-semblages and modern climatological data in a pollen-climate training set (Punyasena et al., 2008; Tonello et al., 2009; Tonello and Prieto, 2010; Schäbitz et al., 2013) and iv) CO2 concentrations in paleo-atmospheres (Boom et al., 2002; Beerling and Mayle, 2006). More advanced geographical information system (GIS) modeling tools or dy-namic vegetation models were used for species and biome distribution mapping for the Guyana highlands (Rull and Nogué, 2007), Amazonia (Beerling and Mayle, 2006), Yucatán peninsula (Carrillo-Bastos et al., 2012), and the Colombian lowlands (Flantua et al., 2007) and highlands (Flantua et al., 2014).
2.2.2. Spatial metadata
The geographical extent of the inventory was confined between latitudes 32°N to 63°S and longitudes 30°W to 116°W. For many sites, especially those published before 1980, accurate locational information is not available, but insofar as possible, the published geographic coordi-nates were recorded. Significant discrepancies in published descriptive locations and latitude-longitude coordinates were checked, for example sites with coordinates in the wrong country or terrestrial sites with co-ordinates in the sea. In such cases, other references and Google Earth were consulted where possible to obtain estimated coordinates. Most modern samples have excellent metadata for their location with the ad-vent of Geographical Positioning System (GPS) and online mapping tools such as Google Earth. Published altitudinal data have not been adjusted even if coordinates were incorrect (a typo in a longitude or latitude coordinate does not necessarily imply an error in altitude). Here again, the pre-GPS altitude assessments were often based on altimeters that could drift in accuracy byN100 m during a day.
The temporal coverage of datasets was recorded as published with-out further evaluation of radiocarbon accuracy. Sites were categorized into broad time bins, including the last glacial cycle (300–50 thousand calibrated years before the Present, here indicated as 300–50 ka), the transition of the Last Glacial Maximum (LGM; 22–20 ka), the Holocene (12–10 ka), and the period of most recent human impact (2–0 ka). The latter time bin is currently of specific interest at a global scale (
PAGES-2k Consortium, 2013) and regional scale ( http://www.clim-past-discuss.net/special_issue88.html). With increasing age, fewer sites are available and the need to interpolate across larger areas increases. Consequently spatial uncertainty for paleomapping is amplified by spare data. To provide afirst indication of spatial uncertainty, we estimated the “nearest neighbor index” (Clark and Evans, 1954), which compares the expected (random) to the observed geographical straight-line distances between the terrestrial sites. If the ratio of the ob-served distance divided by the expected distance is less than 1, the pat-tern exhibits clustering; if the ratio is greater than 1, the trend indicates dispersion. The nearest neighbor analysis are performed using ArcGIS® and ArcGIS 10.1™ software (Esri, 2012), and the extensions ArcGIS 10.1™ Spatial Statistical Tools and the Geospatial Modelling Environ-ment Version 0.7.2.1 (Beyer, 2012). Sites with same coordinates were removed.
2.2.3. Geochronologic database of the LAPD
Mapped syntheses are critically limited by the accuracy and preci-sion of14
C ages (Grimm and Jacobson, 2004; Giesecke et al., 2012; Flantua et al., 2015a), especially for those aimed at assessing the syn-chrony of change across a region. In thisfirst phase of temporal assess-ment, we evaluated only the“age control density” for each dataset. This score indicates the density of the geochronologic ages (14
C,210
Pb, U-series, etc) along the total core length and is quantified by dividing the length of time represented by the sedimentary sequence by the number of geochronologic ages. The density of ages was calculated using the original author-reported age controls. Sites (n = 97) with only one geo-chronologic date were excluded.
2.2.4. Additional metadata
If the publication named the biome in which the site occurred, that biome was recorded. If no specific biome was named, a biome was assigned as perTable 1fromMarchant et al. (2009). Datasets were categorized as monoproxy if they included only pollen data or multiproxy if other biological, physical, or chemical data are available. Figures throughout this paper were created using ArcGIS®software by
Esri (2012). 3. Results
3.1. Spatial assessment of the LAPD 3.1.1. Spatial coverage
The density and the spatial distribution of pollen sites over a geographical region are important variables for paleomapping and spa-tial interpolation. The LAPD inventory comprises datasets from 30 coun-tries, including 4817 modern pollen surface samples (Fig. 1A) and 1379 paleo-datasets (Fig. 1B). Surface-sample coverage in terms of density of samples and representation of biomes is especially good from Argentina (21%), Colombia (18%), and Chile (9%) (Table 1). A limitation, however, is that although published surface-sample datasets often include a large number of samples, precise geographical coordinates are not always provided, in which case, a number of points may be assigned identical latitude-longitude coordinates and are mapped as single point in
Fig. 1, e.g. in the Cordillera Oriental of Colombia (Grabandt, 1985), Venezuelan Andes (Rull, 2006), and Tierra del Fuego (Heusser, 1989). Differences with previously announced LAPD versions (Flantua et al., 2013) are owing to continuous updates and revisions of literature. The long history of paleoecological research in Latin America contributes to the impressive number of paleo-sites investigated, particularly from Chile (19%), Colombia (18%), Argentina (14%), Brazil (13%), and Mexico (10%). Palynological research at fossil animal middens (n = 88) contributes to the large amount of paleo-sites in Chile. New coun-tries to the database are mainly from the Caribbean (e.g. Cuba and Haiti) and Central America (mainland Honduras and El Salvador). The density of sites is especially high in central and southern Mexico, the
Colombian Andes, the region of Lake Titicaca in Peru and Bolivia, the southern pampas of Argentina, and the southern Patagonia of Argentina and Chile. Paraguay and Jamaica are not represented in the inventory. The sites are widely distributed in altitude (Fig. 2), from the lowlands of Mexico to the high Andes, with the highest sites in Peru and Bolivia between 10–20°S. A majority of sites (58%) lie below 1000 m asl especially in Brazil, Chile and Argentina, although in terms of proportionate areal coverage, high altitudes are better represented.
The inventory includes 38 marine records, the earliest of which are distributed from the northern and southern Atlantic Ocean (Venezuela:Muller, 1959; Argentina:Groot et al., 1965) to the Pacific Ocean (Costa Rica:Horn, 1985; Ecuador:Heusser and Shackleton, 1994). Recent marine cores from the Cariaco basin in the Carribean (68 ka:González et al., 2008), western Patagonia (22 ka:Montade et al., 2012, 2013), and the Panama basin in the Pacific (40 ka:
González et al., 2006) provide insights on terrestrial environmental changes during the last glacial interglacial cycle.
3.1.2. Spatial distance assessment
The nearest neighbor index of the LAPD isb1 for all time bins, indi-cating clustering of sites at all times. At 0 BP, mean nearest neighbor distance is 67 km; whereas at 50 ka, the mean distance is 218 km, with only 145 sites available older than 25 ka (Fig. 3A). Thus, with increasing age, the density of sites decreases, while the degree of Table 1
Number of pollen sites per country and per LAPD version. Indicated are the number of modern pollen sites as a total and only sites with known coordinates. In case of paleoeco-logical sites, only a few sites remain without coordinates. Countries are in alphabetic order. (1)Marchant et al. (2002). (2) Authors are aware of the ongoing disagreement on territory, so no specific country is assigned.
Country LAPD 2014 LAPD 1999
Modern– Total Modern– known coordinates Paleo– Total Paleo– unknown coordinates Modern Paleo Antarctica 1 1 Argentina 1032 102 190 1 52 39 Bahamas 130 3 Barbados 1 Barbuda 2 2 15 Belize 28 28 19 1 1 Bolivia 253 163 40 1 1 19 Brazil 280 68 189 1 18 40 Chile 432 146 261 3 87 Colombia 873 273 243 1 5 137 Costa Rica 118 57 29 1 38 12 Cuba 100 3 Dominican Republic 49 48 5 Ecuador 265 117 71 10 21 El Salvador 3 French Guiana 4 Grenada 3 Guatemala 107 18 41 1 5 5 Guyana 4 1 3 Haiti 2 Honduras 3 Mexico 365 174 120 35 Aragua 2 Panama 210 18 15 1 9 7 Peru 182 77 32 4 13 Surinam 2 2 Trinidad y Tobago 4 Falklands Islands/Islas Malvinas 33 6 12 1 11 Uruguay 45 45 3 1 Venezuela 313 70 62 1 5 24 Total 4817 1412 1379 19 151 455
uncertainty for paleomapping increases. At the Pleistocene–Holocene transition (11.6 ka), mean distance is higher in the central regions of Latin America and the Amazon basin compared to the Colombian Andes and Southern Chile and Argentina. Most sites (nN 800) include the last two millennia, while the LGM (n≅ 120) and Pleistocene–Holo-cene transition (n≅ 310) is represented in smaller numbers of datasets (Fig. 3B). Time control for some datasets is uncertain, however, because
of few14
C or other geochronological control. In some regions, scarcity of suitable depositional environments for pollen accumulation contributes to low density of sites. In particular, the Amazon lowlands are scarce in LGM records (Ledru et al., 1998). The studies byColinvaux et al. (1996),
Burbridge et al. (2004),Mayle et al. (2007),Whitney et al. (2011)and
Hermanowski et al. (2012)stand as the few long records available from the lowlands. Additionally, marine cores byHaberle and Maslin
Fig. 1. Sites (cores and sections) in the 2014 Latin American Pollen Database. (A) Modern pollen rain data from core tops, traps and surface sediments shown in red dots. (B) Drilled cores and exposed sections are shown in blue triangles.
0 1000 2000 3000 4000 5000 6000 7000 -70 -50 -30 -10 10 30
Elevation (masl
) Latitude (degrees)Antarctica Argentina Bahamas
Barbados Barbuda Belize
Bolivia Brazil Chile
Colombia Costa Rica Cuba
Dominican Republic Ecuador El Salvador French Guiana Grenada Guatemala
Guyana Haiti Honduras
Mexico Nicaragua Panama
Peru Trinidad y Tobago UK/Argentina Uruguay Venezuela >4000m: 6.4 % >5000m: 0.5 % >3000m: 18.8% >2000m: 29.9% >1000m: 41.2 % 0 - 1000m: 58%
Fig. 2. Distribution pattern of all sites, including modern pollen rain sites and cores and sections lodged in the LAPD organized by latitude and elevation. There are no known coordinates for Surinam and marine cores not shown. Negative values indicate southern latitudes.
(1999)andHoorn (1997)were exploredfilling the void on our under-standing on long term climate change dynamics of the Amazon basin.
The sites with the longest continuous records are located at higher altitudes in Colombia (284 ka in Lake Fúquene: core Fq-9C; 2225 ka in paleolake Bogotá: core Funza09) and Bolivia (151 ka in Lake Titicaca: core LT01). From lower elevation, El Valle in Panama (Bush and Colinvaux, 1990) stands out with a record extending to ~ 150 ka, as well as Colônia CO3-1in Brazil (Ledru et al., 2005) and Lake Petén-Itza in Guatemala (Correa-Metrio et al, 2013), 100 ka and 85 ka respectively. The Cariaco record (68 ka,González et al., 2008) is an example of an ex-ceptional regional reference for the palaeoeclimatology of the area, and also as a chronological landmark for its annualy laminated sediments (Hughen et al., 2004) that have been used to calibrate the worldwide
14
C database (Reimer et al., 2013).
3.2. Temporal assessment of the LAPD
The new LAPD inventory contains 5003 chronological controls from 1062 sites (some sites contain multiple records) including tephras (n =
30) and uranium series dates (n = 6). Relative chronologic controls, such as biostratigraphic dates, were not included. During recent years, the number of ages used for stratigraphic age models has trended up-wards; since 2010, the mean and median number of dates per published age model isfive and three, respectively (Fig. 4); however, the number varies widely, between 1 and 50. Wide variation in dating resolution has important implications for paleomapping (Fig. 5).
Publications report geochronologic metadata inconsistently. Impor-tant details are often missing, including material dated, laboratory number, calibration curve and program, and age modeling algorithm. Some publications report only the calibrated ages and not the original
14
C ages reported by the laboratory. Other publications only present the dates or age models graphically. Missing geochronologic data and metadata complicate efforts to evaluate dating accuracy and precision, which is necessary for synoptic multi-site analyses (Flantua et al., 2015a). For example, if a study is trying to assess climate change during the Younger Dryas interval, it is important to know how secure the dat-ing for this interval is, as errors of a few hundred years could be conse-quential. Another important issue is that published age models are
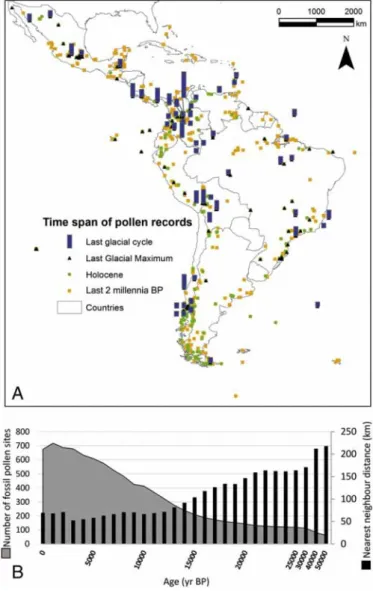
Fig. 3. (A) Spatial and temporal distribution of fossil pollen samples over Latin America for the selected intervals: 2–0 ka BP, onset of the Holocene at 12–10 ka BP, the LGM at 22– 20 ka BP, and the long Quaternary records (300–50 ka BP). The length of the bars of the latter sites represents the relative length of the record in time. (B) The number of fossil pollen sites available at different time frames is shown at the left axis. The right axis shows the“nearest neighbor distance” over time indicative of the degree of uncertainty for paleomapping based on the spatial distance.
0 10 20 30 40 50 60 1950 1960 1970 1980 1990 2000 2010 Number of dates used Year
Fig. 4. Number of absolute geochronologic dates (14C, tephra, U-series,210Pb) in a pollen record. Ages derived from biostratigraphy and cyclostratigraphy are not considered.
Fig. 5. Age control density per pollen record showing the number of ages relative to the length of time period represented by the pollen record sequence.
based on different versions of the radiocarbon calibration curve, which has been updated every few years. To ensure comparability for synoptic studies, age models may need to be updated to the current calibration curve, for which sufficient data must be available for updating age models and chronologies. This exercise has recently been presented by
Flantua et al. (2015a)for the northern and central Andes within a framework of a newly composed LAPD geochronologic database. Sug-gestions for the data needed for reconstructing chronologies can be found inBlaauw (2010),Buck and Millard (2004)andGrimm et al. (2014). The need for protocols on procedures for constructing chronol-ogies is imperative and has become the focus of attention of different in-ternational workgroups, e.g. Neotoma Paleoecology Database (Grimm et al., 2014) and the project Integration of Ice-core, Marine and Terres-trial records (INTIMATE;Blockley et al., 2012).
3.3. Publications, proxies, and biomes 3.3.1. Publications
The LAPD inventory includes over 1200 publications published prior to April 2014 or known to be in press (Figs. 6; 7). Of these, 58% were published since 2000 with the peak years being 2010 and 2012, with 66 and 67 publications respectively. We expect tofind more studies published in 2012–2014. Receiving early attention in the 1960s and 1970s were the Patagonian lowlands, the Amazon basin, and the high Andes, which are still foci of investigation. Early palynologists worked on pre-Quaternary and Quaternary sediments in the course of oil exploration (e.g.De Boer et al., 1965; Germeraad et al., 1968); early compilation byArchangelsky (1968). Islands and their unique biogeog-raphy have attracted attention, including the Easter Islands (Flenley and King, 1984; Cañellas-Boltà et al., 2013), the Galapagos (Colinvaux, 1972; Restrepo et al., 2012), and the Falkland Islands (Barrows, 1977). In the past decade, the Brazilian coastal region and the Caribbean islands have received increased investigation. Few studies exist from the arid zones of Chile and Argentina mainly because the absence of lakes or strong reservoir effect on sediments from highlands such as Altiplano lakes. However, pollen from rodent middens (e.g.Markgraf et al.,
1997; Maldonado et al., 2005) provide a basis for reconstructing the climate and environment of the driest zone of the Atacama desert (Chile) for the past 55 ka. Midden studies have been carried out primar-ily in northern Chile and Argentina but have potential in other arid zones such as eastern Brazil.
3.3.2. Multiproxy studies
A developing trend has been the shift from monoproxy to multiproxy studies (Fig. 8). Since 2000, about half of all papers report multi-proxy analyses compared to about afifth of all papers in the 1990s (Fig. 9). In addition to pollen, charcoal and physical sedimentology have been the most common additional proxies; however, studies of 3 to 4 proxies are not uncommon (e.g.Conroy et al., 2009; Enters et al., 2010; Vriend et al., 2012; Ledru et al., 2013). Palynologicalfindings have been support-ed by biomarkers to define upper forest-line migration (Jansen et al., 2010), by charcoal to indicate human influences (e.g.Montoya and Rull, 2011) or seasonality (e.g.Iglesias et al., 2012), and a variety of different proxies to reveal the cultural history of America (e.g.Goman et al., 2010; Sedov et al., 2010; Iriarte et al., 2012; Whitney et al., 2013). 3.3.3. Representativeness of biomes and ecosystems
The wide diversity of biomes across Latin America is unequally represented in the inventory (Fig. 10). The páramos (cool grasslands), Amazonian rainforest (tropical rainforest), and warm temperate ever-green broadleaf forest are relatively well studied. Whereas, the tropical dry forest and warm temperate mixed forest are geographically restrict-ed and less well representrestrict-ed. The latter is characteristic of the mid to high altitudes in Mexico, while dry forest is extensive in central Brazil. Pollen data from the deserts and vegetation communities from the arid regions of Chile and Mexico are equally sparse, although palynolog-ical research on fossil animal middens is quickly expanding. Investiga-tors have often targeted transition zones or ecotones, such as the savanna-forest boundary in the Colombian Llanos (e.g.Behling and Hooghiemstra, 2000) and in the Venezuelan Gran Sabana (e.g.Leal Rodríguez, 2010; Montoya et al., 2011); the upper Andean forest and páramos in the Ecuadorian Andes (e.g.Brunschön and Behling, 2010; González-Carranza et al., 2012); the transition from pampa grasslands to xerophytic woodlands (e.g.Schäbitz and Liebricht, 1998; Tonello and Prieto, 2010); and the Patagonian forest/steppe ecotone (e.g.Markgraf et al., 2007; Iglesias et al., 2012). Scaling down, some investigations have focused on ecological dynamics within biomes, which can encompass significant variability. For example, the tropical rainforest biome includes Amazonian rainforest and coastal mangrove ecosystems, while the tropical dry forest biome encompasses“Cerrado,” Caatinga, and“Campo rupestre” (Huber and Riina, 1997, 2003). Similar-ly the Pampa grasslands,“Espinal,” “Monte” and Patagonian Steppe are grouped into temperate grasslands, savannas and shrublands biome (Olson et al., 2001). Furthermore, at longer time-scales poor-analog or no-analog systems may be“forced” into a modern biome structure rath-er than being treated as a novel assemblage. Thus, the biome approach is interesting as a generalized categorization but due the large climatic amplitudes of the Plant Functional Types are not apt for detailed ecosys-tem level assessments.
4. Discussion
4.1. The variety of data and questions in the LAPD
The heterogeneity of the LAPD data has implications for multisite comparisons. The sites differ greatly in spatial and temporal coverage, sample and geochronologic resolution, and research questions. The use of palynology for novel conservation problems such as invasive species (Van Leeuwen et al., 2008), human–landscape interactions (e.g.Haug, 2003; Iriarte and Behling, 2007; Lozano-García et al., 2007; Vegas-Vilarrúbia et al., 2011; Gosling and Williams, 2013; Carson et al., 2014), impact of sea level rise (Cohen et al., 2009; Behling,
2011; Urrego et al., 2013) and conservation and management of ecosys-tems (Behling et al., 2007; van Leeuwen et al., 2008; Vegas-Vilarrúbia et al., 2011), are just some of the few exciting new research topics in Latin America. No-analog ecosystems (Correa-Metrio et al., 2012; Velásquez-R. and Hooghiemstra, 2013) and microrefugia (Rull, 2009; González-Carranza et al., 2012; Whitney et al., 2014) deal with more regional questions but have important global implications. Quantitative paleoclimatic reconstructions based on pollen from Latin America are scarce and focused on Southern Patagonia (Tonello et al., 2009; Schäbitz et al., 2013).
Long sediment sequences (N20 ka) are crucial for identifying and un-derstanding long-term ecological and evolutionary processes (Torres et al., 2013; Seddon et al., 2014). Such sequences from Colombia and Mexico were essential in relating high-mountain vegetation change to global ice volume and concentrations of greenhouse gasses (Groot et al., 2011), and identifying temperature change velocity (
Correa-Metrio et al., 2013). A deep core from the south Argentinean Potrok Aike Maar is presently under study by the international Potrok Aike Maar Lake Sediment Archive Drilling Project (PASADO) team (Recasens et al., 2012). Regardless of the length of the time span, records may detect certain vegetation dynamics scarcely observed in other records. An example are the short pollen records in Chocó, Colombia (Behling et al., 1998; Berrío et al., 2000), which register minimal biome change although there are indications of environmental change related to tectonically driven changes in the coastal areas. Pollen assemblages from fossil rodent middens record altitudinal changes in vegetation belts and infer therefore the interaction between summer and winter precipitation (Maldonado et al., 2005) and hydrologic changes associated to human responses (Maldonado and Uribe, 2012; Mujica et al., 2015). Additional-ly, sites can be present in an area of low representativity in the palynolog-ical coverage. Besides newly added pollen data from rodent middens in arid regions, pollen sites from the Venezuelan“tepuis” (Rull, 2010) and 0 1955 1958 1961 1964 1967 1970 1973 1976 1979 1982 1985 1988 1991 1994 1997 2000 2003 2006 2009 2012 10 20 30 40 50 60 70 80 Number of public a tions Year of publication
Fig. 7. Histogram showing the number of publications including pollen records by year from 1955 onwards.
5 24 46 145 227 443 253 0 0 18 52 116 239 157 0 0 1 13 65 124 77 2000 3331 3000 3901 3738 2298 1909 0 500 1000 1500 2000 2500 3000 3500 4000 4500 0 50 1950-1959 1960-1969 1970-1979 1980-1989 1990-1999 2000-2009 2010-2014 100 150 200 250 300 350 400 450 500
Age control density (years)
Number of publications / studies
Publications Multiproxy sites
Studies with pollen + charcoal Age control density
Fig. 8. Characteristic information on fossil pollen records lodged in the LAPD per decade. Number of publications, number of multiproxy studied sites, number of studies with both pollen and charcoal data and age control density are shown.
lake Timbio (Wille et al., 2001) are among the few sites available to study the Guyana highlands and lower montane (subandean) forest respec-tively. These sites represent ongoing“silent” regions and indicate the im-portance of expanding the database and research efforts.
4.2. Re-visit or re-evaluation of sites
When disagreements on regional climate dynamics persist, such as the magnitude of temperature or precipitation change, a revisit or
re-evaluation of sites may be in order. Examples of such controversial areas are the northwest corner of Brazil (e.g. Bush et al., 2004; D'Apolito et al., 2013), southeast Amazonia (Hermanowski et al., 2012), Easter Island (Rull et al., 2013) and southern Patagonia (Kilian and Lamy, 2012). Other important sites that have not been substantiated by later studies may provide insights into key to paleoecological under-standing. They might, however, not meet modern standards of inquiry in terms of taxonomy or adequate dating control, particularly if they were studied before the advent of accelerator mass spectrometry (AMS) radiocarbon dating. Examples are the Lusitania record in Colombia (Monsalve, 1985) and Crominia in Brazil (Ferraz-Vicentini and Salgado-Labouriau, 1996). These sites prove the value of conclu-sions derived from pollen site compilations, and that revisiting lakes with specific research questions can be more rewarding than the search for new lakes to core.
4.3. Potential limitations and weaknesses
With respect to current global climate change and controversies over anthropogenic forcing vs. natural variation, documentation and understanding of decadal to centennial scale climate variability has be-come increasingly urgent. However, few currently studied sites have the requisite temporal resolution, such as Cambará do Sul (Behling et al., 2007), La Cocha (González-Carranza et al., 2012), Papallacta (Ledru et al., 2013) and El Junco (Restrepo et al., 2012). High resolution pollen records from Southern Patagonia have been developed in the last two decades (Heusser et al., 1999) but late Holocene high resolution records appear only the last few years (e.g.Moreno et al., 2009). Nevertheless, the publication of new radiocarbon calibration curves in 2013 (Hogg et al., 2013; Reimer et al., 2013) will necessitate development of new chronologies and age models. An inventory of associated geochronolog-ic data is necessary to assess the temporal resolution of questions that can be addressed. An assessment of chronological data derived from the LAPD is presented byFlantua et al. (2015a).
Physiographic variability and vegetation mosaics present challenges for paleomapping, which interpolates between sites that represent local vegetation. Such variability is evidenced in studies byD'Apolito et al. (2013)for lowland Amazonia and byMarchant et al. (2001)for Andean sites, and Venezuelan savannas (Montoya et al., 2011). Even with Fig. 9. Distribution of site studies with focus on a single proxy and multiple proxies. Studies
include recent pollen rain sites and paleo-sites (cores and sections).
0 1000 2000 3000 4000 5000 6000 7000 -70 -50 -30 -10 10 30 Ele v a tion (m asl) Latitude (degrees) Coolgrass shrublands Cool grasslands Cool mixed forest Cool temperate rainforest Desert
Steppe
Tropical dry forest Tropical rainforest Tropical seasonal forest Warm temperate evergreen forest Warm temperate mixed forest Warm temperate rainforest
Fig. 10. Distribution pattern by latitude and elevation of biomes reflected in the LAPD. Designation of biomes follows (Marchant et al., 2009). Marine cores are not shown. Negative values indicate southern latitudes.
relatively short distances between sample sites in the last 10 ka, the topographical diversity of the continent adds an increased element of uncertainty for paleomapping. Nevertheless, advanced geospatial analysis of pollen is hardly explored in Latin America, although some research hypothesis can only be solved with a spatial focus.
Finally, we identified: i) ecosystem responses to millennial-scale and centennial climate changes, ii) rates of change, iii) changes in connectiv-ity and its impact on geneflow and isolation, iv) changes in altitudinal distribution of individual taxa as well as biomes, v) changes in biomes and its impact on ancient human populations, vi) impact of pCO2 and frequency of nightfrost on the altitudinal distribution of taxa, vii) warm interglacial refugia (páramo at high elevation and C4 vegeta-tion at low elevavegeta-tions) and cold glacial refugia as still poorly document-ed forces of vegetation change.
4.4. Grey literature and missing research
Data from grey literature are often the most difficult to identify and acquire, especially from countries in which national journals are pub-lished in the local language. Based on our increased access to grey liter-ature in Colombia, we suspect that substantial literliter-ature of similar nature, including theses, exists in other Latin American countries as well as in North America and Europe, where many researchers who have worked in Latin America are based. The access to unpublished studies and grey literature may be advantageous but it can also have a handicap. On the one hand, the information is frequently more complete but, on the other hand, often has not undergone rigourous peer review, thus potentially compromising scientific quality. Additionally, archeological literature may be a source of pollen data not adequately surveyed for this inventory (e.g.Enters et al., 2010). Latin American researchers often face obstacles to publishing in English-language journals (Vasconcelos et al., 2008; Clavero, 2010; Arbeláez-Cortés, 2013). The LAPD inventory will es-pecially attract attention to papers not written in English or in in-ternational journals and will create increased awareness of this important literature, even if the raw data are not yet available in a public database. The updated LAPD provides the ideal literature platform to make the wide range of studies known and accessible for researchers.
4.5. Integrative comparison of multiple pollen data
This paper provides an initial analysis of the updated inventory to identify locations, ecosystems, and research topics that are well studied, under discussion, or under-represented in existing data net-works. Thisfirst level inventory is supported by a literature database and corresponding metadata of the sites. To address macro-scale questions that require integrative comparison of multiple pollen data, sites should be comparable, reproducible and ideally in a shared database environment. The Neotoma Paleoecology Database (www.neotomadb.org) is global paleodata initiative that offers a readily available platform to reduce overall IT overhead for community-wide database maintenance while enhancing capabili-ties for data ingest, display, analysis, and distribution. Not only does the Neotoma Paleoecology Database provide a data curation system to counter data loss through time (Michener et al., 1997; Jahnke et al., 2012), it addresses commonly identified problems of open access databases (Porter and Callahan, 1994; Costello et al., 2014). However, the Neotoma Paleoecology Database only facilitates a set of issues for an open-access palynological database to be suc-cessful. For the LAPD to be a sustainable database for researchers to rely upon, contribute to, and participate in, the scientific community is responsible for both the quality and comprehensiveness of the da-tabase and its continuation. Dada-tabase cyberinfrastructure can sup-port urgent inquiry, long-term needs, and future visions of the community, but the level of data sharing should be a guided by a
regional science organizations or institutions with recognized man-dates. Neotoma provides an online platform for palynological ex-change, but the answers to macro-scale research depend on the collaborative will of the regional data generators. Already existing groups in collaboration with the newly updated LAPD are the Long-Term Climate Reconstruction and Dynamics of South America (LOTRED-SA) initiative (Flantua et al., 2015b; Villalba et al., 2009;
www.pages-igbp.org/workinggroups/lotred-sa) and the Global Charcoal Database (http://gpwg.org/). Doubts on the ethical re-use of research data is a common problem of open-access databases (Jahnke et al., 2012), but possible incorrect interpretations of either a publications or data should not interfere with the opportunity to contribute of a collaborative long-term effort. Therefore a proactive communication with contributors is essential during any synthesis of data, and will ultimately enrich the interpretation and under-standing of the compilation of information.
Shared palynological databases aim to facilitate integration, synthesis, understanding of the paleorecord, and to promote in-formation sharing and collaboration. To achieve the best projec-tions and predicprojec-tions of future vegetation responses to ongoing warming and other global changes, we need to make use of the best available data (Wolkovich et al., 2012) and exploit the full po-tential of palynological data. For the continuation of an updated LAPD, an interactive participation and interchange of the palyno-logical community is essential and will provide an enrichment of the Latin American pollen data use and analysis. It is important that the palynological community becomes aware of regional and global initiatives to enable joint analysis of multiproxy datasets to address paleoenvironmental questions that transcend those possible with single-proxy databases.
5. Conclusions
The updated inventory of Latin American palynological research facilitates exploration of the temporal and spatial coverage of pollen data. The publically available LAPD has not been updated for over a decade. The current inventory identifies a large quantity of data that po-tentially could be incorporated into LAPD; the number of bibliographic records has expanded from ~ 190 publications to over 1200. The new LAPD inventory shows an impressive increase in the spatial distribution of sites, currently 1379 paleo-sites and over 4800 modern pollen sam-ples. An increasing number of studies in Latin America are addressing broad-scale questions with multisite comparison, multi-proxy ap-proaches, and multidisciplinary interests; and research practices and methodologies are commensurate with other continents (Seddon et al., 2014). We anticipate that this inventory data will prompt new research questions and opportunities.
All scientific research is built on the existing body of scientific data. LAPD strives to make these data more accessible and thereby foster and support research. In addition, by providing spatial and temporal visualizations of the existing data, LAPD aims to identify gaps in current knowledge and to provide a mechanism for generat-ing new hypotheses by displaygenerat-ing emergent properties in arrays of data. New research might involve revisiting strategic sites for reanal-ysis with newer technologies, especially acquisition of improved geochronologic data (e.g.Sedov et al., 2010; Bogotá-A et al., 2011), or have the potential for a deeper cores, such as Lake Chalco (Brown et al., 2012). Finally, synoptic studies comparing pollen data with other proxies contained either in the Neotoma Paleoecolo-gy Database or residing in other databases, such as the Global Char-coal Database (Power et al., 2008) will provide new insights into more robust reconstructions of paleoenvironmental change. The list of sites will become available through Neotoma while a new LAPD literature website aims to facilitate an overview of expanding research.
Acknowledgments
We thank the Netherlands Organization for Scientific Research (NWO, grant 2012/13248/ALW) forfinancial support of this project. We would like to thank the Amsterdam-based Hugo-de-Vries-Founda-tion for supporting this work between 2009 and 2012 by three grants. The Neotoma Paleoecology Database is supported by the Geoinformatics Program of the U.S. National Science Foundation, projects EAR-0947459 and EAR-0948652. We would like to thank the students Susana Velásquez-Franco and Jessica Lizeth Moreno-Calderon for their support to the compilation and we acknowledge the great effort by Vera Markgraf and Lysanne Anderson in establishing the LAPD two decades ago. Without the helpful researchers that provided paperback copies from their publications the LAPD would have lacked valuable papers. The Editor of RPP and two anonymous reviewers provided very helpful com-ments on earlier drafts of the article.
References
Arbeláez-Cortés, E., 2013. Knowledge of Colombian biodiversity: published and indexed. Biodivers. Conserv. 22, 2875–2906.http://dx.doi.org/10.1007/s10531-013-0560-y. Archangelsky, S., 1968. Palaeobotany and palynology in South America: a historical review.
Rev. Palaeobot. Palynol. 7, 249–266.http://dx.doi.org/10.1016/0034-6667(68)90031-6. Barrows, C.J., 1977. Palynological studies in South Georgia. Unpublished Ph.D. Thesis.
University of Birmingham, UK.
Bartlein, P.J., Harrison, S.P., Brewer, S., Connor, S., Davis, B.A.S., Gajewski, K., Guiot, J., Harrison-Prentice, T.I., Henderson, A., Peyron, O., Prentice, I.C., Scholze, M., Seppä, H., Shuman, B., Sugita, S., Thompson, R.S., Viau, A.E., Williams, J., Wu, H., 2011. Pollen-based continental climate reconstructions at 6 and 21 ka: a global synthesis. Clim. Dyn. 37 (3-4), 775–802.http://dx.doi.org/10.1007/s00382-010-0904-1. Beerling, D.J., Mayle, F.E., 2006.Contrasting effects of climate and CO2 on Amazonian
ecosystems since the Last Glacial Maximum. Glob. Chang. Biol. 12 (10), 1977–1984. Behling, H., 2011. Holocene environmental dynamics in coastal, eastern and central
Ama-zonia and the role of the Atlantic sea-level change. Geogr. Helvetica 3, 208–216. http://dx.doi.org/10.5194/gh-66-208-2011.
Behling, H., Hooghiemstra, H., 2000.Holocene Amazon rainforest-savanna dynamics and climatic implications: high-resolution pollen record from Laguna Loma Linda in east-ern Colombia. J. Quat. Sci. 15 (7), 687–695.
Behling, H., Hooghiemstra, H., Negret, A., 1998.Holocene history of the Chocó rain forest from Laguna Piusbi, Southern Pacific lowlands of Colombia. Quat. Res. 50, 300–308. Behling, H., Pillar, V.D., Müller, S.C., Overbeck, G.E., 2007.Late-Holocenefire history in a
forest-grassland mosaic in southern Brasil: implications for conservation. Appl. Veg. Sci. 10, 81–90.
Berrío, J.C., Behling, H., Hooghiemstra, H., 2000. Tropical rain-forest history from the Colombian Pacific area: a 4200-year pollen record from Laguna Jotaordó. The Holocene 10 (6), 749–756.http://dx.doi.org/10.1191/09596830094999.
Beyer, H.L., 2012. Geospatial Modelling Environment.http://www.spatialecology.com/ gme(Version 0.7.2.1).
Blaauw, M., 2010. Methods and code for‘classical’ age-modelling of radiocarbon sequences. Quat. Geochronol. 5, 512–518.http://dx.doi.org/10.1016/j.quageo.2010.01.002. Blockley, S.P.E., Lane, C.S., Bronk Ramsey, C., 2012. The INTegration of Ice core, MArine and
TErrestrial records of the last termination (INTIMATE) 60,000 to 8000 BP. Quat. Sci. Rev. 36, 1–222.http://dx.doi.org/10.1016/j.quascirev.2011.10.001.
Blois, J.L., Williams, J.W., Grimm, E.C., Jackson, S.T., Graham, R.W., 2011. A methodological framework for assessing and reducing temporal uncertainty in paleovegetation mapping from late-Quaternary pollen records. Quat. Sci. Rev. 30, 1926–1939. http://dx.doi.org/10.1016/j.quascirev.2011.04.017.
Bogotá-A, R.G., Groot, M.H.M., Hooghiemstra, H., Lourens, L.J., Van der Linden, M., Berrio, J.C., 2011. Rapid climate change from north Andean Lake Fúquene pollen records driven by obliquity: implications for a basin-wide biostratigraphic zonation for the last 284 ka. Quat. Sci. Rev. 30, 3321–3337.http://dx.doi.org/10.1016/j.quascirev. 2011.08.003.
Boom, A., Marchant, R., Hooghiemstra, H., Sinninghe Damsté, J.S., 2002.CO2- and
temperature-controlled altitudinal shifts of C4- and C3-dominated grasslands allow
reconstruction of palaeoatmospheric pCO2. Palaeogeogr. Palaeoclimatol. Palaeoecol.
177, 151–168.
Bradshaw, R.H.W., 2013.Paleobotany | Overview of terrestrial pollen data. In: Elias, S.A., Mock, C.J. (Eds.), Encyclopedia of Quaternary Science, Second Edition Elsevier, Amsterdam, pp. 699–704.
Brown, E.T., Werne, J.P., Lozano-García, S., Caballero, M., Ortega-Guerrero, B., Cabral-Cano, E., Valero-Garces, B.L., Schwalb, A., Arciniega-Ceballos, A., 2012.Scientific drilling in the basin of mexico to evaluate climate history, hydrological resources, and seismic and volcanic hazards. Sci. Drill. 14, 72–75.
Brunschön, C., Behling, H., 2010. Reconstruction and visualization of upper forest line and vegetation changes in the Andean depression region of southeastern Ecuador since the Last Glacial Maximum— A multi-site synthesis. Rev. Palaeobot. Palynol. 163, 139–152.http://dx.doi.org/10.1016/j.revpalbo.2010.10.005.
Buck, C.E., Millard, A., 2004.Tools for constructing chronologies: crossing disciplinary boundaries. Lect. Notes Stat. Vol. 177. Springer, Germany.
Burbridge, R.E., Mayle, F.E., Killeen, T.J., 2004.Fifty-thousand-year vegetation and climate history of Noel Kempff Mercado National Park, Bolivian Amazon. Quat. Res. 61 (2), 215–230.
Bush, M.B., Colinvaux, P.A., 1990. A pollen record of a complete glacial cycle from lowland Panama. J. Veg. Sci. 1 (1), 105–118.http://dx.doi.org/10.2307/3236060.
Bush, M.B., De Oliveira, P.E., Colinvaux, P.A., Miller, M.C., Moreno, J.E., 2004. Amazonian paleoecological histories: one hill, three watersheds. Palaeogeogr. Palaeoclimatol. Palaeoecol. 214, 359–393.http://dx.doi.org/10.1016/j.palaeo.2004.07.031. Cañellas-Boltà, N., Rull, V., Sáez, A., Margalef, O., Bao, R., Pla-Rabes, S., Blaauw, M.,
Valero-Garcés, B., Giralt, S., 2013. Vegetation changes and human settlement of Easter Island during the last millennia: a multiproxy study of the Lake Raraku sediments. Quat. Sci. Rev. 72, 36–48.http://dx.doi.org/10.1016/j.quascirev.2013.04.004.
Carrillo-Bastos, A., Islebe, G.A., Torrescano-Valle, N., 2012. Geospatial analysis of pollen records from the Yucatán peninsula, Mexico. Veg. Hist. Archaeobot. 21, 429–437. http://dx.doi.org/10.1007/s00334-012-0355-1.
Carson, J.F., Whitney, B.S., Mayle, F.E., Iriarte, J., Prumers, H., Soto, J.D., Watling, J., 2014. En-vironmental impact of geometric earthwork construction in pre-Columbian Amazonia. Proc. Natl. Acad. Sci. 111, 10497–10502.http://dx.doi.org/10.1073/pnas.1321770111. Clark, P.J., Evans, F.C., 1954.Distance to nearest neighbor as a measure of spatial
relation-ships in populations. Ecology 35 (4), 445–453.
Clavero, M., 2010.“Awkward wording. Rephrase”: linguistic injustice in ecological journals. Trends Ecol. Evol. 25 (10), 552–553.http://dx.doi.org/10.1016/j.tree.2010.07.001. Cohen, M.C.L., Behling, H., Lara, R.J., Smith, C.B., Matos, H.R.S., Vedel, V., 2009. Impact of
sea-level and climatic changes on the Amazon coastal wetlands during the late Holocene. Veg. Hist. Archaeobot. 18, 425–439.http://dx.doi.org/10.1007/s00334-008-0208-0. Colinvaux, P.A., 1972.Climate and the Galapagos Islands. Nature 240, 17–20.
Colinvaux, P.A., De Oliveira, P.E., Moreno, J.E., Miller, M.C., Bush, M.B., 1996.A long pollen re-cord from lowland Amazonia: forest and cooling in glacial times. Science 274, 85–88. Collins, A.F., Bush, M.B., Sachs, J.P., 2013. Microrefugia and species persistence in the
Galápagos highlands: a 26,000-year paleoecological perspective. Front. Genet. 4, 1–16.http://dx.doi.org/10.3389/fgene.2013.00269.
Conroy, J.L., Restrepo, A., Overpeck, J.T., Steinitz-Kannan, M., Cole, J.E., Bush, M.B., Colinvaux, P.A., 2009. Unprecedented recent warming of surface temperatures in the eastern tropical Pacific Ocean. Nat. Geosci. 2, 46–50.http://dx.doi.org/10.1038/ngeo390. Correa-Metrio, A., Bush, M.B., Cabrera, K.R., Sully, S., Brenner, M., Hodell, D.A., Escobar, J.,
Guilderson, T., 2012. Rapid climate change and no-analog vegetation in lowland Cen-tral America during the last 86,000 years. Quat. Sci. Rev. 38, 63–75.http://dx.doi.org/ 10.1016/j.quascirev.2012.01.025.
Correa-Metrio, A., Bush, M., Lozano-García, S., Sosa-Nájera, S., 2013. Millennial-scale tem-perature change velocity in the continental northern Neotropics. PLoS ONE 8 (12), e81958.http://dx.doi.org/10.1371/journal.pone.0081958.
Costello, M.J., Appeltans, W., Bailly, N., Berendsohn, W.G., de Jong, Y., Edwards, M., Froese, R., Huettmann, F., Los, W., Mees, J., Segers, H., Bisby, F.A., 2014. Strategies for the sus-tainability of online open-access biodiversity databases. Biol. Conserv. 173, 155–165. http://dx.doi.org/10.1016/j.biocon.2013.07.042.
D'Apolito, C., Absy, M.L., Latrubesse, E.M., 2013. The Hill of Six Lakes revisited: new data and re-evaluation of a key Pleistocene Amazon site. Quat. Sci. Rev. 76, 140–155. http://dx.doi.org/10.1016/j.quascirev.2013.07.013.
De Boer, N.P., Van der Hammen, T., Wijmstra, T.A., 1965.A palynological study on the age of some borehole samples from the Amazon delta area, N.W. Brazil. Geol. Mijnb. 44, 254–258.
Enters, D., Behling, H., Mayr, C., Dupont, L., Zolitschka, B., 2010. Holocene environmental dynamics of south-eastern Brazil recorded in laminated sediments of Lago Aleixo. J. Paleolimnol. 44, 265–277.http://dx.doi.org/10.1007/s10933-009-9402-z. Esri, 2012.ArcGIS Version 10.1 Redlands, CA.
Feeley, K.J., Rehm, E.M., Machovina, B., 2012.The responses of tropical forest species to global climate change: acclimate, adapt, migrate, or go extinct? Front. Biogeogr. 4 (2), 69–84. Ferraz-Vicentini, K.R., Salgado-Labouriau, M.L., 1996.Palynological analysis of a palm
swamp in central Brazil. J. South Am. Earth Sci. 9, 207–219.
Flantua, S.G.A., Van Boxel, J.H., Hooghiemstra, H., Smaalen, J., 2007. Application of GIS and logistic regression to fossil pollen data in modelling present and past spatial distribu-tion of the Colombian savanna. Clim. Dyn. 29 (7-8), 697–712.http://dx.doi.org/10. 1007/s00382-007-0276-3.
Flantua, S.G.A., Hooghiemstra, H., Grimm, E.C., Markgraf, V., 2013.Updated Latin American Pollen Database: Version 2013 in preparation for NEOTOMA. PAGES News 21, 88. Flantua, S.G.A., Hooghiemstra, H., Van Boxel, J.H., Cabrera, M., González-Carranza, Z.,
González-Arango, C., 2014.Connectivity dynamics since the Last Glacial Maximum in the northern Andes; a pollen-driven framework to assess potential migration. In: Stevens, W.D., Montiel, O.M., Raven, P.H. (Eds.), Paleobotany and Biogeography: A Festschrift for Alan Graham in His 80th Year. Missouri Botanical Garden, St. Louis, pp. 98–123.
Flantua, S.G.A., Hooghiemstra, H., Blaauw, M., 2015a. Quality assessment of chronologies in Latin American pollen records: a contribution to centennial to millennial scale studies of environmental change. Clim. Past Discuss. 11, 1219–1262.http://dx.doi. org/10.5194/cpd-11-1219-2015.
Flantua, S.G.A., Hooghiemstra, H., Vuille, M., Behling, H., Carson, J.F., Gosling, W.D., Hoyos, I., Ledru, M.P., Montoya, E., Mayle, F., Maldonado, A., Rull, V., Tonello, M.S., Whitney, B.S., González-Arango, C., 2015b. Climate variability and human impact on the envi-ronment in South America during the last 2000 years: synthesis and perspectives. Clim. Past Discuss. 11, 3475–3565.http://dx.doi.org/10.5194/cpd-11-3475-2015. Flenley, J.R., King, A.S.M., 1984. Late Quaternary pollen records from Easter Island. Nature
307, 47–50.http://dx.doi.org/10.1038/307047a0.
Gajewski, K., 2008. The Global Pollen Database in biogeographical and palaeoclimatic studies. Prog. Phys. Geogr. 32 (4), 379–402.http://dx.doi.org/10.1177/0309133308096029. Germeraad, J.H., Hopping, C.A., Muller, J., 1968.Palynology of Tertiary sediments from
Giesecke, T., Davis, B., Brewer, S., Finsinger, W., Wolters, S., Blaauw, M., de Beaulieu, J.-L., Binney, H., Fyfe, R.M., Gaillard, M.-J., Gil-Romera, G., van der Knaap, W.O., Kuneš, P., Kühl, N., van Leeuwen, J.F.N., Leydet, M., Lotter, A.F., Ortu, E., Semmler, M., Bradshaw, R.H.W., 2012. Towards mapping the late Quaternary vegetation change of Europe. Veg. Hist. Archaeobot. 23 (1), 75–86. http://dx.doi.org/10.1007/s00334-012-0390-y.
Goman, M., Joyce, A., Mueller, R., Paschyn, L., 2010. Multiproxy paleoecological recon-struction of prehistoric land-use history in the western region of the lower Rio Verde Valley, Oaxaca, Mexico. The Holocene 20 (10), 761–772.http://dx.doi.org/10. 1177/0959683610362811.
González, C., Urrego, L.E., Martínez, J.I., 2006. Late Quaternary vegetation and climate change in the Panama Basin: palynological evidence from marine cores ODP 677B and TR 163-38. Palaeogeogr. Palaeoclimatol. Palaeoecol. 234, 62–80.http://dx.doi. org/10.1016/j.palaeo.2005.10.019.
González, C., Dupont, L.M., Behling, H., Wefer, G., 2008. Neotropical vegetation response to rapid climate changes during the last glacial period: palynological evidence from the Cariaco Basin. Quat. Res. 69, 217–230.http://dx.doi.org/10.1016/j.yqres.2007.12. 001.
González-Carranza, Z., Hooghiemstra, H., Vélez, M.I., 2012.Major altitudinal shifts in Andean vegetation on the Amazonianflank show temporary loss of biota in the Holocene. The Holocene 22 (11), 1227–1241.
Gosling, W.D., Williams, J.J., 2013. Ecosystem service provision sets the pace for pre-Hispanic societal development in the central Andes. The Holocene 23 (11), 1619–1624.http://dx.doi.org/10.1177/0959683613496296.
Grabandt, R.A.J., 1985. Pollen rain in relation to vegetation in the Colombian Cordillera Oriental. Unpublished Ph.D. thesis, University of Amsterdam, The Netherlands. Grimm, E.C., Jacobson, G.L., 2004.Late-Quaternary vegetation history of the eastern
United States. Dev. Quat. Sci. 1, 381–402.
Grimm, E.C., Bradshaw, R.H.W., Brewer, S., Flantua, S., Giesecke, T., Lézine, A.-M., Takahara, H., Williams, J.W., 2013.Pollen methods and studies— databases and their applica-tion. In: Elias, Scott A. (Ed.), Encyclopedia of Quaternary Science, Second Edition Elsevier, Amsterdam, pp. 831–838.
Grimm, E.C., Blaauw, M., Buck, C.E., Williams, J.W., 2014. Age models, chronologies, and databases workshop. PAGES Magazine 22, 104.
Groot, J.J., Groot, C.R., Ewing, M., Burckle, L., Conolly, J.R., 1965. Spores, pollen, diatoms and provenance of the Argentine basin sediments. Prog. Oceanogr. 4, 179–217.http://dx. doi.org/10.1016/0079-6611(65)90050-9.
Groot, M.H.M., Bogotá, R.G., Lourens, L.J., Hooghiemstra, H., Vriend, M., Berrio, J.C., Tuenter, E., Van der Plicht, J., Van Geel, B., Ziegler, M., Weber, S.L., Betancourt, A., Contreras, L., Gaviria, S., Giraldo, C., González, N., Jansen, J.H.F., Konert, M., Ortega, D., Rangel, O., Sarmiento, G., Vandenberghe, J., Van der Hammen, T., Van der Linden, M., Westerhoff, W., 2011. Ultra-high resolution pollen record from the northern Andes reveals rapid shifts in montane climates within the last two glacial cycles. Clim. Past 7, 299–316.http://dx.doi.org/10.5194/cp-7-299-2011.
Haberle, S.G., Maslin, M.A., 1999.Late quaternary vegetation and climate change in the Amazon basin based on a 50,000 year pollen record from the Amazon Fan, ODP Site 932. Quat. Res. 51, 27–38.
Haug, G.H., 2003. Climate and the collapse of Maya civilization. Science 299, 1731–1735. http://dx.doi.org/10.1126/science.1080444.
Hermanowski, B., da Costa, M.L., Behling, H., 2012. Environmental changes in southeast-ern Amazonia during the last 25,000 yr revealed from a paleoecological record. Quat. Res. 77, 138–148.http://dx.doi.org/10.1016/j.yqres.2011.10.009.
Heusser, C.J., 1989.Late Quaternary vegetation and climate of southern Tierra del Fuego. Quat. Res. 31, 396–406.
Heusser, L.E., Shackleton, N.J., 1994.Tropical climatic variation on the pacific slopes of the Ecuadorian Andes based on a 25,000-year pollen record from deep-sea sediment core Tri-163-31B. Quat. Res. 42, 222–225.
Heusser, C.J., Heusser, L.E., Lowell, T.V., 1999.Paleoecology of the southern Chilean Lake District— Isla Grande de Chiloé during Middle-Late Llanquihue glaciation and deglaciation. Geogr. Ann. 81A (2), 231–284.
Hogg, A.G., Hua, Q., Blackwell, P.G., Niu, M., Buck, C.E., Guilderson, T.P., Heaton, T.J., Palmer, J.G., Reimer, P.J., Reimer, R.W., Turney, C.S.M., Zimmerman, S.R.H., 2013.SHCAL13 Southern Hemisphere calibration, 0–50,000 years cal BP. Radiocarbon 55 (4), 1889–1903.
Hooghiemstra, H., Wijninga, V.M., Cleef, A.M., 2006. The Paleobotanical record of Colombia: implications for biogeography and biodiversity. Ann. Mo. Bot. Gard. 93 (2), 297–324.http://dx.doi.org/10.3417/0026-6493(2006)93[297:TPROCI]2.0.CO;2. Hoorn, C., 1997.Palynology of the Pleistocene glacial-interglacial cycles of the Amazon
Fan (Holes 940A, 944A, and 946A). Proc. Ocean Drill. Program Sci. Results 155, 397–409.
Horn, S.P., 1985.Preliminary pollen analysis of Quaternary sediments from Deep Sea Drilling Project Site 565, western Costa Rica. Initial Rep. Deep Sea Drill. Proj. 84, 533–547. Huber, O., Riina, R. (Eds.), 1997.Glosariofitoecológico de las Américas. UNESCO:
Fundación Instituto Botánico de Venezuela, Caracas.
Huber, O., Riina, R. (Eds.), 2003.Glosariofitoecológico de las Américas. UNESCO, Corolab Humboldt, Paris.
Hughen, K., Lehman, S., Southon, J., Overpeck, J., Marchal, O., Herring, C., Turnbull, J., 2004.
14
C Activity and global carbon cycle changes over the past 50,000 years. Science 303, 202–207.
Iglesias, V., Whitlock, C., Bianchi, M.M., Villarosa, G., Outes, V., 2012. Climate and local con-trols of long-term vegetation dynamics in northern Patagonia (Lat 41°S). Quat. Res. 78, 502–512.http://dx.doi.org/10.1016/j.yqres.2012.07.004.
Iriarte, J., Behling, H., 2007. The expansion of Araucaria forest in the southern Brazilian highlands during the last 4000 years and its implications for the development of the Taquara/Itararé tradition. Environ. Archaeol. 12, 115–127.http://dx.doi.org/10. 1179/174963107x226390.
Iriarte, J., Power, M.J., Rostain, S., Mayle, F.E., Jones, H., Watling, J., Whitney, B.S., McKey, D.B., 2012. Fire-free land use in pre-1492 Amazonian savannas. Proc. Natl. Acad. Sci. 109, 6473–6478.http://dx.doi.org/10.1073/pnas.1201461109.
Jahnke, L., Asher, A.D., Keralis, S.D.C., Henry, C., 2012. The problem of data. Council on Library and Information Resources, Washington, DC Obtained from:http://www.clir.org/pubs/ reports/pub154/pub154.pdf.
Jansen, B., Van Loon, E.E., Hooghiemstra, H., Verstraten, J.M., 2010. Improved reconstruc-tion of palaeo-environments through unravelling of preserved vegetareconstruc-tion biomarker patterns. Palaeogeogr. Palaeoclimatol. Palaeoecol. 285, 119–130.http://dx.doi.org/10. 1016/j.palaeo.2009.10.029.
Kilian, R., Lamy, F., 2012. A review of Glacial and Holocene paleoclimate records from southernmost Patagonia (49–55°S). Quat. Sci. Rev. 53, 1–23.http://dx.doi.org/10. 1016/j.quascirev.2012.07.017.
Kohfeld, K.E., Harrison, S.P., 2000. How well can we simulate past climates? Evaluating the models using global palaeoenvironmental datasets. Quat. Sci. Rev. 19, 321–346. http://dx.doi.org/10.1016/S0277-3791(99)00068-2.
Leal Rodríguez, A.V., 2010. Historia holocena de la vegetación y el fuego en bordes sabana/ bosque y turberas de la Gran Sabana, Guayana Venezolana. Unpublished Ph.D. thesis. Universidad Simón Bolívar, Caracas, Venezuela.
Ledru, M.-P., Bertaux, J., Sifeddine, A., Suguio, K., 1998. Absence of Last Glacial Maximum Records in lowland tropical forests. Quat. Res. 49 (2), 233–237.http://dx.doi.org/10. 1006/qres.1997.1953.
Ledru, M.-P., Rousseau, D.-D., Cruz Jr., F.W., Riccomini, C., Karmann, I., Martin, L., 2005. Paleoclimate changes during the last 100,000 yr from a record in the Brazilian Atlantic rainforest region and interhemispheric comparison. Quat. Res. 64 (3), 444–450. http://dx.doi.org/10.1016/j.yqres.2005.08.006.
Ledru, M.-P., Jomelli, V., Samaniego, P., Vuille, M., Hidalgo, S., Herrera, M., Ceron, C., 2013. The Medieval Climate Anomaly and the Little Ice Age in the eastern Ecuadorian Andes. Clim. Past 9 (1), 307–321.http://dx.doi.org/10.5194/cp-9-307-2013. Lozano-García, S., Caballero, M., Ortega, B., Rodríguez, A., Sosa, S., 2007. Tracing the effects
of the Little Ice Age in the tropical lowlands of eastern Mesoamerica. Proc. Natl. Acad. Sci. 104 (41), 16200–16203.http://dx.doi.org/10.1073/pnas.0707896104. Maldonado, A., Uribe, M., 2012.Paleoambientes y ocupaciones humanas en tarapacá
durante el período formativo y comienzos del intermedio tardío. Presented at the XIX Congreso Nacional de Arqueología Chilena, Arica, Chile.
Maldonado, A., Betancourt, J.L., Latorre, C., Villagran, C., 2005. Pollen analyses from a 50,000-yr rodent midden series in the southern Atacama Desert (25° 30′ S). J. Quat. Sci. 20 (5), 493–507.http://dx.doi.org/10.1002/jqs.936.
Marchant, R., Hooghiemstra, H., 2004. Rapid environmental change in African and South American tropics around 4000 years before present: a review. Earth-Sci. Rev. 66, 217–260.http://dx.doi.org/10.1016/j.earscirev.2004.01.003.
Marchant, R., Behling, H., Berrio, J.C., Cleef, A., Duivenvoorden, J., Hooghiemstra, H., Kuhry, P., Melief, B., Van Geel, B., Van der Hammen, T., 2001.Mid-to Late-Holocene pollen-based biome reconstructions for Colombia. Quat. Sci. Rev. 20, 1289–1308. Marchant, R., Behling, H., Berrio, J.-C., Cleef, A., Duivenvoorden, J., Hooghiemstra, H.,
Kuhry, P., Melief, B., Schreve-Brinkman, E., Van Geel, B., Van der Hammen, T., Van Reenen, G., Wille, M., 2002. Pollen-based biome reconstructions for Colombia at 3000, 6000, 9000, 12000, 15000 and 1800014
C yr ago: Late Quaternary tropical veg-etation dynamics. J. Quat. Sci. 17 (2), 113–129.http://dx.doi.org/10.1002/jqs.669. Marchant, R., Cleef, A., Harrison, S.P., Hooghiemstra, H., Markgraf, V., Van Boxel, J.H., Ager,
T., Almeida, L., Anderson, R., Baied, C., Behling, H., Berrio, J.C., Burbridge, R., Björck, S., Byrne, R., Bush, M.B., Duivenvoorden, J., Flenley, J., De Oliveira, P.E., Van Geel, B., Graf, K., Gosling, W.D., Harbele, S., Van der Hammen, T., Hansen, B., Horn, S., Kuhry, P., Ledru, M.-P., Mayle, F.E., Leyden, B., Lozano-Garćia, S., Melief, A.M., Moreno, P., Moar, N.T., Prieto, A., Van Reenen, G., Salgado-Labouriau, M.L., Schäbitz, F., Schreve-Brinkman, E., Wille, M., 2009.Pollen-based biome reconstructions for Latin America at 0, 6000 and 18000 radiocarbon years ago. Clim. Past 5, 725–767.
Markgraf, V., Betancourt, J., Rylander, K.A., 1997. Late-Holocene rodent middens from Rio Limay, Neuquen Province, Argentina. The Holocene 7 (3), 325–329.http://dx.doi.org/ 10.1177/095968369700700308.
Markgraf, V., Whitlock, C., Haberle, S., 2007. Vegetation andfire history during the last 18,000 cal yr B.P. in Southern Patagonia: Mallín Pollux, Coyhaique, Province Aisén (45°41′30″ S, 71°50′30″ W, 640 m elevation). Palaeogeogr. Palaeoclimatol. Palaeoecol. 254, 492–507.http://dx.doi.org/10.1016/j.palaeo.2007.07.008.
Mayle, F.E., Langstroth, R.P., Fisher, R., Meir, P., 2007.Long-term forest-savannah dynam-ics in the Bolivian Amazon: implications for conservation. Proc. Natl. Acad. Sci. B 362, 291–307.
Michener, W.K., Brunt, J.W., Helly, J.J., Kirchner, T.B., Stafford, S.G., 1997. Nongeospatial metadata for the ecological sciences. Ecol. Appl. 7 (1), 330–342.http://dx.doi.org/ 10.1890/1051-0761(1997)007[0330:NMFTES]2.0.CO;2.
Monsalve, J.G., 1985.A pollen core from the hacienda Lusitania. Calima 4, 40–44. Montade, V., Nebout, N.C., Chapron, E., Mulsow, S., Abarzúa, A.M., Debret, M., Foucher, A.,
Desmet, M., Winiarski, T., Kissel, C., 2012. Regional vegetation and climate changes during the last 13kyr from a marine pollen record in Seno Reloncaví, southern Chile. Rev. Palaeobot. Palynol. 181 (1), 11–21.http://dx.doi.org/10.1016/j.revpalbo. 2012.04.005.
Montade, V., Combourieu-Nebout, N., Kissel, C., Haberle, S., Siani, G., Michel, E., 2013. Veg-etation and climate changes during the last 22,000 yr from a marine core near Taitao Peninsula, southern Chile. Palaeogeogr. Palaeoclimatol. Palaeoecol. 369 (1), 335–348. Montoya, E., Rull, V., 2011. Gran Sabanafires (SE Venezuela): a paleoecological perspec-tive. Quat. Sci. Rev. 30, 3430–3444.http://dx.doi.org/10.1016/j.quascirev.2011.09. 005.
Montoya, E., Rull, V., Stansell, N.D., Abbott, M.B., Nogué, S., Bird, B.W., Díaz, W.A., 2011. Forest–savanna–morichal dynamics in relation to fire and human occupation in the southern Gran Sabana (SE Venezuela) during the last millennia. Quat. Res. 76, 335–344.http://dx.doi.org/10.1016/j.yqres.2011.06.014.