HAL Id: hal-02936641
https://hal.archives-ouvertes.fr/hal-02936641
Submitted on 11 Sep 2020
HAL is a multi-disciplinary open access
archive for the deposit and dissemination of
sci-L’archive ouverte pluridisciplinaire HAL, est destinée au dépôt et à la diffusion de documents
Variable Crustal Production Originating From Mantle
Source Heterogeneity Beneath the South East Indian
Ridge and Amsterdam-St. Paul Plateau
A.L.R. Sibrant, M. Maia, E. Mittelstaedt, D.W. Graham
To cite this version:
A.L.R. Sibrant, M. Maia, E. Mittelstaedt, D.W. Graham. Variable Crustal Production Originating From Mantle Source Heterogeneity Beneath the South East Indian Ridge and Amsterdam-St. Paul Plateau. Geochemistry, Geophysics, Geosystems, AGU and the Geochemical Society, 2019, 20 (11), pp.4635-4653. �10.1029/2019GC008419�. �hal-02936641�
Sibrant Aurore (Orcid ID: 0000-0001-5623-2976) Mittelstaedt Eric (Orcid ID: 0000-0002-5207-2546)
Variable crustal production originating from mantle source heterogeneity beneath the South East Indian Ridge and Amsterdam-St. Paul Plateau
A.L.R. Sibrant1*, M. Maia2, E. Mittelstaedt3, D. W. Graham4
1. Univ Brest, Laboratoire Géosciences Océan, UMR6538, F-29280 Plouzané, France. 2. CNRS, Univ Brest, Laboratoire Géosciences Océan, UMR6538, F-29280 Plouzané, France.
3. Department of Geological Sciences, University of Idaho, Moscow, Idaho, USA.
4. College of Earth, Ocean, and Atmospheric Sciences, Oregon State University, Corvallis, OR97331, USA.
* email : aurore.sibrant@u-psud.fr
The Amsterdam-St. Paul (ASP) Plateau formed by interaction between the South East Indian Ridge (SEIR) and the ASP mantle plume during the last 10 Myr. The combined bathymetry and gravity-derived crustal thickness anomalies along the present and paleoaxes of the SEIR atop the plateau indicate: (1) a thicker crust and shallower water depth along the southern part of segment I2 during much of the last 10 Myr; (2) an earlier decrease (~1.4 Ma) in crustal thickness along the southern part of I2 compared to the northern part (~0.9 Ma) during the most recent period of reduced magmatism; (3) a topographic transition at ~0.7 Ma and during the last 0.1 Myr; and (4) an approximately uniform crustal thickness (8 km) along the entire I2 segment today. These observations require spatial and temporal variations in magma production during construction of the ASP Plateau over the last 3 Myr. We propose that during periods of weaker plume magma flux, spatial variations in upper mantle temperature
and composition are small, and lead to small variations in crustal thickness along-axis. In contrast, during periods of stronger plume magma flux, spatial contrasts in upper mantle temperature and composition (fertility) are large, leading to significant variations in crustal thickness. Along-axis variations of 3He/4He, Δ8/4Pb, K/Ti, and Na8
in “zero-age” basalts indicate that there is a gradient in the underlying mantle material, from a “common” mantle plume component (Δ8/4Pb~60) stronger in the north to a DUPAL component (Δ8/4Pb~110) dominating in the south.
keywords:
oceanic plateaus, plume-ridge interaction, Amsterdam St. Paul Plateau, South East Indian Ridge, geophysical and geochemical evidence
key points:
- Crustal architecture of the Amsterdam St. Paul Plateau records high and low plume flux stages during mantle plume-spreading ridge interaction
- Plume magma flux decreased earlier in the south than in the north along a single spreading segment.
- Along-axis differences in crustal thickness and Pb and He isotopes suggest both shallow mantle and plume heterogeneities.
1 Introduction
Mantle hotspots have long been known to interact with nearby spreading centers and the overlying lithosphere (e.g. Morgan, 1978; Ito et al., 2003). When enough mantle hotspot material is drained toward the ridge axis, a large increase in crustal production can lead to the construction of oceanic plateaus such as Iceland (e.g. Johnson et al., 1972) and the Azores (e.g. Gente et al., 2003). Much of our understanding of mantle plume-spreading ridge interactions comes from the morphologic evolution of oceanic plateaus over time scales of a few millions to tens of millions of years (Schilling, 1985; 1991).
Indeed, the physical (size, morphology, structure) and geochemical characteristics of ridge-related oceanic plateaus depend on the strength of the interaction between plume and ridge and, thus, on the characteristics of both (e.g. Morgan, 1978; Vogt, 1976 ; Ito et al., 2003). For example, variations in plume magma supply (Cannat et al., 1999; Allen et al., 2002; Maia et al., 2000; 2007) can modify sub-axial mantle temperature (McKenzie, 1984; Klein and Langmuir, 1987), axial morphology (Phipps Morgan and Chen, 1993; Canales et al., 1997), and segment length (e.g. Hey et al., 1977; Karsten and Delaney, 1989), as well as potentially promote ridge jumps toward nearby plumes (Hardarson et al., 1997; Maia et al., 2011; Mittelstaedt et al., 2011). Moreover, oceanic plateau basalts are commonly more enriched in incompatible elements (such as K or Na) and show distinct Sr, Pb and He isotopic signatures compared to mid-ocean ridge basalts (Schilling, 1985; Schilling et al., 1982). Thus, the study of ridge-related oceanic plateaus also provides a means to evaluate the origin of these magmatic features and gain insight into the dynamics of plume-ridge interaction and mantle heterogeneity. However, information on finer time-scale resolutions (sub-million year scales) of ridge-plume interactions and plateau evolution is far less frequent.
The 10 Myr old Amsterdam-St. Paul (ASP) Plateau (Figure 1) lies along the intermediate spreading (full-rate of 65 mm/yr) South East Indian Ridge (SEIR). It is located astride two short ridge segments (I1 and J1, 20 and 30 km long respectively) that bracket a longer segment (I2, 100 km) around which most of the plateau has formed during the last 10 Myrs (Figure 1). The ASP Plateau is presently in a period of diminishing plume-ridge interaction indicated by a decrease in axial crustal thickness since 1.4 Ma. Using high-resolution bathymetric (gridded at 200 m) and gravity data (gridded at 1 km) as well as magnetic anomalies from the PLURIEL (Sep/Oct 2006) and BOOMERANG 06 expeditions (Feb/Apr 1996) (Scheirer et al., 2000; Maia et al., 2011) , we present a detailed analysis of the Amsterdam-St. Paul Plateau and of the morphological evolution of the SEIR axis during the last 3 Myr. The observations at this scale reveal temporal variations in ridge-axis morphology and in crustal thickness perpendicular to, and along the axis of, the SEIR atop the ASP Plateau and reveal a complex interaction between the ASP plume and the ridge. To assess the role of along-axis variations in mantle source on the above observations, we use a combination of published geochemical data (Graham et al., 1999; Nicolaysen et al., 2007;
Loewen et al., 2019; approximately 10 km sampling) and five new He isotopic analyses. With this combined data set, we review several hypotheses to explain each plateau characteristic. Comparisons of geochemical data with bathymetric and gravity data reveal that both the ASP plume and the ambient shallow upper mantle exert considerable influence on crustal production. Specifically, crustal thickness variations perpendicular to the ridge axis can be explained by recurring increases and decreases in the rate of plume upwelling, while along-axis crustal variations may be governed by small scale spatially distributed mantle heterogeneities in the upper mantle and in the plume.
2 The Amsterdam – St. Paul Plateau
The ASP Plateau straddles the SEIR, which separates the Australian plate to the northeast from the Antarctic plate to the southwest (Figure 1). The oldest portion of the plateau formed between 10 and ~3 Ma and is bounded by the Amsterdam and St. Paul fracture zones, respectively to the north and the south (Maia et al., 2011). Between SEIR segments H and I1, the Amsterdam transform fault (AFZ) defines the northern boundary of the younger portion of the plateau, whereas the overlapping and propagating ridge segments J1 and J2 define the southern boundary (Scheirer et al., 2000). Within the plateau, segments I1 and I2 are separated by a recently formed small discontinuity, the Boomerang transform (BTF, Scheirer et al., 2000). Segment I2 is composed of two parts: a northern short section (20 km long) and a southern, longer section (100 km long) that terminates in the south at the narrow Hillegom transform (HTF), the remaining active portion of the Saint Paul Fracture Zone (SPFZ, Conder et al., 2000). Our study focuses on the longer portion of the segment I2. Due to its anomalously thick crust (up to 12 km, Maia et al., 2011), negative mantle Bouguer gravity anomaly (Scheirer et al., 2000), and high 3He/4He ratios up to 14 times the atmospheric value (~14 Ra) (Graham et al., 1999 ; Nicolaysen et al., 2007), several authors propose a plume origin for the plateau (e.g. Graham et al., 1999; Johnson et al., 2000). However, the chemical and physical influence of the ASP plume only spans ~340 km along the SEIR (Graham et al., 1999), indicating a relatively small melting anomaly that is ~80 km in diameter (Maia et al., 2011).
Maia et al. (2011) conclude that the ASP Plateau had a multistage history that was dependent upon the interaction between the northeastward migrating SEIR (35 mm/yr; Conder et al., 2000) and a variable flux mantle plume. Construction of the plateau occurred during stages of relatively high and relatively low axial magma flux. Stage A (~9.7 – 6.3 Ma) was associated with a high magma flux and corresponded to the early interaction of the plume and ridge. During this period, the plume center was NE of the SEIR and the plume-ridge distance progressively decreased while melt supply at the axis increased. The high magma fluxes yielded construction of a thick crust (~10 km) and smooth surface topography (Figure 1, Area A). Stage B began at 6.3 Ma with a southwestward jump of the ridge axis away from the ASP hotspot, which increased the plume-ridge distance and led to a decrease in the along-axis magmatic budget (Figure 1, Area B), as evidenced by thinner crust (~7 km). The lower axial magma flux coincided with deeper, rougher bathymetry and several V-shaped abyssal hills indicating along-axis propagation of changes in magma supply. Stage C began with a second southwestward ridge jump at 3 Ma (Figure 1, Area C), which caused the axis to nearly overlie the plume center. The ridge-centered plume initiated a second high magma flux period, strongly increasing the crustal thickness (~11 km). During this stage, the ridge migrated away from the plume center causing a decrease in magma supply as indicated by thinner crust (~8 km). Finally, stage D coincides with a modern, lower magma supply beginning 1.4 Ma (SE compartment) to 0.9 Ma (NW compartment). This lower magma supply has led to recent changes in faulting style of the ASP Plateau (Figure 1, Area D). Here, we focus on the role of the modern low-magma supply period on the evolution of the ASP Plateau since 3 Ma, including the recent rifting event.
3 Methodology
3.1 Geophysical Results
We use shipboard bathymetry and age derived from magnetic anomalies to calculate a residual bathymetry on the whole ASP Plateau (Figure 2). The magnetic anomaly was computed from the IGRF4505 model by Courrèges (2010). That study also provided detailed
identification and interpretation of the magnetic anomalies. Residual bathymetry was calculated by subtracting the expected thermal subsidence of the seafloor (Parson and Sclater, 1977) using a value of 342 m/Myr for the subsidence coefficient (Stein and Stein, 1992) and an average axial depth of 2600 m from the original bathymetry. To calculate the Mantle Bouguer Anomaly, we subtract from the free-air anomaly the gravity effects of the seafloor-water (density contrast, Δρ=1770 kg/m3) and crust-mantle (Δρ=500 kg/m3) interfaces assuming a constant crustal thickness of 6 km. The Residual Mantle Bouguer Anomaly (RMBA) is obtained after removal of the effect of lithosphere cooling using an age grid as in Maia et al. (2011) and is then inverted for variations in crustal thickness assuming a constant density in both crust and mantle (e.g., Kuo and Forsyth, 1988).
3.2 Helium Isotope Analyses
Five basalt samples along the present day ridge axis in the study area were analyzed for
3
He/4He and vesicle [He] to supplement the existing helium isotope data from Graham et al. (1999) and Nicolaysen et al. (2007). The samples were recovered by the Boomerang 06 expedition, and include two fresh basalts from the axial valley of segment I2 (D65 and WC36), a basalt from segment J1 (WC32) and two aphyric pillow basalts from the axial valley of segment J2 (D50 and WC23). Large chips of glass were crushed to several mm in size and the freshest material was hand picked using a binocular microscope to avoid visible oxidation and alteration. The chips were ultrasonically cleaned in deionized water followed by acetone, and air dried. The samples were then placed in an ultra-high-vacuum crusher for helium measurements, and crushed 75 times using a magnetic piston actuated by external solenoids. Sample weights ranged between 130 and 215 mg. The samples were analyzed at Oregon State University following procedures described in Graham et al. (2014). The results were compiled with previous 3He/4He, K/Ti and Na8 on-axis data from Graham et al. (1999),
Douglas-Priebe (1998) and Nicolaysen et al. (2007). H2O/Ce ratios are from Loewen et al.
(2019), and Δ8/4 following Hart (1984) was computed from the Pb isotope data of Nicolaysen et al. (2007). The compiled results are reported in supplementary material
Some older to zero age samples are available (WC45; WC44; WC34; D58-1; D58-4 and D24) and could be useful in order to better constrain the evolution of the geochemical sources through time. This statement is true only if samples reflect the lithosphere at the time when they built or if geochronological are available. Sample D24 is a dredge rock collected from a seamount and was dated at ~5 Ma (Janin et al., 2011) but is emplaced on a younger age crust. So according to Janin et al., (2011) this age is false and cannot be linked to geophysical observations. The remaining five other samples sit on the south to the ridge portion of the plateau (WC45; WC44; WC34; D58-1; D58-4), where off-axis seamounts overprint magnetic anomalies of the lithosphere. In the absence of age calibration of those specific samples, it is very delicate to discuss the significance of their geochemical composition relative to geophysical observations and to evolution of the plateau. Therefore, we chose to be cautious and not include these samples in the present study.
4 Geometry, morphology and inner structure of the ASP Plateau
Structural analyses and cross sections (Figure 3) from our new map of residual bathymetry (Figure 2) provide important constraints on the evolution of the ASP Plateau and its recent change in rifting behavior. The stage C (Area C) displays a regularly-spaced abyssal hill fabric parallel to both magnetic anomalies and the current ridge axis (N145°E). The southern portion of Area C hosts abyssal hills (Figure 3, “LA”) up to 300 m high, 4 to 7 km wide in the across axis direction, and separated by short sections of flat topography. The northern part of Area C hosts abyssal hills up to 400 m high, 5 to 10 km wide, and oriented oblique to the strike of the SEIR. The associated graben displays a similar variation in orientation reflecting abandoned spreading segments corresponding to aborted propagation (Deschamps et al., 2008). The transition between axis parallel to axis oblique abyssal hills from south to north is diffuse and marked by the presence of punctuated off-axis small volcanoes. These volcanoes define a line across the plateau (Figure 1), perpendicular to the segment I2 axis, that separates the plateau into two structurally distinct compartments: the NW and the SE compartment (Figure 1, 2 and Figure SM1; Maia et al., 2011). Structural
variations between compartments are also observed at the transition between the stage C and stage D (Area C and D).
The transition from the stage C to stage D is marked by an abrupt break in the bathymetry as indicated by a sudden deepening of the seafloor by ~500 m (Figure 3). The bathymetric break is farther from the ridge axis in the SE compartment (~25 km) than in the NW compartment (~6 km) and corresponds to a change in the style of rifting of the plateau. This change in rifting style (stage D) occurs earlier in the SE compartment (~0.7 Ma) than in the NW compartment (~0.1 Ma). The shape of the rifting boundary is sigmoidal with the boundary roughly following the ridge axis until undergoing a sudden s-shaped curve at the diffuse boundary between the two compartments (Figure 2). To the southwest of the break in bathymetry, the deeper, rougher bathymetry is characterized by a succession of small, regularly spaced abyssal hills (Figure 3, “A”; 30 - 100 m high and 2 – 5 km wide) and grabens. The abyssal hills strike parallel to the ridge axis and extend to the north from 0.7 to 0.1 Ma. Since the last 0.1 Ma, abyssal hills strike parallel to the ridge and occur along the complete I2 segment of the SEIR.
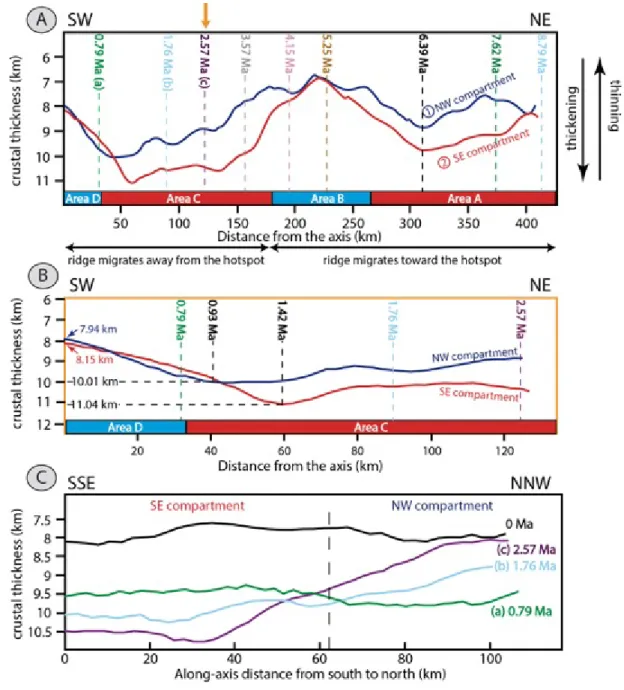
The structural architecture of the crust is further constrained by variations in gravity-derived crustal thickness (Figure 4). Cross-sections perpendicular to the ridge axis show that periods of positive relative depth anomalies correspond to periods of relatively thick crust between 8-6 Ma and 1-3 Ma (Figure 4a). Together, these observations indicate two periods of strong magmatic activity along the SEIR axis corresponding to Areas A and C and separated by Area B, where negative depth anomalies and relatively thin crust suggest a decreased magma supply (Maia et al., 2011). The transition between the earlier highly magmatic and less magmatic stages (Stage A to Stage B) is marked by decreases in crustal thickness. The decrease starts synchronously in the NW and SE compartments at ~6.39 Ma. During highly magmatic stages (Stages A and C), crustal thickness in the NW and SE
compartments reach up to 8.75 km and 10 km respectively in Area A, and up to 10 km and 11 km respectively in Area C, with crustal thickness being generally less in Area A than in Area C (Maia et al., 2011). Moreover, over the last 9 Myr the SE compartment of the spreading segment I2 displays thicker crust and shallower depths than the NW compartment except around 5 Ma.
Since 3 Ma, gravity-derived crustal thicknesses increased and then decreased prior to the most recent change in faulting style of the ASP Plateau (Area D, Figure 4b). Crustal thickness began decreasing in Stage D, but this occurred earlier in the SE (~1.42 Ma) than in the NW (~0.93 Ma). The sudden deepening in residual bathymetry and decrease of crustal thicknesssuggest a reduced supply of melt along the ridge axis and mark the transition from a highly magmatic stage to the current, more rifting dominated stage. The onset of reduced magma supply in the south happened at 1.42 Ma, while melt production remained high in the north until 0.93 Ma. Since 0.93 Ma, crustal thickness in the NW and SE compartments has been comparable (~10 km) and diminished with a similar rate, and the distinction between both compartments is no longer significant. Together, along-axis crustal thicknesses and residual depths suggest that changes to the basal topography of the crust through time were modulated by changes in axial melt production. Between 2.57 and 1.76 Ma, the crust was thicker in the SE than in the NW compartment. This gradient in crustal thickness can be interpreted as a basal crustal slope, and results in an average basal northern upslope estimated between 2.2° and 1.3°. The angle of the basal slope decreased over time, seemed to reverse at 0.79 Ma, and is absent beneath the present-day axis (Figure 4c).
For comparison, the segments outside the study area (H to the north, and J1 and J2 to the south), show current residual depth and gravity-derived crustal thicknesses that are somewhat greater than expected for spreading ridges having no hotspot influence (e.g. Schilling, 1991). Segment H is characterized by average residual depths of -560 m but it has a normal crustal thickness of 6 km. Segments J1 and J2 are characterized by average residual depths of -100 to 200 m and crustal thickness of 7 - 8 km. However, comparable off-axis surveys are not available in the H and J1, J2 regions to provide a temporal resolution similar to what is available in the I1 and I2 tectonic corridors of this study.
5 Ridge, plume, and mantle source control on the development of the plateau
The residual bathymetric observations and gravity-derived crustal thickness indicate that the 3D morphological architecture of the plateau is controlled by differences in melt production. The timing and intensity of volcanism due to plume-ridge interaction evolved both temporally and spatially, leading to variations in melt production that were both perpendicular and parallel to the ridge axis. Thus, the following questions arise: 1) What factors control the morphology of the ASP Plateau and the variation in strength of the plume-ridge interaction? 2) How did the morphology of the plateau evolve relative to mantle upwelling rate, the geometry of the ridge axis, and the distance between the plume and the ridge? 3) What are the roles of spatial and temporal differences in mantle source composition? 4) Are the above factors capable of producing the observed changes in crustal thickness both perpendicular and parallel to the ridge axis? In the next sections, we will attempt to answer these questions and discuss processes that may influence the evolution of the melt production at the ridge axis.
5.1 Variation in melt production through time
Geophysical data presented in this paper are consistent with the formation of the ASP Plateau as resulting from the interaction between the ASP plume and the SEIR. The ASP plume provided excess melt that produced anomalous bathymetry and excess crust (Zhao, 2007). The temporal changes in crustal thickness suggest a variable rate of plume upwelling, which would yield changes in melt production at the ridge axis. Possible causes for such temporal variations in the plume upwelling rate include the balance between the tectonic extension and magmatic accretion (Buck et al., 2005), or long period (e.g., ~3-20 Myr) oscillations in the plume conduit (Whitehead, 1982). Additionally, over a plume/ridge interaction period of ~10 Myr, the relative motion (direction and velocity) and the distance between the spreading ridge and the plume center may also influence the rate of melt production (e.g. Ito et al., 1997; Ribe and Delattre, 1998).
The ASP Plateau is characterized by highly variable seafloor morphologies marked by a succession of abyssal hills and grabens (Maia et al., 2011). The development of an axial high (i.e. hills) or axial valley (i.e. grabens) depends on lithosphere temperature and on melt availability (e.g., Chen and Lin, 2004) and also on the rate of dyking relative to tectonic extension (Ito and Behn, 2008). which will be influenced by variations in plume upwelling rate. Indeed, numerical models that simulate a robust melt supply by frequent dike injections that accommodate plate separation, and low melt supplies that accommodate plate separation tectonically by passive stretching and faulting of the lithosphere, suggest that magmatic accretion is a strong control on axial morphology (Buck et al., 2005; Behn and Ito, 2008). The models are quantified primarily by using a ratio of magmatic to tectonic axial accretion (M). In terms of mechanical deformation, recent analogue modelling indicates the predominant behavior of axial lithosphere during failure is either brittle or plastic (Sibrant et al., 2018). This deformation behavior is described by the axial failure parameter (πF): plastic
failure occurs at magmatically robust conditions involving dike intrusion, while brittle failure occurs at magmatically poor ridges where faulting dominates. A change from robust magmatism associated with large volcanic highs to a more faulted terrain with small abyssal hills as magma supply diminishes is consistent with a decrease in “M” (less magmatically robust) and increase in “πF” (thick elastic axial lithosphere) as observed in the Azores
(Cannat et al., 1999). For the recent evolution of the ASP Plateau, crustal thickness began decreasing at ~1.42 Ma and at ~0.93 Ma, in the SE and NW compartments (Figure 4b), while the topographic transition between the magmatic stage C and the less magmatic stage D occurred at ~0.7 Ma and ~0.1 Myr. This suggests that the shift in axial deformation from more plastic with fewer faults (low “πF”, high “M”) to more brittle with larger faults (higher
“πF”, lower “M”) required ~700 kyr.
At a larger scale, during the last 10 Myr the two periods of increased melt supply (Stage A and Stage C) are separated by a low magmatic phase over a time span of ~3 Myr (Stage B). Temporal variation in plume upwelling has been suggested for several plumes, such as Hawaii, Tristan da Cunha, and Iceland (Schilling and Noe-Nygaard, 1974; Hanan and Schilling, 1997; Weiss et al., 2016; Adam et al., 2007; Ito, 2001). Such “plume pulses” may
occcur with regular recurrence periods that differ between plume localities. Investigations of conduit dynamics show that under some conditions, which may prevail in the mantle, plumes are neither steady nor uniform (Whitehead, 1982; Scott et al., 1986). A variety of buoyancy-driven instabilities could disrupt continuous conduits into arrays of discrete diapirs or blobs. These instabilities could by caused by bending of the conduit by more than 60° (Whitehead, 1982) due to large-scale mantle circulation (Olson and Singer, 1985; Steinberger, 2000). Such instabilities are predicted to occur over relatively long periods of 10-20 Myr, although recent numerical simulations suggest that inclusion of appropriate mantle rheological behavior can result in shorter periods (~3-8 Myr; Neuharth and Mittelstaedt, 2017). In addition, unsteady behavior is observed within experimental plume conduits, in the form of vertically propagating variations of conduit diameter and discharge (Scott et al., 1986; Schubert et al., 1989; Maiden and Hoefer, 2016). These disturbances occur as large-amplitude solitary waves with an oscillation period of 3 to 6 Myr (Adam et al., 2007). Those oscillations may also induce geochemical variations in Pb isotopes (e.g, Iceland; Hanan and Schilling, 1997) and rare earth elements contents (e.g, Faeroe Islands; Schilling and Noe-Nygaard, 1974). A period of ~3 Myrs is consistent with the duration of Stage B on the ASP Plateau and corresponds to temporally varying magma flux predicted by laboratory and numerical modelling. Therefore, the ~3 Myrs oscillations observed in the construction of the ASP Plateau could correspond to variations in the ASP plume flux, as previously suggested by Maia et al. (2011).
Bathymetry and gravity-derived crustal thickness also indicate that the crust is thinner during Stage A (Area A) than Stage C (Area C, Figures 1 and 4). This difference may reflect the increased plume-ridge separation during formation of Area A than during formation of Area C. Results of numerical models indicate that ridge migration relative to a plume can affect the duration and the strength of the connection to the ridge. Indeed, maximum interaction distance is predicted to be higher for a ridge receding from a plume than for a ridge approaching a plume (Schilling, 1985; Ito et al., 1997; Ribe and Delattre, 1998). Studies of the interaction between the Foundation Seamounts mantle plume and the Pacific-Antarctic ridge where the ridge is currently approaching the plume confirm the model results (Maia et al., 2000; 2001). Consequently, for a given plume-ridge distance, the connection is stronger
(i.e., more plume material reaches the axis) when the ridge is migrating away from the plume and this will generate a thicker crust. Plate reconstructions suggest that the ASP plume was ridge-centered at ~4 Ma (Maia et al., 2011). During Stage C from 3.75 to 1 Ma), the distance between the hotspot and the ridge increased, forming a thicker crust than during Stage A (from 9 to 6.3 Ma), which was a period when the ridge was moving towards the plume (Maia et al., 2011). From this observation, it seems reasonable to infer that the difference in crustal thickness between these two periods of construction reflects how the SEIR was migrating relative to the ASP plume.
To summarize, we propose that the variation of the melt production through time (i.e. perpendicular to the ridge axis) was controlled by periodicity in plume upwelling coupled with changing plume-ridge distance. However, these do not account for the observed variations in along-axis crustal thickness and morphology. Indeed, plate reconstructions indicate ridge migration was perpendicular to the axis direction, and interaction with the plume’s central axis was along segment I2 (Figure 1, Maia et al., 2011). The plume center was at an equal distance from both I2 compartments (61 km and 58 km) and thus, variation in plume upwelling should have shown a similar strength along the entire segment I2. The distinct compartmentalization and particularly the progressive northward rifting may relate to an intrinsic characteristic such as tectonic segmentation of the ridge (e.g. Carbotte et al., 2004), or to along-axis differences in melt transport (Magde and Spark, 1997; Braun and Sohn, 2003), both of which would depend on the architecture of the lithosphere. Alternatively the compartmentalization may result from compositional/lithologic heterogeneities in either the plume, the upper mantle, or both (e.g. Schilling et al., 1982; Schilling et al., 1983; Cushman et al., 2004; Nicolaysen et al., 2007).
5.2 Along axis variation of melt production
Differences in melt production along the ridge axis (i.e. parallel to the magnetic anomalies) have been variable through time and separate segment I2 into two compartments. During the robust magmatic stages, abyssal hills are larger and the crust is thicker in the SE than in the NW. Moreover, the most recent stage of low magma supply began earlier in the
SE (~1.47 Ma) than in the NW (~0.93 Ma). This last observation is particularly enigmatic and the following section discusses several possible hypotheses to explain this difference in melt supply along segment I2.
The above distinctions between crustal compartments may have been caused by recent reorganization in the geometry of the SEIR. Previous studies suggest that the progressive south to north change in faulting style of the ASP Plateau during the last 1 Myr was induced by a ridge instability, such as a ~90 km ridge jump (Conder, 2000) or ridge propagation of the I2 SEIR segment (Maia et al., 2011). A ridge jump would be inferred from a blending in age of the magnetic anomalies, while ridge propagation would be seen in the progressive increase of the length of the magnetic anomalies through time. Both types of ridge instability have been suggested based on irregular magnetic anomaly patterns, and have been observed along plume-affected ridges such as the intermediate spreading Galápagos Spreading Center close to the Galápagos hotspot (Hey and Vogt, 1977; Hey et al., 1977; Mittelstaedt et al., 2012), and along the slow spreading southern Mid-Atlantic ridge at 9°S near Ascension Island and at 16°S near St. Helena (Brozena and White, 1990). However, the regular decrease in age of magnetic anomalies on the ASP Plateau toward the axis, and their quasi constant geometry indicates that the current pattern of segmentation along this portion of the SEIR has remained stable since ~3.6 Ma (Figure 2 and SM1).
5.2.1 Influence of sub-axial lithosphere structure on crustal accretion.
It has been suggested that melt can be collected at an impermeable boundary at the top of the melting column and then migrate laterally along this sloping boundary toward the ridge (Sparks and Parmentier, 1991, Sparks et al., 1994). Moreover, 3-D numerical models predict that ridge segmentation can induce melt focusing not only toward but also along the axis (e.g. Hebert and Montési, 2011). For example, at the slow-spreading Mid-Atlantic Ridge, Magde and Sparks (1997) argued that melt migration along a permeability barrier generates more realistic variations in crustal thickness than diapiric instabilities. This permeability barrier is believed to form at the top of the melting column by a multi saturation point of plagioclase
and pyroxene (Montési et al., 2011). Following this idea, plume melts could migrate buoyantly beneath the ridge axis until reaching the shallowest part of the axial lithosphere.
Here, we first consider a model where the crustal thickness depends only on mantle temperature (Klein and Langmuir, 1987) and that the thermal anomaly also corresponds to a change in lithosphere thickness. Along segment I2 between 2.57 and 1.76 Ma, the crust is thicker in the SE (11 ± 0.6 km) than in the NW compartment (10 ± 0.4 km) resulting in a basal northern upslope that is between 2.2° and 1.3°. Based upon the evolution in crustal thicknesses, the angle of the basal slope decreased over time, reversed at 0.79 Ma, and is absent beneath the present-day axis (Figure 4c). Assuming a uniform distribution of fertile plume material beneath the axis, the crustal thickness difference between the SE and NW compartments requires an ambient mantle temperature difference between the compartments of ~30°C to ~50°C at ~2.57 Ma, depending on the model used (Chen, 1996; McKenzie, 1984). This thermal difference can be converted to an axial lithospheric thickness difference using a 1D advection-diffusion solution (Mjelde et al., 2008) with a thermal diffusivity of κ=10-6
m2/s (Turcotte and Schubert, 2002); and considering that the mantle rises under the axis with a velocity equal to the half-spreading rate V/2 (with V= 65 mm/yr). The axial lithospheric thickness can be estimated by:
Zaxis = −2 κV log (TTc0−T−Tmm),
where Tm = 1470°C is the ambient mantle temperature (Dalton et al., 2014), T0= 0°C is the
surface temperature, and Tc=650°C is the assumed temperature of the brittle-ductile
transition. The difference in lithospheric thickness (ΔZ) between the SE and the NW compartments estimated using the above mantle temperature difference (Tm+ ΔT) is between 4 and 11 m, resulting in a basal southern upslope that is only between 0.003° and 0.009°).
Along segment I2, the shallowest part of the lithosphere corresponds to a thicker crustal compartment, i.e. the SW compartment. Based upon the above considerations, we suggest that it is unlikely that thermal anomalies or lithospheric slopes along the I2 segment can explain a crustal thickness variation of 1 km. The lithospheric thickness variations and slopes estimated from the equation of Mjelde et al. (2008) correspond to an upper bound,
since changes in the composition of the mantle as well as isostatic compensation were not taken into consideration.
5.2.2 Variable influence of the Amsterdam-St. Paul mantle plume along the SEIR
Differences in melt supply between the NW and SE compartments on the plateau could potentially result from local variability in the ASP plume at the ridge segment scale or less (~10-100 km; e.g. Schilling, 1991; Cannat et al., 1999; Chen and Lin, 2004). Plume influence and strength can be tracked through the amplitude of physical and chemical anomalies along the spreading ridge. For example, the presence of elevated ratios of 3He/4He and incompatible elements such as K/Ti are believed to be reliable indicators of enriched plume material (Kurz et al., 1982; Lupton, 1983). Basalts along segment I2 show a peak in both of these ratios at the transition between the NW and SE compartments (Figure 5). Higher 3He/4He (11.1 - 12.2 RA) and K/Ti (0.51 - 0.61) ratios are present at the center of the
I2 segment while lower 3He/4He (8 -9.5 RA) and K/Ti (0.2 - 0.3) ratios are present along
segments I1, J1 and J2 outside the main part of the ASP Plateau. In contrast, and somewhat surprisingly, 3He/4He ratios extend to higher values (14 RA) along segment H immediately to
the north of the plateau. This elevated 3He/4He anomaly was attributed to pollution of the sub-ridge mantle beneath segment H by distal, cooler portions of the plume that were less depleted by melting, compared to the core of the plume, centered beneath the plateau and influencing segment I2 (Graham et al., 1999). The peak in 3He/4He and K/Ti at the transition between the NW and SE compartments, therefore, seems to correspond to the location of the strongest plume influence along the SEIR axis.
In Figure 5, the peak in 3He/4He at the transition between the compartments does not correspond to a peak in crustal thickness. Indeed, the crustal thickness in the NW and SE compartments is effectively the same (~8 km). This observation indicates that the ASP plume may be weaker at present than in the past and may be incapable of producing large crustal anomaly differences near the center of the ASP plume. This assumption can be further tested
using basalt Na8 contents (Figure 5). Assuming a relatively uniform Na concentration in the
underlying mantle peridotite (Klein and Langmuir, 1987; Langmuir et al., 1992), a higher Na8
content in basalt reflects a smaller extent of melting (from cooler mantle), while lower Na8
reflects a larger extent of melting (from warmer mantle). The Na8 contentsof zero-age basalts
erupted along segments I1, I2 and J1 atop the ASP Plateau show considerable variability, and are not correlated with the crustal thickness variation (Figure 5). The most obvious feature is a transition from lower values along segment I2 to higher values along segment J1. This abrupt transition is inconsistent with the comparable crustal thicknesses between SW-I2 and J1 segments. However, the transition is consistent with larger extents of melting along segment I2 compared to segments J1 and J2. Within segment I2 itself the Na8 values are
variable and appear to show a weak gradient from higher values in the NW to lower values in the SE (Figure 5). The lowest Na8 along I2 does not occur in basalts with the highest K/Ti
and 3He/4He ratios, where the plume influence is postulated to be greatest. Also, the highest
3
He/4He and K/Ti ratios along segment I2 are not accompanied by a thick zero-age crust (Figure 4c). Both crustal thickness and Na8 indicate that the peaks in 3He/4He and K/Ti do
not necessarily correspond to an increase in the extent of partial melting related to an increase in mantle temperature, but instead may be a localized feature marking an increased contribution from distinct/heterogeneous plume material to the sub-ridge mantle beneath segment I2. Such interspersed features may also account for variability of the ratios measured within each area. For example, the NW compartment shows K/Ti ratios between 0.3 and 0.5. Furthermore, in conjunction with the 3He/4He variations, the hydrogen isotope compositions (δD) of ASP basalts suggest that the ASP plume contains a mixture of recycled lithospheric material and primordial mantle (Loewen et al., 2019). Altogether, the variability in 3He/4He, K/Ti, and δD of ASP basalts appears to indicate significant spatial heterogeneity in plume composition, or in the plume contribution to axial magmatism over short distances (1-10 km). Based upon the above geochemical data we suggest that the ASP plume is small (i.e. less than 80 km in diameter), and relatively weak at the present time, with a variable contribution to magmatism along segment I2 and possibly heterogeneous in composition (primordial mantle with additional recycled lithosphere; Loewen et al. 2019). The observed structural differences between the SE and NW compartments have remained steady since 10
Ma. We conclude that changes in plume upwelling contributed to the differences in crustal architecture (e.g., during the high and low magmatic periods), but an additional factor, discussed below, may also be involved to fully explain the observed characteristics of the ASP Plateau.
5.2.3 Influence of mantle source variation on crustal accretion
The observed differences between the SE and NW compartments may include the effects of a variable mantle source, related to compositional/lithologic heterogeneity in either the plume, the upper mantle, or both. Radiogenic isotope ratios in young basalts provide a record of isotopic variations in the underlying mantle that originate from long-term differences in parent/daughter ratios (White and Schilling, 1978). Due to elemental fractionation in ancient melting events and tectonic recycling of lithosphere and crust, the parent/daughter ratios can be distinct in lithologically different materials such as peridotite and pyroxenite (e.g., Hirschmann and Stolper, 1996). One useful parameter in this regard is ∆8/4Pb, defined as the vertical deviation from a Northern Hemisphere Reference Line (NHRL) by Hart (1984), where ∆8/4Pb = [(208
Pb/204Pb)sample – (208Pb/204Pb)NHRL] x 100, with
the NHRL equation being 208Pb/204Pb = 1.209 (206Pb/204Pb) + 15.627 . Using Pb isotope variations measured in young SEIR basalts by Nicolaysen et al., (2007), we note that ∆8/4Pb in basalts from segments J1 and J2 have a relatively high value (~110) (Figure 5) consistent with a strong contribution from the Dupal anomaly (Dupré and Allègre, 1983). In contrast, basalts from segment H and I1 have lower Δ8/4Pb values (~60) that appear to be a mixture of a mantle component commonly found in mantle plumes (the component C of Hanan and Graham, 1996) with the depleted, shallow upper mantle underlying the SEIR. The central segment I2 (100 km in length) shows intermediate values of Δ8/4Pb, and ranges between 70 and 80 (i.e. variation of Δ8/4Pb about ~20) (Figure 5). This three component mixing model for SEIR basalts is also supported by the Sr isotopic data. In the 87Sr/86Sr versus Δ8/4Pb plot (Figure 6), basalts from ASP segment J1 and J2 define a trend between depleted, Indian Ocean upper mantle (DM), and and enriched Dupal component. In constrast, basalts from ASP segments I2 (SE and NW compartments), I1 and H show lower Δ8/4Pb for a given
87
Sr/86Sr. There is a progressive decrease in Δ8/4Pb northward, suggesting an increasing contribution of the mantle component C from segment J2 to H. This increased northward C contribution is not correlated with a northward increase in crustal thickness (i.e. from J2 to H; Figure 5).
The Pb isotope variability could be related either to isotopic variations in either the ASP plume or in the upper mantle. The presence of high 3He/4He ratios along segment I2 suggests that the ASP mantle plume is derived from a high 3He/4He source region. This plume mantle source has 3He/4He ratios significantly higher than the shallow Indian Ocean MORB mantle (3He/4He= 7 – 10 Ra; Graham et al., 2014). Hotspots having high 3He/4He ratios are generally taken to be sourced at significantly greater depths than the MORB mantle source (Kurz et al., 1982). This assumption is supported by whole-mantle tomographic images which indicate a core-mantle boundary source for the Amsterdam-St. Paul plume (Zhao, 2007). Nevertheless, the K/Ti and 3He/4He peaks are relatively symmetric atop the plateau along segments I1, I2 and J1, while there is a gradient in Δ8/4Pb. This contrast suggests that the variation in Δ8/4Pb is not solely related to differences in plume influence, but is also related to intrinsic Pb isotope variability in the ambient upper mantle. An enriched (Dupal) component is likely dispersed in the ambient upper mantle, as noted by Nicolaysen et al. (2007), and it may be stronger beneath the SE compartment of the ASP Plateau.
Outside the plateau and in its northern border, geophysical and geochemical data indicate that segments H and I1 are characterized by relatively deep residual bathymetry and normal (6-7 km) crustal thicknesses, and a stronger contribution from the mantle component C. In contrast, in the southern part of the plateau, segments J1 and J2 are characterized by shallow residual bathymetry and thicker crust (7-8 km), and a stronger Dupal component contribution. This suggests that, in the neighborhood of the ASP plume, the presence of the Dupal component may contribute to a thicker crustal production. Therefore, during the most recent and less robust magmatic Stage D (Area D), the ASP plume has been weaker in its melt supply, and shallow mantle source variations have been more influential in the variable melt production between the segments. Indeed, the difference in Δ8/4Pb of ~50 between the
northern and the southern boundary of the ASP Plateau seems to covary with crustal thickness variations of up to 1.5 km. Thicker crust correlates with higher contributions from the Dupal component, suggesting that the Dupal component may contain a more fertile lithologic heterogeneity such as garnet pyroxenite or eclogite. Variable contributions from the different mantle sources have led to variations in melt production that are consistent with the long-term thicker crust in the SE plateau compartment compared to the NW compartment.
At the present time there is no discernible variation in crustal thickness or residual bathymetry along the ridge axis of segment I2 (Figures 2, 3 and 4). Moreover, the zero-age basalts show a small variation of Δ8/4Pb of about ~20 along I2 segment. Therefore, we suggest that the presence or absence of distinct compartments is related both to variations in upper mantle composition and to variations in melting/heterogeneity within the ASP mantle plume.
5.2.4 Interplay between upper mantle and plume sources
Given that Pb isotope measurements for basalts older than the most recent stage (stage D ≤ 0.93 Ma) are unavailable, several explanations remain possible for the differences between the NW and SE compartments. One simple explanation is that the geographic transition between the Dupal and the mantle (C) components, which approximately corresponds to the length of segment J2, varies in width through the time. In this speculative case, the current 100 km transition may have been smaller in the past although, in a convecting mantle a narrower transition seems doubtful unless both mantle sources are immiscible.
Assuming that mantle source provinces remained stable during the last 3 Myr, a second explanation is that the ASP plume material is heterogeneous in volatile/chemical contents. The volatile content of mantle plumes is currently a topic of debate, exemplified by studies in the Azores (i.e. Métrich et al., 2014; French and Romanowicz, 2015; Béguelin et al., 2017). Enrichment in volatiles, specifically water, can lower the mantle solidus temperature and promote higher degrees of partial melting that resemble the effect of higher mantle temperature (Bonatti, 1990; Asimow et al., 2004). In the ASP plume, compositional
heterogeneity inferred from the irregular incompatible element concentrations along the SEIR (Figure 5) could be associated with spatially differing volatile contents. Ratios of elements, such as H2O/Ce do not depend on spreading rate or the extent and depth of melting, but they
are sensitive to variations in the regional composition of the upper mantle (e.g. Michael, 1995; Danyushevsky et al., 2000; Dixon et al., 2002). The H2O/Ce ratio in young SEIR
basalts atop the plateau are relatively uniform and have an average of 200 ± 16 (Loewen et al., 2019) and there is no clear correlation between H2O/Ce and Na8 or 3He/4He (Figure 5).
Notably, one basalt from segment H has H2O/Ce ratios that range up to 330 (Figure 5).
However, other basalts from the northern part of segment H (outside of our study area) also have H2O/Ce ratios higher than 200 (Loewen et al., 2019). Although the data are limited, the
elevated H2O/Ce ratios along axis segment H basalts are suggested to be related to a recycled
water component in the ASP plume that also carries a radiogenic Pb signature yet has relatively primitive He isotope ratios (Loewen et al., 2019). The average H2O/Ce ratio
obtained for segments I1, I2 and J2 is comparable to average values for N-MORB and E-MORB globally (155 to 213 ± 40; Michael, 1995). This seems to indicate an absence of anomalously high H2O contents beneath the ASP Plateau, especially in association with the
Dupal component in this region. Overall, the observations do not support the hypothesis of a mantle H2O anomaly beneath the ASP Plateau (Graham et al., 1999).
Altogether, the evidence suggests that compositional heterogeneity within the ASP mantle plume is partly responsible for the variations in crustal production through time. Relations between 3He/4He, εNd, 206Pb/204Pb and εHf, reveal that samples from the ASP
Plateau (both on- and off-axis) and neighboring segments of the SEIR are mixtures of up to four mantle components (Nicolaysen et al., 2007; Graham et al., 2014). These components include a primitive plume component (having high 3He/4He), ambient depleted upper mantle, and recycled crustal/lithospheric materials (Dupal and C components). Mixing between these end-members accounts for the isotopic variability along the ridge segments I1, I2, J1 and J2. In addition, differences in fertility of the individual components may influence magma supply and lead to the observed crustal thickness variations.
6 Spatio-temporal evolution of the ridge accretion pattern during the last 3 Myr
During the robust magma supply stage (Stage C), heterogeneous ASP plume material was drained toward the ridge axis and mixed with the ambient mantle source, building a robust plateau characterized by high and large abyssal hills (Figures 2 and 7). The ambient mantle source beneath individual ridge segments appears to have had distinct isotopic signatures (Nicolaysen et al., 2007) that correspond to (1) a mantle component C (or common, composition of Hanan and Graham, 1996) to the north (H and I1 segments) accompanied by normal melt production/crustal thickness; and (2) a strong Dupal anomaly component to the south (J1 and J2 segment) responsible for thicker crust. Segment I2 appears to show mixing between both of these mantle sources (plus ambient depleted upper mantle, DM) (Figures 5 and 7).
Between 2.57 and 1.76 Ma (Figure 4C), there was a reduction in crustal thickness in the SE compartment, suggesting that less plume material arrived at the ridge axis, potentially due to a plume-conduit oscillation. The low magma supply stage (Stage D) began at this time and the connection between the sub-ridge mantle and the plume weakened. The remaining hot and less-dense plume material was slowly incorporated into the ridge-axis structure. Once the supply of ASP plume material decreased, the thickness of the crust and of the lithosphere decreased. Intriguingly, the thickness of the crust slowly increases to the north. This further suggests that the underlying ASP mantle plume is compositionally heterogeneous, with a more fertile portion situated below the northern part of the ridge axis.
Between 1.76 and 0.8 Ma, the plume flux decreased and melt production reached similar levels within each plateau compartment. Crustal thinning has since occurred along the entire I2 segment (Figure 4c). Bathymetrically, the plateau is also characterized by an abrupt change in faulting style, consistent with a decrease of plume material reaching the axis (Figures 2 and 3). The sigmoidal shape of the transition to a rougher bathymetry having a succession of lower and small abyssal hills and grabens indicates that interaction between heterogeneous shallow mantle and the progressively weaker ASP mantle plume varied
through time. Today, the bathymetry along segment I2 is relatively smooth, with a uniform crustal thickness of ~8 km, greater than the normal average of 6 km, suggesting that the ridge is still influenced by the plume (Figure 7).
Similar crustal thicknesses in both compartments also occcured during the previous low magmatic stage (Stage B, Area B, Figure 4a), when the ridge was migrating toward the ASP plume. At around 5 Ma, the minimum thickness reached in both compartments was ~7 km. The slightly thicker crust at 5 Ma relative to the typical spreading ridge average of 6 km may relate to the direction of ridge migration with respect to the plume at that time. Numerical models predict that plume volumes and the amount of magma reaching the ridge axis depend on the ridge migration direction (Ribe and Delattre, 1998; Ito et al., 1999). There are a number of examples of ridges moving away from a plume while still maintaining a flow connection, such as along the Central Indian Ridge (Morgan, 1978) and the Easter Microplate (Kingsley and Schilling 1998; Pan and Batiza, 1998). Geochemical and geophysical studies led to the so-called “hotspot source - migrating ridge sink model” (Schilling, 1985) where the ridge acts as a sink draining plume material along a narrow sub-lithospheric channel. Both the numerical results and the observations suggest that for a given plume-ridge distance, the predicted amount of melting is higher when a ridge is migrating away from a plume, and this generates thicker crust than when a ridge is approaching a plume.
We can speculate about the further evolution of the ASP Plateau, assuming the current location of the ASP mantle plume between the islands of Amsterdam and St Paul, where the helium anomaly is highest (~14.1; Nicolaysen et al., 2007). Today, plume-ridge distance is estimated at 65 km and increasing as the ridge continues to migrate to the northeast (Maia et al., 2011). Using scaling results from analytical models (Ribe and Delattre, 1998), the maximum plume/ridge interaction distance for the ASP plume can be estimated at 255 km. At current spreading and ridge migration rates relative to the plume, this distance will be reached in ~2.4 Myr. Compared to the 3 Myr pulse duration, a new stage of magmatic construction begins at the inception of a plume oscillation. Moreover, the I2 ridge segment has jumped twice in the last 10 Myr. The second jump occurred at 3.3 Ma during a low magmatic supply
stage like the one today. A future ridge jump could again reduce the distance between the plume and the ridge axis and facilitate a resumption of robust volcanic construction.
7 Summary and conclusions
We present observations and analysis of bathymetry and gravity data collected during the BOOMERANG and PLURIEL expeditions to the region of the Amsterdam-St. Paul Plateau. Coupled with available and new geochemical data, we characterize a region of anomalous crustal thickness related to the nearby Amsterdam-St. Paul hotspot and shallow upper mantle sources, which have dominated the 3D morphological architecture of the plateau.
Bathymetry and gravity data reveal significant variations in morphology and crustal thickness across the ASP Plateau and along the nearby SEIR axis since 10 Ma. We observe two periods of increased melt supply at the SEIR axis associated with thick crust and smooth, axial high type morphologies. The two periods are separated by a low magmatic phase, where the crust thickness is closer to the 6 km global average value and the morphology is of a rift valley type. This variation in melt production reveals temporal variations in ASP plume flux that may have been associated with oscillations in the plume conduit. This conclusion strengthens the model of Maia et al. (2011) in which the variations in plume fluxes can also promote ridge axis jumps.
Bathymetry and gravity data also show that during both stages of strong magmatic activity, crustal thickness was smaller in stage A than in stage C. This difference in crustal production is explained by migration of the SEIR over a fixed ASP hotspot. For the same plume-ridge distance, crust is thicker when the ridge recedes from the plume than when the ridge approaches the plume.
Melt production has been variable along the ridge axis, leading to the separation of segment I2 into two distinct compartments. Over the last 10 Myr, the SE compartment displays thicker crust and shallower water depths than the NW compartment. The morphology and crustal thickness characteristics of both compartments covary with ∆8/4Pb values. The ∆8/4Pb in basalts from the southern part of the I2 segment is high and consistent
with a strong Dupal anomaly. In contrast, basalts from the northern segment have significantly lower ∆8/4Pb values. This pattern suggests that isotopic and chemical heterogeneity in the plume or the upper mantle, or both, accounts for the differences in melt production between the NW and the SE compartments. Moreover, K/Ti and 3He/4He peaks are symmetric along the SEIR atop the ASP Plateau, while ∆8/4Pb decreases smoothly northwards from 110 to 60. We propose that the variation in ∆8/4Pb is not only related to the ASP plume’s influence, but that it also reflects isotopic variability in the upper mantle beneath the plateau.
Since 3 Ma, gravity-derived crustal thickness decreased earlier in the SE (~1.42 Ma) than in the NW (~0.93 Ma). Moreover, comparing bathymetry and gravity between segments H to J2 reveals that variations in melt production relative to distinct mantle sources (represented by different ∆8/4Pb values) are sensitive to the upwelling rate. Indeed, during the present low magmatic period, there is no discernible difference between the NW and SE compartments. Changes in the distinction of compartments through time and asynchronous thinning of the crust could indicate a plume with a heterogeneous distribution of volatiles and a compositional zonation. H2O/Ce ratios across the SEIR are comparable to normal upper
mantle and do not support crustal variability arising from different contributions of a “wet” plume source. However, differential melting of a hybridized mantle containing several geochemical components (a primitive mantle plume component, ambient depleted upper mantle, and recycled crustal/lithospheric materials tracked by the Dupal and C components) explains the variability in along-axis melt production during the last 3 Myr.
The crustal structure and seafloor morphology are controlled by chemical variability in the underlying mantle during interaction of the intermediate spreading ridge and the relatively weak ASP mantle plume. On the ASP Plateau, the along-axis temporal variations in crustal thickness and seafloor morphology are explained by temporal and/or geographic variability in the different mantle source materials being tapped by the I2 segment. However, important details of these variations remain somewhat unclear, and require additional chemical and isotopic studies of older basalts (>1 Ma) in the region.
This work was supported by an international postdoctoral grant of the “Laboratoire d’Excellence” LabexMER. The PLURIEL cruise was funded through a grant to the Flotte Océanographique Française and CNRS-INSU. The BOOMERANG 06 expedition was funded by the the National Science Foundation through grant OCE-9505667 of the RIDGE Initiative. EM was supported by grant EAR-1520856. DG was supported by OCE1558798 and 1763255 from NSF. The authors would like to thank A. Davaille for fruitful discussions. We thank the editor Thorsten Becker and the three anonymous reviewers for comments that improved the quality of this work. Methods, including statements of data availability are available in the main manuscript, in figures and tables provided as supplementary material and at this url: https://mycore.core-cloud.net/index.php/s/6N9zwSyYPG1DlPS.
References
Adam, C., Vidal, V., and Escartin, J., (2007). 80-Myr history of buoyancy and volcanic fluxes along the trails of the Walvis and St. Helena hotspots (South Atlantic). Earth
Planet. Sci. Lett., 261, 432-442.
Allen, R.M., Nolet, G., Jason Morgan, W., Vogfjord, K., Bergsson, B.H., Erlendsson, P., Foulger, G.R., Jakobsdottir, S., Julian, B.R., Pritchard, M., Ragnarsson, S., and Stefansson, R., (2002). Imaging the mantle beneath Iceland using integrated seismological techniques. J. Gephys. Res., 107(B12), 2325, doi:10.1029/2001JB000595. Asimow, P.D., Dixon, J.E., and Langmuir, C.H., (2004). A hydrous melting and fractionation
model for mid-ocean ridge basalts: Application to the Mid-Atlantic Ridge near the Azores. Geochemistry, Geophysics, Geosystems 5 (1), Q01E16, doi/10.1029/2003GC000568.
Béguelin, P., Bizimis, M., Beier, C., and Turner, S., (2017). Rift-plume interaction reveals multiple generations of recycled oceanic crust in Azores lavas. Geochemica et
Cosmochimica Acta 218, 132-152.
Behn, M.D., & Ito, G., (2008). Magmatic and tectonic extension at mid-ocean ridges: 1. Controls on fault characteristics. Geochem. Geophys. Geosyst., 9, Q08O10, doi:10.1029/2008GC001965.
Bonatti, E., (1990). Not so hot “hot spots” in the oceanic mantle. Science, 250, 107-110. Braun, M.G., & Sohn, R.A., (2003). Melt migration in plume-ridge systems. Earth Planet.
Sci. Lett., 213 (3-4), 417-430.
Brozena, J.M., & White, R.S., (1990). Ridge jumps and propagations in the South Atlantic Ocean. Nature, 348, 149-152.
Buck, W.R., Lavier, L.L., and Poliakov, A.N.B., (2005). Modes of faulting at mid-ocean ridges. Nature, 434, 719-723.
Canales, J.P., Danobeitia, J.J., Detrick, R.S., Hooft, E.E.E., Barolomé, R., Naar, D., (1997). Variations in axial morphology along the Galapagos Spreading Center and the influence of the Galapagos hotspot. J. Geophys. Res., 102, 27,341-27354.
Cannat, M., Briais, A., Deplus, C., Escartin, J., Georgen, J., Lin, J., Mercouriev, S., Meyzen, C., Muller, M., Pouliquen, G., Rabain, A., and da Silva, P., (1999). Mid-Atlantic Ridge-Azores hotspot interactions:along-axis migration of a hotspot-derived event of enhanced magmatism 10 to 4 Ma ago. Earth Planet. Sci. Lett., 173, 257-269.
Carbotte, S.M., Samll, C., and Donnelly, K., (2004). The influence of ridge migration on the magmatic segmentation of mid-ocean ridges. Nature, 429, 743-746.
Chen, Y.J., (1996). Constraints on the melt production rate beneath the mid-ocean ridges based on passive flow models. Pure Appl. Geophys., 146, 589-620, doi:10.1007/B00874735.
Chen, Y.J., & Lin, J., (2004). High sensitivity of ocean ridge thermal structure to changes in magma supply: The Galapagos Spreading Center. Earth Planet. Sci. Lett., 221, 263-273. Conder, J.A., Scheirer, D.S., and Forsyth, D.W., (2000). Seafloor spreading on the
Amsterdam-St. Paul hotspot plateau. J. Geophys. Res., 105, 8263-8277.
Courrèges, E., (2010). Plateaux de St-Paul Amsterdam et Nord Kerguelen: interaction entre la dorsale SE indienne et des points chauds. PhD thesis, Univ. Bretagne Occidentale. 235pp.
Cushman, B., Sinton, J., Ito, G., and Eaby Dixon, J., (2004). Glass compositions, plume-ridge interaction, and hydrous melting along the Galapagos Spreading Center, 90.5°W to 98°W. Geochem. Geophys. Geosyst., 5, Q08E17, doi:10.1029/2004GC000709.
Dalton, C.A., Langmuir, C.H., and Gale, A., (2014). Geophysical and geochemical evidence for deep temperature variations beneath mid-ocean ridges. Science 344, 80-83.
Danyushevsky, L.V., Eggins, S.M., Falloon, T.J., and Christie, D.M., (2000). H2O abundance
in depleted to moderately enriched mid-ocean ridge magmas; Part I: Incompatible behaviour, implications for mantle storage, and origin of regional variations. Journal of
Petrology, 41, 1329-1364.
Deschamps, A., Shinjo, R., Matsumoto, T., Lee, C.-S., Lallemand, S.E., Wu, S., and Scientific party of KR03-04 and KR04-14 cruises, (2008). Propagators and ridge jumps in a back-arc basin, the West Philippine Basin. Terra Nova, 20, 327-332.
Dixon, J.E., Leist, L., Langmuir, C., and Schilling, J.-G., (2002). Recycled dehydrated lithosphere observed in plume-influenced mid-ocean-ridge basalt. Nature 420, 385-389. Douglas-Priebe, L.M., (1998). Geochemical and petrogenetic effects of the interaction of the
Southeast Indian Ridge and the Amsterdam-Saint Paul hotspot, M.S. thesis, Oregon State
University, Corvallis. 132p.
Dupré, B., & Allègre, C.J., (1983). Pb-Sr isotope variation in Indian Ocean basalts and mixing phenomena. Nature 303, 142-146.
French, S.W., & Romanowicz, B., (2015). Broad plumes rooted at the base of the Earth’s mantle beneath major hotspots. Nature 525, 95-99.
Gente, P., Dyment, J., Maia, M., and Goslin, J., (2003). Interaction between the Mid-Atlantic Ridge and the Azores hot spot during the last 85 Myr: Emplacement and rifting of the hot spot-derived plateaus. Geochem. Geophys. Geosyst., 4(10), 8514, doi:10.1029/2003GC000527.
Graham, D.W., Johnson, K.T.M., Priebe, L.D., and Lupton, J.E., (1999). Hotspot-ridge interaction along the Southeast Indian Ridge near Amsterdam and St. Paul Islands: Helium isotope evidence. Earth Planet. Sci. Lett., 167, 297-310.
Graham, D.W., Hanan, B.B., Hémond, C., Blichert-Toft, J., and Albarède, F., (2014). Helium isotopic textures in Earth’s upper mantle. Geochem., Geophys., Geosyst. 15, 2048-2074. Doi:10.1002/2014GC005264.
Hanan, B.B., & Graham, D.W., (1996). Lead and helium isotope evidence from oceanic basalts for a common deep source of mantle plumes. Science, 272, 991-995.
Hanan, B.B., & Schilling, J.-G., (1997). The dynamic evolution of the Iceland mantle plume: the lead isotope perspective. Earth and Planetary Science Letters, 151, 1-2, 43-60.
Hardarson, B.S., Fitton, J.G., Ellam, R.M., and Pringle, M.S., (1997). Rift relocation – A geochemical and geochronological investigation of a paelo-rift in northwest Iceland.
Earth Planet. Sci. Lett., 153, 181-196.
Hebert, L.B., & Montési, L.G.J., (2011). Melt extraction pathways at segmented oceanic ridges: Application to the East Pacific Rise at the Siqueiros transform. Geophys. Res.
Lett., 38, L11306, doi:10.1029/2011GL047206.
Hey, R., Johnson, J.L., Lowrie, A., (1977). Recent plate motions in the Galapagos area. Geol.
Soc. Am. Bull., 88, 1385-1403.
Hey, R.N., & Vogt, P.J., (1977). Spreading center jumps and subaxial asthenospheric flow near the Galapagos hot spot. Tectonophysics, 37, 41-52.
Hirschmann, M.M., & Stolper, E.M., (1996). A possible role for garnet pyroxenite in the origin of the “garnet signature” in MORB. Contributions to Mineralogy and Petrology,
124 (2), 185-208.
Ito, G., (2001). Reykjanes ‘V’ –shaped rodges originating from a pulsing and dehydrating mantle plume. Nature, 411, 681-684.
Ito, G., Lin, J., and Gable, C.W., (1997). Interaction of mantle plumes and migrating mid-ocean ridges: Implications for the Galapagos plume-ridge system. J. Gephys. Res., 102, 15,403-15,417.
Ito, G., Shen, Y., Hirth, G., and Wolfe, C., (1999). Mantle flow, melting, and dehydratation of the Iceand mantle plume. Earth Planet. Sci. Lett., 165, 81-96.
Ito, G., Lin, J., and Graham, D., (2003). Observational and theoretical studies of the dynamics of mantle plume-mid-ocean ridge interaction. Reviews of Geophysics, 41(4), 1017, doi:10.1029/2002RG000117.
Ito, G., & Behn, M.D., (2008). Magmatic and tectonic extension at mid-ocean ridges: 2. Origin of axial morphology. Geochem. Geophys. Geosyst., 9, Q08O10, doi:10.1029/2008GC001965.
Johnson, G.L., Southall, J.R., Young, P.W., and Vogt, P.R., (1972). Origin and structure of the Iceland Plateau and Kolbeinsey Ridge. J. Geophys. Res., 77(29), 5688-5696.
Johnson, K.T.M., Graham, D.W., Rubin, H., Nicolaysen, K., Scheirer, D.S., Forsyth, E.T., and Douglas-Priebe, L.M., (2000). Boomerang Seamount: The active expression of the Amsterdam-St Paul hotspot, Southeast Indian Ridge. Earth Planet. Sci. Lett., 183, 245-259.
Karsten, J.L., & Delaney, J.R., (1989). Hot spot-ridge crest convergence in the northeast Pacific. J. Geophys. Res., 94, 700-712.
Kingsley, R.H., & Schilling, J.-G., (1998). Plume-ridge interaction in the Easter-Salas y Gomez seamount chain-Easter Microplate system: Pb isotope evidence. J. Geophys. Res.,
Solid Earth, 103 (B10), 24159-24177.
Klein, E.M., & Langmuir, C.H., (1987). Global correlations of ocean ridge basalt chemistry with axial depth and crustal thickness. J. Geophys. Res. 92, 8089-8115.
Kuo, B.-Y., & Forsyth, D.W., (1988). Gravity anomalies of the ridge-transform system in the South Atlantic between 31 and 34.5°S: Upwelling centers and variations in crustal thickness. Mar. Geophys. Res., 10, 205-232.
Kurz, M.D., Jennkins, W.J., and Hart, S.R., (1982). Helium isotopic systematics of oceanic islands: implications for mantle heterogeneity. Nature, 297, 43-47.
Langmuir, C.H., Klein, E.M., and Plank, T., (1992). Petrological systematics of mid-ocean ridge basalts: Constraints on melt generation beneath ocean ridges, in Mantle Flow and Melt generation at Mid-ocean Ridges, Geophys. Monogr. Ser., vol. 71, edited by J. Phipps Morgan, D.K. Blackman, and J.M. Sinton, pp. 183-280, AGU, Washington, D.C. Loewen, M.W., Graham, D.W., Bindeman, I.N., Lupton, J.E., and Garcia, M.O., (2019).
Hydrogen isotopes in high 3He/4He submarine basalts: Primordial vs. recycled water and the veil of mantle enrichment. Earth Planet., Sci., Lett., 508, 62-73.
Lupton, J.E., (1983). Terrestrial inert gases: Isotope tracer studies and clues to primordial components in the mantle. Ann. Rev. Earth Planet. Sci. 11, 371-414.
Magde, L.S., & Sparks, D.W., (1997). Three-dimensional mantle upwelling, melt generation, and melt migration beneath segment slow spreading ridges. J. Geophys. Res., 102, 20,571-20,583.
Maia, M., Ackermand, D., Dehghani, G. A., Gente, P., Hékinian, R., Naar, D., ... & Stoffers., P., (2000). The Pacific-Antarctic Ridge–Foundation hotspot interaction: a case study of a ridge approaching a hotspot. Marine Geology, 167(1-2), 61-84.
Maia, M., Hémond, C., Gente, P., (2001). Contrasted interactions between plume, upper mantle, and lithosphere: Foundation chain case. Geochem. Geophys. Geosyst., 2, 2000GC000117.
Maia, M., Goslin, J., and Gente, P., (2007). Evolution of the accretion processes along the Mid-Atlantic Ridge north of the Azores since 5.5 Ma: An insight into the interactions between the ridge and the plume. Geochem. Geophys. Geosyst., 8, Q03013, doi:10.1029/2006GC001318.
Maia, M., Pessanha, I., Courrèges, E., Patriat, M., Gente, P., Hémond, C., Janin, M., Jonhson, K., Roest, W., Royer, J.-Y., and Vatteville, J., (2011). Building of the Amsterdam-Saint Paul plateau: A 10 Myr history of a ridge-hot spot interaction and variations in the strength of the hot spot source. J. Geophys. Res., 116, B09104, doi:10.1029/2010JB007768.
Maiden, M.D., & Hoefer, M.A., (2016). Modulations of viscous fluid conduit periodic waves.
Proc. R. Soc. A 472:20160533, doi:10.1098/rspa.2016.0533.
McKenzie, D., (1984). The generation and compaction of partially molten rock. J. Petrol., 25, 713-765.
Métrich, N., Zanon, V., Créon, L., Hildenbrand, A., Moreira, M., and Marques, F.O., (2014). Is the ‘Azores Hotspot’ a Wetspot? Insights from the geochemistry of fluid and melt inclusions in olivine of pico basalts. Journal of Petrology 55, 377-393.
Michael, P., (1995). Regionally distinctive sources of depleted MORB: Evidence from trace elements and H2O. Earth and Planetary Science Letters, 131, 301-320.
Mittelstaedt, E., Ito, G., and Van Hunen, J., (2011). Repeat ridge jumps associated with plume-ridge interaction, melt transport, and ridge migration. J. Geophys. Res., 116, B01102, doi:10.1029/2010JB007504.
Mittelstaedt, E., Soule, S., Harpp, K., Fornari, D., McKee, C., Tivey, M., Geist, D., Kurz, M.D., Sinton, C., and Mello, C., (2012). Multiple expressions of plume-ridge interaction