HAL Id: hal-01345658
https://hal.archives-ouvertes.fr/hal-01345658
Submitted on 15 Jul 2016
HAL is a multi-disciplinary open access
archive for the deposit and dissemination of
sci-entific research documents, whether they are
pub-lished or not. The documents may come from
teaching and research institutions in France or
abroad, or from public or private research centers.
L’archive ouverte pluridisciplinaire HAL, est
destinée au dépôt et à la diffusion de documents
scientifiques de niveau recherche, publiés ou non,
émanant des établissements d’enseignement et de
recherche français ou étrangers, des laboratoires
publics ou privés.
Evaluating the usability of a visual feature modeling
notation
Aleksandar Jakšic, Robert France, Philippe Collet, Sudipto Ghosh
To cite this version:
Aleksandar Jakšic, Robert France, Philippe Collet, Sudipto Ghosh. Evaluating the usability of a visual
feature modeling notation. 7th International Conference, SLE 2014, Sep 2014, Vasteras, Sweden.
�10.1007/978-3-319-11245-9_7�. �hal-01345658�
modeling notation
Aleksandar Jakˇsi´c1, Robert B. France1, Philippe Collet2, and Sudipto Ghosh1
1
Colorado State University, Computer Science Department, Fort Collins, USA [email protected] {france|ghosh}@cs.colostate.edu
2
Universit´e Nice Sophia Antipolis / I3S - CNRS UMR 7271, France [email protected]
Abstract. Feature modeling is a popular Software Product Line Engi-neering (SPLE) technique used to describe variability in a product family. A usable feature modeling tool environment should enable SPLE prac-titioners to produce good quality models, in particular, models that ef-fectively communicate modeled information. FAMILIAR is a text-based environment for manipulating and composing Feature Models (FMs). In this paper we present extensions we made to FAMILIAR to enhance its usability. The extensions include a visualization of FMs, or more pre-cisely, a feature diagram rendering mechanism that supports the use of a combination of text and graphics to describe FMs, their configurations, and the results of FM analyses. We also present the results of a prelim-inary evaluation of the environment’s usability. The evaluation involves comparing the use of the extended environment with the previous text-based console-driven version. The preliminary experiment provides some evidence that use of the new environment results in increased cognitive effectiveness of novice users and improved quality of new FMs.
Keywords: FAMILIAR Tool? ? ?, FAMILIAR, Software Product Lines,
Feature Modeling, Software Visualization, Model-Driven Development
1
Introduction
Feature models (FM) are often used in Software Product Line Engineering (SPLE) to describe variability in a product family. A usable feature model-ing tool environment should enable SPLE practitioners to produce good quality models, in particular, models that effectively communicate modeled information. A number of textual domain-specific modeling languages (DSMLs) for feature modeling [6][7][11][15][21], including FAMILIAR [2–4, 16], have been proposed during the last decade. There are many benefits to using text-based languages to describe the variability [12]. For example, a lightweight textual language can
? ? ?
In this work, we refer to the newly developed visual tool as the FAMILIAR Tool. Subsequently, its underlying framework, the DSML language, continues to be re-ferred to as FAMILIAR, as it was the case with the prior work.
leverage already established tools that are available for editing and manipulat-ing textual language statements. Such support facilitates rapid prototypmanipulat-ing of a DSML. Other desirable characteristics that typically come with expressive tex-tual notations with good tool support include interoperability with other textex-tual DSMLs, and scripting support that enables replay of operation sequences, and modular management of scripts [4]. On the other hand, creating and analyzing a large text-based feature model (FM) often requires significant cognitive effort. Cognitive research is a scientific discipline that attempts to gain insights on how the human mind analyzes information, creates knowledge, and solves prob-lems. There is growing evidence of the cognitive power of visualization [20]. Tool support for visualizing models may help modeling practitioners amplify their cognition [35]. The increase in cognitive effectiveness can lead to improved abil-ity of humans to process information captured in models [28]. There is evidence that visual notations convey information more effectively than text, especially to novices [9]. Our work on extending a textual DSML for FMs and on evalu-ating the resulting FM development environment is motivated by the following question: Does the lack of support for visualizing FMs in FM development tools hinder the usability of these tools when managing multiple and large FMs during modeling sessions?
Our hypothesis is that modeling practitioners, especially novice modelers, would benefit when provided with graphical feature models that use familiar no-tations (e.g., a FODA-like notation) [26][27]. Allowing modelers to express and visualize feature models in a tree-like top-down hierarchical structure should enhance their ability to develop good quality models that effectively communi-cate modeled information. Consequently, the tool support for FM visualization should lead to improved user efficiency, effectiveness, and learnability.
In this paper we describe the results of a preliminary experiment conducted to measure and analyze the benefits associated with the use of graphical models when compared to the use of purely textual models. We also describe how we extended the FAMILIAR language and its feature modeling tool environment with support for graphically rendering FMs.
2
Background
Models can help us to break down a complex problem through abstraction. Fur-thermore, we can also use them to narrow the gap between the problem and solution domains. Attempts to bridge the problem-solution gap with traditional software development approaches are not only labor-intensive but also tedious and error-prone with potential accidental complexities. As a consequence, soft-ware development costs as well as time-to-deploy tend to keep increasing [18]. One of the central ideas behind Software Product Line Engineering (SPLE) is to shift away from individually designing software products. Instead, engineers should focus on creating quality models of product families that would, with the help of evolving automation technologies and an emergence of widely
sup-ported industry standards, eventually be capable of delivering high quality final products in less time and with no or minimal accidental complexities [31].
SPLE supports explicit modeling of what is common and what differs among software product variants. Under the umbrella of SPLE, several techniques have been proposed including those for automatically generating implementations of family members [13], configuring products [5] and transforming models [25].
2.1 Feature Modeling
When decomposing a family of products in terms of its features, one of the main objectives is to construct a well-structured product line that is typically represented as a feature model. Feature modeling is a popular model-driven approach to describing commonalities and variabilities of a family of (software) products in terms of features. A feature is any distinctive user-visible aspect, or characteristic of a product [17].
The feature model depicted in Figure 1†represents a simple laptop family. An FM hierarchically structures features and feature groups, in a tree-like top-down fashion, using parent-child relations. A feature diagram is simply a graphical representation of an FM typically represented as an And-Or tree with nodes as features. An FM can include constraints that further clarify dependencies among features.
An FM can be represented in at least two ways: as a feature diagram, or a textual form. In addition, a SPL tool might internally translate a FM represen-tation to a propositional formula so that it can, for example, verify the validity of a model, and perform various computations on an FM to support, for example, reasoning and composing operations [7, 33, 14]. Transforming an FM from one representation to another should preserve the hierarchy and constraints in their original form. Each product of a SPL corresponds to a valid configuration of an FM. A configuration is obtained by selecting and unselecting features in an FM. A feature model thus defines a set of valid feature configurations. The validity of a configuration is determined by the semantics of a feature model. For example, in Figure 1, screens with sizes 13.3” and 17” are mutually exclusive and cannot be selected at the same time. Similarly, more expensive laptops (i.e., those with 17” screens) must include a warranty meaning that all laptops with 17” screens will also come with the warranty.
As feature models are rapidly emerging as a viable and important systems development tools, they are also becoming increasingly complex. Managing FMs of industrial size is a labor-intensive and error-prone process.
2.2 FAMILIAR
To meet the requirement of handling large and complex FMs in a scalable way, the domain-specific modeling language FAMILIAR was developed [2–4, 16]. FA-MILIAR is an executable scripting language that has the built-in capability
†
For brevity, feature names used in a Laptop FM are abbreviated to combination of letters, underlined in the Feature Diagram example given in Figure 1.
Fig. 1. Example of a Laptop FM with different FM notations.
to compose and decompose feature models, and also to manipulate and rea-son about FMs. FAMILIAR allows stakeholders to describe domain concepts in terms of commonalities and variabilities within a family of software or product systems. Feature models are typically passed in to the FAMILIAR interpreter in a textual notation. In addition, the FAMILIAR language can interpret a script in order to perform a sequence of operations on feature models. Such scripts are reusable.
One of the most powerful characteristics of the FAMILIAR language is its set of composition operators that are designed for supporting the separation of concerns in feature modeling. To the best of our knowledge, FAMILIAR is the only SPL modeling environment capable of working with multiple FMs. As a part of the work presented in this paper, we enhanced FAMILIAR to support FM visualization.
3
Designing the new FAMILIAR Tool
Our goal was to develop an extension of the previous FAMILIAR framework which (1) supports visualization of FMs, (2) provides a configuration editor, (3) enables the persistence of FMs, and (4) embeds the text-based console. The new FAMILIAR Tool [23] would provide an integrated modeling environment within the FAMILIAR framework without requiring the use of any other IDEs
(e.g., Eclipse) or plugins. In addition, the tool would still expose all of the original de/composition, reasoning, editing, scripting, interoperability and other facilities of the FAMILIAR language.
3.1 Visualization of Feature Models
Since our development platform was Eclipse with a Java legacy code base, we considered only the visualization kits available on Java platforms such as Zest, JUNG, Prefuse, Protovis, SWT, and GEF. We chose to use Prefuse, a graphical, open source library designed to support the development of interactive visual-izations. The architecture of Prefuse utilizes the Visualization Pipeline, which decomposes a design into a piped process of (1) representing abstract data, (2) mapping data into intermediate, visualizable form, and (3) using these visual constructs to provide interactive views. The intent is to improve scalability and representational flexibility. In addition, this separation of concerns supports mul-tiple views, semantic zooming, data and visual transformations, and fine grained customizations [19].
Fig. 2. Example of a visualized FM rendered by the FAMILIAR Tool.
The main window of the FAMILIAR Tool (Figure 2) has two components: The visual section (upper frame) and the embedded console section (bottom frame). FMs that are displayed in the visual section are read from and written directly to the FAMILIAR environment. Similarly, textual commands that are issued either interactively through the embedded console or by running a script,
are written to the same FAMILIAR environment. Any model update, no matter how it is done (i.e., visually, interactively through command console or through script execution), always keeps the FMs in a fully synchronized and consistent states.
A user can choose to create a new feature model, import a FM from another SPL tool, or load an FM saved in a previous session. A user can create a new FM using (1) interactive pop-up menus, (2) the embedded text console, or (3) a script. An FM is displayed and accessed under a single tab. Executing a script that, among other things, creates several feature models, would create several tabs, each of them containing a pre-loaded feature model. Closing a tab would not remove its associated feature model from the environment, rather, it would unload it.
Integration with the FAMILIAR’s interpreter was achieved by forwarding down the system’s Java input stream (text-based commands) from the embed-ded console (GUI control) to the FAMILIAR framework, and by redirecting the system output streams back to the same GUI control. This way, the em-bedded FAMILIAR console, which is part of tool (bottom part of the main application dialog shown in Figure 2) behaves the same way, syntactically and semantically, as the old standalone text-based tool. Any action that is commit-ted directly through the embedded console control is automatically rendered in loaded graphical FMs. This required maintaining a one-to-one mapping among three internal FM model representations: (1) an FM environment variable with its associated AST model of a feature diagram, (2) a visual FM object with its associated Prefuse interactive view model, and (3) in-memory representation of the serialized FM to XML storage.
We also integrated the existing FeatureIDE FAMILIAR plugin command (i.e. “gdisplay” command) that is used for visualizing feature models within the Eclipse IDE environment. This was achieved through the observer pattern. For example, once the FAMILIAR interpreter detects a “gdisplay” statement, it creates an observer handler as well as an observable event source with the feature model variable name. Then, it subscribes the observer handler event to the event source. Finally, this observable event is handled at the GUI level by loading an appropriate feature model variable that corresponds to the given feature model variable name.
The Configuration Editor is implemented as an interactive Java tree control that represents an FM with its set of selected and/or deselected features. A feature is allowed to be selected or deselected only when the FM’s propositional formula is satisfiable.
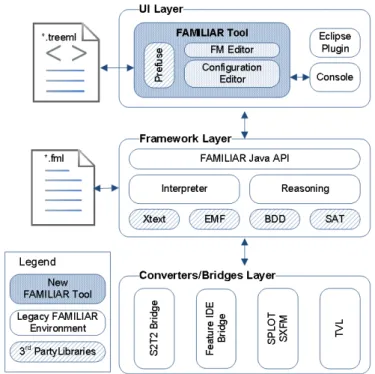
3.2 FAMILIAR’s New Architecture
As depicted in Figure 3, the improved FAMILIAR environment now encompasses three main layers:
Framework: This is the cornerstone of the FAMILIAR language. The frame-work specifies the language grammar and builds an internal abstract syntax
tree (AST) structure. The interpreter uses 3rd party off-the-shelf solvers (BDD and SAT) to check satisfiability of an FM’s propositional formula. It also provides rich semantics for FM composition operators (aggregate, merge, and insert) as well as decomposition operators (slice). Finally, it exposes its functionality through a non-public Java API interface, which is used by the UI layer.
UI Layer: This layer exposes the framework to an user. There are three ways that FAMILIAR can currently be used: (1) As a new FAMILIAR Tool which integrates the Prefuse visualization framework with FM Editor, Configura-tion Editor and an embedded console into unique modeling standalone envi-ronment, (2) as the legacy text-based console and (3) as an Eclipse Plugin. Converters/Bridges: This layer integrates several converters and bridges that
allow for integration with other SPL languages and notations.
Fig. 3. FAMILIAR environment with the addition of the GUI tool.
4
Evaluating the Usability
Usability does not exist in any absolute sense. Rather, it would make sense only to define it with reference to particular contexts. ISO 9241 [1] defines usability in
terms of the quality of use as the “effectiveness, efficiency and satisfaction with which specified users achieve specified goals in particular environments”. Bevan [8] uses this standard to describe a method called MUSiC (Metrics for Usability Standards in Computing) for specifying the context of use when measuring user effectiveness, efficiency, and satisfaction. The context needs to define who the intended users of the system are, the tasks those users will perform with it, and the characteristics of the organizational or social environment in which it will be used. This method seems particularly suitable for our evaluation since (1) it focuses on usability attributes that we are interested in measuring, and (2) it relies on an industrial standard, ISO 9241.
We chose to do a formal experiment since we needed to impose control over the variables that can affect the study outcomes. In addition, we need to be able to achieve replication in an environment where both the difficulty of control and the cost of replication are fairly low.
4.1 Goal, Research Questions, and Context
We formulate the goal of the FAMILIAR Tool evaluation using the Goal-Question Metric (GQM) template [36] as follows:
Goal: Evaluate the FAMILIAR Tool to better understand the impact on usabil-ity aspects of implementing feature model visualizations on the FAMILIAR language from the viewpoint of modelers.
Based on this goal, we focus on the following research questions:
RQ1: Does visualization of feature models help modelers to create FMs of better quality?
RQ2: Does visualization of feature models help modelers to manage FMs with better efficiency?
RQ3: Does visualization of feature models help modelers to manage FMs with better effectiveness?
The context selection represented situations where SPL practitioners cre-ated new FMs. The controlled experiment was conducted within two groups of graduate Computer Science students with a total of 16 participants from two countries, United States and France. The first group involved 3 graduate Ph.D. students that are under Dr. Robert France’s supervision at the Colorado State University (CSU). The second group involved 13 Masters and Ph.D. students that took a graduate SPL course taught by Dr. Philippe Collet, at the Univer-sity of Nice, Sophia Antipolis (UNS). The UNS participants, a larger sample, formed the treatment group by working only with the new FAMILIAR Tool (Vi-sual). On the other hand, CSU participants formed the control group by working only with the legacy standalone tool (Text-based).
4.2 Hypothesis Formulation
Graphical modeling proponents claim that presenting models in a visualized form helps the user grasp the information landscape more quickly and intuitively. We seek to test this claim in the context of feature modeling.
Hypothesis: Using the FAMILIAR Tool with visualized feature models yields higher FM quality, user effectiveness, and efficiency than using the same tool with text only mode, when creating new FMs.
4.3 Experiment Design
Participants were asked to go through several stages before they ran the main experiment scenario. These stages involved the following: (1) Basic training on SPL, Feature Modeling, and the FAMILIAR language, (2) configuring the FA-MILIAR environment in preparation for the experiment, and (3) the experiment session.
First, we provided minimal overview of SPL, Feature Modeling, and a brief introduction to the FAMILIAR language and its environment. The training pro-vided was at the very basic level, and students did not spend more than one hour before starting the experiment sessions. Second, preparation for the exper-iment involved getting the FAMILIAR environment properly configured. Finally, the experiment session was no longer than 55 minutes, and it consisted of two sub-tasks (3.1) analyzing the on-line configurator for Audi cars, and then (3.2) modeling it by creating a new FM file for the Audi configurator. Students were asked to work at their own pace, independently of one another. They were also required to record all of their interactions with the tools during the experiment session. By doing this, we could accurately measure the number of modeling tasks that users successfully completed, the accuracy with which users com-pleted tasks (i.e., some quantification of the errors), the duration of tasks, users’ learning of the interface, and finally, asses quality of FMs created, and calculate user efficiency and effectiveness.
4.4 Experiment Objects and Variables
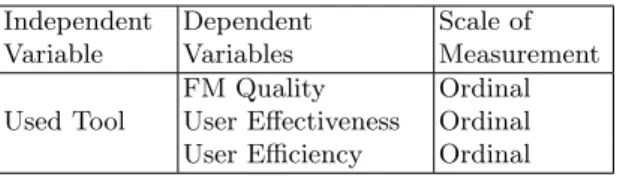
There was one independent variable and three target variables as shown in Ta-ble 1. The treatment object is the group that used the new FAMILIAR Tool and worked with visualized FMs (V-group). The control object is the group that used a legacy FAMILIAR console and worked with textual FMs (T-group). Since V-group is compared to T-group regarding its FM quality as well as user effec-tiveness and efficiency, choice of the used tool is the independent variable and FM quality, user effectiveness, and user efficiency are the dependent variables.
Dependent Variable - FM Quality: According to the MUSiC method, qual-ity is a measure of the degree to which the output achieves the task goals. For the purpose of this experiment, quality is expressed in terms of a final FM quality. Table 2 breaks down the criteria that we used to assess the quality of an FM.
Table 1. Experiment variables Independent Variable Dependent Variables Scale of Measurement Used Tool FM Quality Ordinal
User Effectiveness Ordinal
User Efficiency Ordinal
Table 2. FM quality
Quality Assigned
Weight
Description
Poor 0.2 FM cannot be properly parsed by the tool (i.e., model
con-tains an inconsistent and/or an invalid element(s), or simply it is not syntactically well-formed).
Satisfactory 0.4 FM is properly loaded by the tool but lacks majority of fea-tures and/or groups.
Good 0.6 FM is mostly complete (i.e., includes various Audi model
lines) and has neither inconsistencies nor invalid elements. Very good 0.8 FM includes a comprehensive features set but might fail to
accurately represent certain group dependencies (e.g., used AND-group when XOR-group would be more appropriate).
Excellent 1.0 FM includes a comprehensive features set, and provides a
solid foundation for further breaking down the model as an SPL artifact. Different feature groups, dependencies and con-straints were used in terms of both quantity and quality. (i.e., this FM, if offered with an online configurator, has enough details to allow a customer to produce a model of a custom Audi car tailored for her needs).
Dependent Variable - User Effectiveness: To assess user effectiveness, we defined a quantity that is a measure of the amount of a task completed by a user. It is defined as the proportion of the task goals accomplished, as represented in the output of the task. For the purpose of this experiment, the quantity reflects a measure of FM completeness in terms of the number of features, number of constraints, valid configurations and FM depth. Each of those four categories contributes 25% of a total quantity value. Table 3 shows how we calculated quantity as a measure of FM completeness.
Table 3. FM completeness
Category Assigned Weight Description
# of features 0.25 Up to 29 features 0.50 30-39 features 0.75 40-49 features 1 50 or more # of constraints 0.25 1 constraint 0.50 2-3 constraints 0.75 3-4 constraints 1 5 or more Valid configs 0.25 Up to 100 or above 25k 0.50 Up to 4999 configs 0.75 Up to 9999 configs 1 Between 10k and 25k FM Depth 0.25 Depth of 1 0.50 Depth of 2 0.75 Depth of 3 1 Depth of 4 or more
The quantity is expressed as a number between 1 and 100 where 1 represents the least complete FM, and 100 represents the most complete FM. Note that the quantity measure does not (and should not) reflect the quality of an FM. Finally, the user effectiveness is given as a percentage, and is calculated using the following formula:
U serEf f ectiveness = (F M Quantity ∗ F M Quality)%
Dependent Variable - User Efficiency: Note that the user effectiveness does not take into account the time required to complete a given task. The user efficiency calculation does include the time component. The user efficiency is calculated using the following formula:
U serEf f iciency = U serEf f ectiveness ScenarioT ime
Therefore, the user efficiency measures the user effectiveness in terms of time it takes to complete a task. The higher this number is the more efficient this user is relative to other users.
5
Experimental Results
We used the Small Stata 12.1 package to perform a statistical analysis and chart all of the graphs shown in this section. Table 4 shows the main experiment data.
Table 4. Summarized experimental results Group Time (min) # of user errors # of
features created FM quality User Effec-tiveness User Effi-ciency V 24.8 10 38 0.8 55% 0.53 V 11.4 1 23 0.4 23% 0.48 V 18.6 3 44 0.4 18% 0.23 V 16.2 3 37 0.4 13% 0.19 V 45.2 42 48 1.0 75% 0.40 V 25.3 12 39 0.4 18% 0.17 V 20.2 8 26 0.4 15% 0.18 V 29.0 12 71 0.6 38% 0.31 V 12.4 4 37 0.4 23% 0.44 V 19.8 4 54 0.6 34% 0.41 V 13.6 0 46 0.6 30% 0.53 V 6.8 7 27 0.4 10% 0.36 V 5.8 3 27 0.4 18% 0.72 T 30.8 1 51 0.2 15% 0.12 T 9.9 5 17 0.4 15% 0.36 T 16.4 25 10 0.2 13% 0.18
The last three columns (dependent variables) are determined by the study methodology as described in Section 4.4.
5.1 Observations
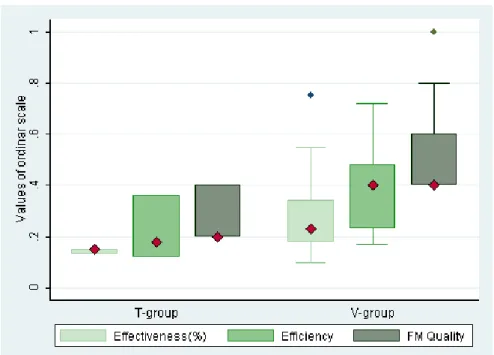
Figure 4 shows the box plots for all three dependent variables FM Quality, Effectiveness and Efficiency, grouped by the tool used (T-group and V-group). The box plots show that T-group has no outliers, and the V-group has 2. The medians are indicated by the diamonds. The median values for all dependent variables are higher for V-group than T-group. Each of the box plots illustrates a different skewness pattern. It appears that the Effectiveness in particular exhibits a non-symmetric distribution which might imply non-normal data.
In addition to Figure 4, Table 5 shows the calculated median values for all dependent variables by group.
Fig. 4. Box plots of dependent variables, by group.
Table 5. Median values of dependent variables, by group Group FM Quality User Effectiveness User Efficiency
V 0.4 23% 0.40
We are not concerned with averages since they do not make sense for ordinal data. Based on our small sample data, there is evidence that participants who used the visualized SPL tool did better than participants who used the text-based tool in terms of all three categories: FM quality, user effectiveness and user efficiency. For example, 2 out of 3 participants from T-group failed to produce a valid FM, whereas all of 13 participants from V-group produced valid FMs that could be independently verified after the experiment was completed. However, we need to determine whether this difference in medians between two groups is statistically significant before we can make stronger experiment conclusions.
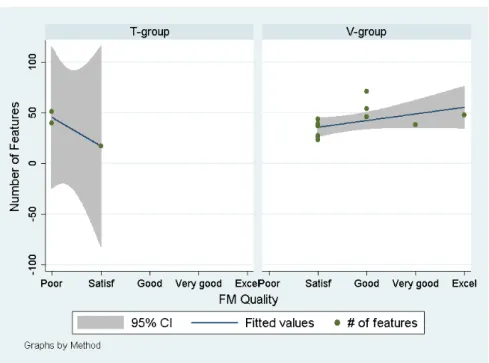
Figure 5 shows correlation between a number of features in an FM and its impact on an FM quality. It appears that, for the text-based tool, more features in a model tend to reduce overall quality of an FM. This might make sense since the larger textual models require increased cognitive efforts on the user side. However, the visual tool demonstrates the opposite tendency: More features in an FM in general lead to a slight linear increase of FM quality. Unlike the T-group users, the participants who worked with visualized FMs did not have to deal with the increased cognitive load necessary due to cumbersome, non-human friendly, text models. Rather, they could dedicate more of their cognitive processing power on tasks that would yield higher model quality.
Fig. 5. Scatter plot that correlates a number of features in an FM and its impact on a FM quality.
The next question that we need to answer is whether the data come from normal distributions. Unfortunately, our samples are very small. We use the Shapiro-Wilk W test for normal data with a P-value of 0.05 as a cutoff.
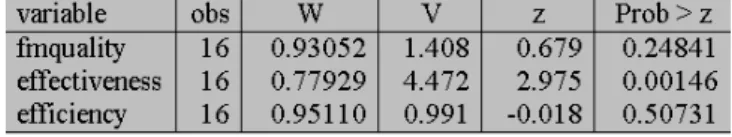
Fig. 6. Shapiro-Wilk W test for normal data.
The lower the P-value is, the smaller the chance that the sample data comes from a normal distribution. Figure 6 shows that only the P-value of Effectiveness is lower than 0.05, which means that its sample deviates from normality.
Our experimental design uses one independent variable with two levels (in-dependent groups V and T). In addition, the scale of measurement for all three dependent variables is ordinal, and the picture is mixed when it comes to distri-bution of the data. Because of all of this, we decided to use the Mann-Whitney Rank Sum Test (also known as Wilcoxon Rank Sum Test) for the statistical anal-ysis of the experimental results. It is a non-parametric test for comparing two groups which does not assume anything about data normality. Essentially, the run-sum test attempts to provide a statistical answer to the question of whether the two population distributions are different. Another advantage of this test is that it is not sensitive to outliers. This is an important consideration for the experiment analysis, since it relies on a very small population sample (13 from V-group and 3 from T-group, 16 valid samples in total) with 2 outliers.
The two-sample rank-sum tests the null hypothesis that two independent samples are from populations with the same distribution. With only 16 obser-vations, the departure would have to be substantial to reject the uniform null hypothesis. We used the “porder” option of the rank sum command to calculate this departure, that is, the probability that a random draw from the first sample (T-group) is larger than a random draw from the second sample (V-group). The probabilities for FM Quality, Effectiveness and Efficiency were 10.3%, 16.7% and 17.9% respectively. The finding was that the two-sample rank-sum tests for all three variables rejected the null hypothesis meaning that there is significant statistical difference between the group that used text-based tool and the group that used visual tool.
5.2 Summary
In this experiment, we evaluated the impact of the new tool on novice SPL practi-tioners when working with relatively small FMs. The experiment results provide some evidence that FM visualizations can be beneficial. The users not only au-thored FMs of a higher quality but also consistently demonstrated improved
productivity expressed in terms of user effectiveness and efficiency. However, further research is required to identify whether this outcome still holds for SPL experts working with FMs on a larger scale.
6
Threats to Validity
6.1 External Validity
Our evaluation is based on the assumption that we were measuring effects of working with representative FMs that model a real-world artifact. However, the models created as a part of this experiment came from the academic environ-ment, and there is no guarantee that they share characteristics with industrial FMs. The majority of published FMs have a couple of hundred features at most. The number of features we saw in the experimental FMs ranged from the 20s to the 70s. One of the largest documented FM is the feature model of a Linux kernel [32] with over 5500 features, and thousands of constraints. An FM of this scale would clearly pose a responsiveness challenge to the FAMILIAR language in its current state; we will continue to work on improving performance of FAMILIAR when applied to very big FMs.
Since this experiment was conducted in two geographic locations, and we had limited resources with time constraints, we could not afford to ask both groups to evaluate both tools. Originally, we wanted to use the blocking technique as a part of our experimental design and rotate the groups, asking each group to replicate the experiment with another tool. However, this turned out to be time consuming and we had to adopt a smaller-scale option. As a consequence, the V-group, which happens to have somewhat better exposure to SPL and Feature Modeling, served as our treatment group working with visualized FMs. This created the specific situation of the experiment that might limit its generalizability. In order to mitigate this risk, we made sure to provide the same introductory training on SPL, Feature Modeling and FAMILIAR to all the participants in each group.
The experiment is conducted exclusively with novice modelers thus limiting its generalizability.
6.2 Internal Validity
A selection bias risk might be introduced when differences between variable groups interact with the independent variables and thus interferes with the ob-served outcome.
Since we used two tools from the same FAMILIAR environment, we mitigated the tool selection bias risk when evaluating the effect of presenting FMs (e.g., visual vs. textual form). Similarly, all participants were alike (e.g., grad CS students, novice SPL practitioners) with regard to the independent variable.
Repeatedly attempting to perform FM creation during the experiment ses-sion, would eventually teach participants to create better FMs in less time. We imposed the restriction of allowing only one session with the tool (with no al-lowed repetitions), regardless of its outcome.
6.3 Construct Validity
The most significant threat to the construct validity of the experiment is that all of our dependent variables use an ordinal scale. Does the experimental data provide accurate measurements of what it is intended to measure? According to [22], there are several notable threats caused by the ordinal scale measurement. For example, the ordinal labels could be inconsistently interpreted among dif-ferent users. In addition, the distance between the difdif-ferent labels of an ordinal scale might not present a clear comparison between the significance of various ordinal labels. Taken together, these problems could have impacted the construct validity of the FAMILIAR Tool evaluation.
In order to mitigate this threat we used the statistical techniques that respect the specifics of ordinal data. Our analysis therefore focused on summarizing the central tendencies and statistical significances rather than trying to come up with exact metrics.
7
Related Work
Several previous works consider the importance of software visualization in the context of SPLE, especially for the configuration management phase. Pleuss et al. [29] identify and analyze benefits of the existing software visualization tech-niques such as feature trees, decision trees, tree maps, and cone trees. Similarly, Cawley et al. [10] combine principles from cognitive theory and visualization techniques. Schneeweiss et al. [30] introduce an interactive technique, the “Fea-ture Flow Maps”, which combines tree-oriented fea“Fea-ture models and flow map visualizations. Thiel et al. [34] provide summary on techniques, tools and means to support variability through visualization. Janota et al. [24] describe the con-cept of providing better tool support in an interactive configuration scenarios where users work from one complete configuration to another by adapting only those features that are important to them. The work presented in this paper is complementary with their work since they both aim to reduce the cognitive complexity of large FMs. The difference is that in their work authors investi-gated interactive forms of visualization whereas we explored the combination of text-based and graphical FM representations to improve usability and model quality.
8
Conclusions and Future Work
In this paper we presented an extension of a textual DSML for feature modeling and an evaluation of the resulting development environment. The evaluation aimed at answering the question: Does the lack of support for visualizing FMs in FM development tools hinder the usability of these tools when managing multiple and large FMs during modeling sessions?
We found evidence that using the new FAMILIAR Tool with visualized FMs resulted in an increased cognitive efficiency and effectiveness of novice practi-tioners which also led to the improved quality of FMs they created. To the
best of our knowledge, this is the first work which describes and evaluates com-bined graphical-textual tooling for feature modeling. Having essentially the same underlying environment for both FAMILIAR tools allowed us to observe the po-tential benefits of FM visualization, without interfering differences that would likely arise from using different tools. However, an experiment on a larger scale would be required to identify whether this outcome would hold for SPL experts that work with larger and scripted FMs.
A larger scale experiment is thus in our immediate future work plan. The FAMILIAR language has capabilities to manipulate several FMs, to write scripts that inputs and outputs FMs and other relevant types such as configurations. We also want to investigate appropriate visual support when dealing with these operations. To do so, we plan to provide feature diagram visualizations with a more compact form using aggregated values and indicators. In the longer term, we want to tackle issues related to the evolution of feature models, as well as relationships between several FMs, as in multiple software product lines. We expect these advances to provide support and insights for a better and wider usage of feature modeling in software product line engineering.
References
1. ISO 9241-11: Ergonomic requirements for office work with visual display terminals (VDTs) - part 11 : Guidance on usability. Tech. rep., International Organization for Standardization, Geneva (1998)
2. Acher, M.: Managing Multiple Feature Models: Foundations, Language and Ap-plications. Ph.D. thesis (2011)
3. Acher, M., Collet, P., Lahire, P., France, R.: FAMILIAR: A Domain-Specific Lan-guage for Large Scale Management of Feature Models. Science of Computer Pro-gramming (SCP) Special issue on proPro-gramming languages p. 55 (Dec 2012) 4. Acher, M., Collet, P., Lahire, P., France, R.: Familiar: A domain-specific language
for large scale management of feature models. Science of Computer Programming (SCP) Special issue on programming languages 78(6), 657–681 (2013)
5. Asikainen, T., M¨annist¨o, T., Soininen, T.: Using a configurator for modelling and configuring software product lines based on feature models. In: In Workshop on Software Variability Management for Product Derivation, Software Product Line Conference (SPLC3. pp. 24–35 (2004)
6. Bak, K., Czarnecki, K., Wasowski, A.: Feature and meta-models in clafer: mixed, specialized, and coupled. In: SLE’10. pp. 102–122. LNCS, Springer (2011) 7. Batory, D.S.: Feature models, grammars, and propositional formulas. In: SPLC’05.
LNCS, vol. 3714, pp. 7–20 (2005)
8. Bevan, N.: Measuring usability as quality of use. Software Quality Journal 4(2), 115–130 (1995)
9. Britton, C., Jones, S.: The untrained eye: how languages for software specification support understanding in untrained users. Human–Computer Interaction 14(1-2), 191–244 (1999)
10. Cawley, C., Healy, P., Botterweck, G.: A discussion of three visualisation ap-proaches to providing cognitive support in variability management (2010) 11. Classen, A., Boucher, Q., Heymans, P.: A text-based approach to feature modelling:
Syntax and semantics of TVL. Science of Computer Programming, Special Issue on Software Evolution, Adaptability and Variability 76(12), 1130–1143 (2011)
12. Classen, A., Boucher, Q., Heymans, P.: A text-based approach to feature mod-elling: Syntax and semantics of {TVL}. Science of Computer Programming 76(12), 1130 – 1143 (2011), http://www.sciencedirect.com/science/article/ pii/S0167642310001899, special Issue on Software Evolution, Adaptability and Variability
13. Czarnecki, K., Eisenecker, U.: Generative Programming: Methods, Tools, and Ap-plications. Addison-Wesley (2000)
14. Czarnecki, K., Wasowski, A.: Feature diagrams and logics: There and back again. In: SPLC’07. pp. 23–34. IEEE (2007)
15. Deursen, A.v., Klint, P.: Domain-specific language design requires feature descrip-tions. Journal of Computing and Information Technology 10(1), 1–17 (2002) 16. FAMILIAR: FeAture Model scrIpt Language for manIpulation and Automatic
Rea-sonning: http://familiar-project.github.io/
17. Ferber, S., Haag, J., Savolainen, J.: Feature Interaction and Dependencies: Mod-eling Features for Reengineering a Legacy Product Line, pp. 37–60 (2002), http: //dx.doi.org/10.1007/3-540-45652-X_15
18. France, R., Rumpe, B.: Model-driven development of complex software: A research roadmap. In: 2007 Future of Software Engineering. pp. 37–54. FOSE ’07, IEEE Computer Society, Washington, DC, USA (2007), http://dx.doi.org/10.1109/ FOSE.2007.14
19. Heer, J., Card, S.K., Landay, J.A.: Prefuse: a toolkit for interactive information visualization. In: Proceedings of the SIGCHI conference on Human factors in com-puting systems. pp. 421–430. ACM (2005)
20. Heinz, M., Levin, J.R.: Knowledge acquisition from text and pictures. Elsevier (1989)
21. Hubaux, A., Boucher, Q., Hartmann, H., Michel, R., Heymans, P.: Evaluating a textual feature modelling language: Four industrial case studies. In: SLE’10, LNCS, vol. 6563, pp. 337–356. Springer (2011)
22. Hubbard, D., Evans, D.: Problems with scoring methods and ordinal scales in risk assessment. IBM Journal of Research and Development 54(3), 2–1 (2010) 23. Jakˇsi´c, A.: Familiar tool v1.0.5 (beta) - demo (2014), http://www.screencast.
com/t/BdPgI8yF17Y/
24. Janota, M., Botterweck, G., Marques-Silva, J.: On lazy and eager interactive re-configuration. In: Proceedings of the Eighth International Workshop on Variability Modelling of Software-Intensive Systems. pp. 8:1–8:8. VaMoS ’14, ACM, New York, NY, USA (2013), http://doi.acm.org/10.1145/2556624.2556644
25. Javier, F., Garcia, P., Laguna, M.A., Gonzalez-carvajal, Y.C., Gonzalez-baixauli, B.: Requirements variability support through mdd and graph transformation 26. Kang, K., Kim, S., Lee, J., Kim, K., Shin, E., Huh, M.: Form: A feature-oriented
reuse method with domain-specific reference architectures. Annals of Software En-gineering 5(1), 143–168 (1998)
27. Kang, K.C., Cohen, S.G., Hess, J.A., Novak, W.E., Peterson, A.S.: Feature-oriented domain analysis (foda) feasibility study. Tech. rep., DTIC Document (1990) 28. Larkin, J.H., Simon, H.A.: Why a diagram is (sometimes) worth ten thousand
words. Cognitive science 11(1), 65–100 (1987)
29. Pleuss, A., Rabiser, R., Botterweck, G.: Visualization techniques for application in interactive product configuration. In: Proceedings of the 15th International Soft-ware Product Line Conference, Volume 2. pp. 22:1–22:8. SPLC ’11, ACM, New York, NY, USA (2011), http://doi.acm.org/10.1145/2019136.2019161
30. Schneeweiss, D., Botterweck, G.: Using flow maps to visualize product attributes during feature configuration. In: SPLC Workshops. pp. 219–228 (2010)
31. Selic, B.: The pragmatics of model-driven development. Software, IEEE 20(5), 19– 25 (2003), http://dx.doi.org/10.1109/ms.2003.1231146
32. Sincero, J., Schr¨oder-preikschat, W.: The linux kernel configurator as a feature modeling tool (2008)
33. van der Storm, T.: Variability and Component Composition, pp. 157–166. Software Reuse: Methods, Techniques and Tools (2004), http://www.springerlink.com. gate6.inist.fr/content/k3nlvkm5uqj425x3
34. Thiel, S., Cawley, C., Botterweck, G.: Visualizing software variability. In: Capilla, R., Bosch, J., Kang, K.C. (eds.) Systems and Software Variability Management, pp. 101–118. Springer (2013)
35. Winn, W.: Learning from maps and diagrams. Educational Psychology Review 3(3), 211–247 (1991)
36. Wohlin, C., Runeson, P., H¨ost, M., Ohlsson, M.C., Regnell, B., Wessl´en, A.: Ex-perimentation in software engineering. Springer (2012)