HAL Id: hal-02386364
https://hal.archives-ouvertes.fr/hal-02386364
Submitted on 29 Nov 2019HAL is a multi-disciplinary open access
archive for the deposit and dissemination of sci-entific research documents, whether they are pub-lished or not. The documents may come from teaching and research institutions in France or abroad, or from public or private research centers.
L’archive ouverte pluridisciplinaire HAL, est destinée au dépôt et à la diffusion de documents scientifiques de niveau recherche, publiés ou non, émanant des établissements d’enseignement et de recherche français ou étrangers, des laboratoires publics ou privés.
Period -control in a coupled system of two genetic
oscillators for synthetic biology
Eleni Firippi, Madalena Chaves
To cite this version:
Eleni Firippi, Madalena Chaves. Period -control in a coupled system of two genetic oscillators for syn-thetic biology. FOSBE 2019 - 8th IFAC Conference on Foundations of Systems Biology in Engineering, Oct 2019, Valencia, Spain. �10.1016/j.ifacol.2019.12.238�. �hal-02386364�
This is a preliminary version of the article published at:
8th IFAC Conference on Foundations of Systems Biology in Engineering (Valencia, Spain), 2019.
Period - control in a coupled system of two genetic oscillators
for synthetic biology
Eleni Firippi and Madalena Chaves∗ November 28, 2019
Abstract
Biological complex mechanisms with oscillatory behavior are often modeled by high dimen-sional nonlinear ODEs systems, which makes the analysis and understanding the dynamics of the system difficult. In this work, we consider two reduced models that mimic the oscillatory dynamics of the cell cycle and the circadian clock, and study their coupling from a synthetic biology perspec-tive. To improve the performance and robustness of the oscillatory dynamics in a living cellular environment, we consider the problem of augmenting the parameter region admitting periodic so-lutions. Moreover, we study the capacity for mutual period regulation and control of the coupling between the two reduced oscillators.
1
Introduction
Biological oscillators often involve a complex network of interactions, as in the case of circadian rhythms or cell cycle. Mathematical modeling and especially model reduction help to understand the main mechanisms behind oscillatory behavior. Low dimensional systems can be found at the core of oscillatory dynamics, such as a basic 3-dimensional negative feedback loop or a 2-dimensional negative loop with self-regulation (Smolen et al. (1998)). Moreover, both of these systems have been syntheti-cally constructed in living cell environment and indeed shown to oscillate (Elowitz and Leibler (2000), Stricker et al. (2008), Purcell et al. (2010)).
A new challenge in synthetic biology is to study the behavior of an oscillator when coupled to another system (Tomazou et al. (2018), Perez-Carrasco et al. (2018)). Interesting questions include the tuning capacity and period control for the coupled system. In this context, we perform a model-based investigation for the coupling between two oscillators, mimicking the cell cycle and circadian clock. This analysis aims to contribute to gain further intuition on the interactions between these oscillators (Feillet et al. (2015)) and their mutual regulation of the period of oscillations.
A simple model proposed by Smolen et al. (1998), consists of two transcriptional factors that compete with each other in a negative feedback loop, possibly generating oscillatory behavior. Such a system is able to describe complex autonomous mechanisms like the circadian clock, in terms of their function and properties, i.e. oscillatory behavior, feedback, autoregulation of the transcriptional factors.
To characterize the region of parameters which admits sustained oscillations for the Smolen model, we first compute numerically the limit cycle solutions of the system as a function of its parameters, and then propose one way to increase the region of sustained oscillations.
∗The authors are with Universit´e Cˆote d’Azur, Inria, INRA, CNRS, Sorbonne Universit´e, Biocore team, Sophia Antipolis,
France. The authors were partly supported by the French national agency for research through project ICycle ANR-16-CE33-0016-01.
A two-dimensional model for the cell cycle was recently proposed by Almeida et al. (2017). It represents the concentration of cyclin B and a complex APC that promotes exit from mitosis. This model was calibrated from experimental data and its region of oscillations can also be characterized in terms of the parameters.
A short outline of this paper is as follows: in Sections 2 and 3 we introduce the two models with an improved version of Smolen oscillator. Section 4 contains the coupling schemes for the two models. Section 5 explores the coupled system dynamics and its period response. Lastly, in Section 6 we give an overall view of our results and some aspects for their application in synthetic biology.
2
Two genetic oscillators
In gene regulatory networks, the molecular links between the components of the network can be ex-pressed through a system of ODEs: ˙xi= fi(x1, . . . , xn), where the fidepend on the nodes that have an effect on proteins concentrations xi, ∈ [0, +∞), i = 1, . . . , n of the gene i. The most common forms of interactions are: binding or unbinding of two molecules, inhibition, activation and degradation. These interactions can be translated into mathematical expressions based on mass-action laws, saturation or Hill functions.
2.1 The Smolen oscillator
The two dimensional model introduced in Smolen et al. (1998) is composed of two transcription factors TF-Aand TF-R and models a negative feedback circuit of a form that appears for instance in the mech-anism of the circadian clock: TF-A is a transcriptional activator that can bind to responsive elements DNA sequences (REs) and TF-R is a protein that represses transcription by competing with TF-A for binding to REs. Besides the core negative feedback loop there are also additional negative and positive autoregulations to the activator and the repressor. For simplicity, TF-A and TF-R are denoted A and Rrespectively. Considering that A activates both components and R represses both components in a similar way the model of the oscillator becomes:
dA dt = VA A2 A2+ θ 0(1 + R/θ2) − γAA+ rbas dR dt = VR A2 A2+ θ 1(1 + R/θ2) − γRR (1)
The parameters VA, VR > 0 express the synthesis rate of the two transcriptional factors and are measured in min−1. The degradation rate parameters γA, γR> 0 are also measured in min−1. The con-centration and activity thresholds θ0, θ1, θ2> 0 are considered to be dimensionless. For the parameter set given by Smolen et al. (1998) (we call it pS) the model has a periodic solution.
System (1) is a good candidate for implementation in synthetic biology, due to its reduced dimen-sion. One version of this oscillator was indeed implemented using the gene lacI as a repressor and araC as an activator (see Stricker et al. (2008), Purcell et al. (2010)). However, in a neighbourhood of pS, the region of parameters where oscillations are observed is rather small. In this study, our first goal is to better understand the effect of each parameter in generating oscillations, and propose a more efficient design.
Three alternative cases for the model have been explored with the objective of improving the de-sign of system (1), such that periodic solutions are observed for a larger region of the parameter set: (a) eliminating the autoregulation of the repressor (negative self-loop on R), (b) eliminating the autoregu-lation of the activator (positive self-loop on A) and (c) eliminating both self-loops. From our analysis and simulations only the first case (a) appeared to admit periodic solutions.
Table 1: Parameters of improved Smolen model
VA= 12.5 min−1 VR= 0.3 min−1 γA= 1 min−1 γR= 0.2 min−1
θ0= 10 θ1= 16
rbas= 0.4 min−1 θ2= 0.2
2.2 An improved Smolen oscillator
A
R
Figure 1: Smolen oscillator with activator autoregulation.
If the self-inhibition loop on R is removed the system (1) becomes:
dA dt = VA A2 A2+ θ 0(1 + R/θ2) − γAA+ rbas dR dt = VR A2 A2+ θ 1 − γRR (2)
In the next paragraphs, we will compare the dynamics of the original system (1) with the alternative (2). Using the numerical toolbox Matcont for MATLAB Dhooge et al. (2003) we perform bifurcation analysis for the model parameters.
First, we performed bifurcation analysis for the activator synthesis rate parameter VA, for the orig-inal model (1) and case (2), shown in Fig. 2. Comparing the results we observe that the interval in which periodic solutions exist for the system, increased significantly for the case (2): the length of the interval increased by a factor 6. A second observation is that the amplitude of the limit cycle increased -approximately doubled- for (2).
We also perform a two parameter bifurcation analysis for the remaining parameters of (1) and (2). The results are in an agreement with the one parameter analysis regarding the increase of the oscillations interval. From the comparison we conclude that removing the autoregulation of the repressor increases the parameter region where oscillations exist, by approximately doubling the range allowed for each parameter.
We further analyse the system (2) in the context of the piecewise affine formalism (PWA), intro-duced by Glass and Kauffman (1973), and we obtain certain conditions for its parameters. In particular, a closer look in the analysis of the PWA system, shows that requiring√θ1>
√
θ0, see Table 1, we can compute the first return map of the PWA system and prove that it has a unique fixed point which is unstable, Firippi and Chaves (In preparation).
To establish now that (2) can be interpreted as a minimal mammalian clock model we consider that the activator A represents the fundamental protein BMAL1 which activates the transcription of several clock proteins, including REV-ERBα, PER and CRY. In turn, there is also an auxiliary loop of REV-ERBα which inhibits BMAL1 making it a good candidate for the repressor R. The proteins CRY and PER form a complex (PC) which binds to BMAL1 to inhibit the transcription of genes that are regulated by CLOCK-BMAL1, as well as their own transcription (autoregulation) Ye et al. (2014). Describing in a simplified way, BMAL1 and PC mutually inhibit each other’s activities by binding. The positive self-regulation of A can be interpreted as the result of this double negative loop.
9 10 11 12 0 1 2 3 4 5 6 H
Figure 2: Bifurcation analysis for the VA parameter (synthesis rate of A) and the the amplitude of the limit cycle, for the two systems, the Smolen model and case (2). The red stars indicate critical Hopf bifurcation.
2.3 A cell cycle reduced model
The reduced model of the mammalian cell cycle developed by Almeida et al. (2017) is a system of two variables: MPF (mitosis promoting factor) which is a cyclin-Cdk complex that phosphorylates multiple proteins during mitosis phase, and APC:cdc20, (subunit of the anaphase-promoting complex) which is a large complex of proteins that promote exit from mitosis phases through MPF and other kinases degradation. The network consists of an activator (MPF) and an inhibitor (APC:cdc20), both of them crucial components of cell division. This two-variable model was calibrated from experimental data, Pomerening et al. (2005) and shown to reproduce the observations in a very reasonable way. The two dimensional model is as follows:
d[APC : cdc20] dt = Vm[MPF] − Vk[APC : cdc20] d[MPF] dt = SGF+Vc MPFmax− [MPF] MPFmax− [MPF] + kc [MPF]m [MPF]m+ km m − Vw [MPF] [MPF] + kw knn [MPF]n+ kn n − γ1[APC : cdc20][MPF],
with parameters given in Table 2. Very briefly, the constant SGF represents growth factor, the term in Vcrepresents the positive feedback loop involving cdc25, while the term in Vwrepresents the double negative loop involving wee1.
Table 2: Parameters of cell cycle model
Vm= 0.0168 min−1 Vk= 0.0107 min−1 SGF= 5.6917 min−1 Vc= 225.71 min−1 Vw= 747.61 min−1 MPFmax= 284.1087 kc= 130.3331 km= 98.5219 kw= 137.9830 kn= 0.1164 γ1= 0.0162 min−1 m, n = 2
APC
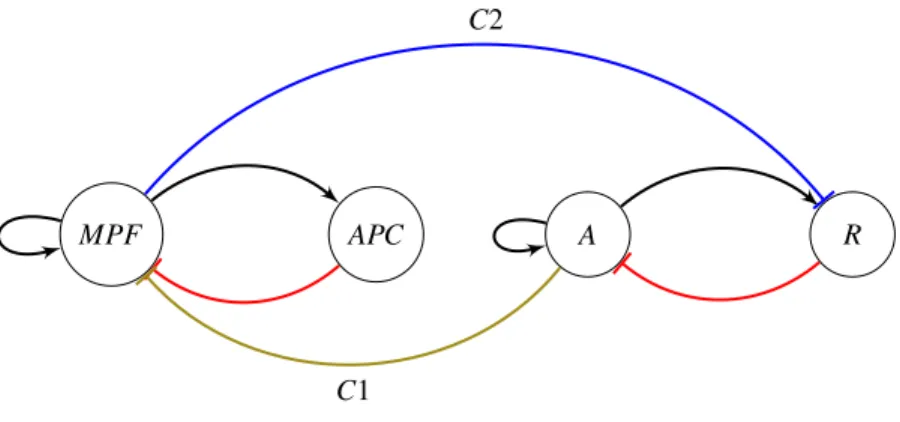
MPF A R
C1
C2
Figure 3: Cell cycle and Smolen oscillator coupled network
3
Interactions between the two oscillators
In mammalians, it is known that the circadian clock affects the cell cycle, and more recently there has been evidence that the cell cycle may also directly affect the clock Feillet et al. (2014). Thus, in addition to their specific characteristics as biological processes, a very important aspect to be studied is their interaction: in some tissues, the pace with which the cell divides into two daughter cells (mitosis phase) is regulated by the cell circadian clock, Feillet et al. (2014), ¨Unsal-Kac¸maz et al. (2005). More precisely, the regulation of one specific kinase-inhibitor of the cell cycle,Wee1, by the clock genes, has been observed and explains the circadian control of cell cycle division G´erard and Goldbeter (2012), Matsuo et al. (2003).
3.1 A scheme for bidirectional coupling
To model the interaction from the circadian clock to the cell cycle we have that: the activator A in the Smolen model, that stands for the complex CLOCK/BMAL1, influences the cell cycle through activation of the kinase Wee1 that inhibits MPF, G´erard and Goldbeter (2012) , Matsuo et al. (2003).
The influence of the cell cycle on the clock is less clear, but an hypothesis is that of Feillet et al. (2015): the protein MPF inhibits the nuclear receptor REV-ERBα that is assumed as the component R (repressor) of the Smolen oscillator. We mention that there is no specific evidence on the form of clock regulation by the cell cycle, see in Feillet et al. (2015), so our current study will explore several possibilities for coupling schemes. A general scheme for bidirectional coupling between the two oscillators is shown in Fig. 3.
3.2 Period - response analysis
To better analyse the period response of the coupled system, and to identify whether either of the oscillators has a dominant contribution, we develop the following criteria.
We characterize the two systems as controller and follower comparing the 3 period values, the cell cycle period Tcc, the Smolen oscillator period TSmolenand the coupled system period Tbi. Then define:
Definition 1 Let Tmin= min{Tcc, TSmolen, Tbi},
Tmax= max{Tcc, TSmolen, Tbi} and Tintbe the intermediate of the three period values. Then the controller is defined to be the oscillator with the period closer to that of the coupled system:
(a) If Tbi= Tminor Tbi= Tint and Tbi Tmax minnTbi Tint ,Tmin Tbi o
then the controller is the oscillator with lower period. (b) If Tbi= Tminor Tbi= Tint and
Tbi Tmax maxnTbi Tint ,Tmin Tbi o
then the controller is the oscillator with higher period. (c) If Tbi= Tmaxand
Tint Tmax
≈ 1 then the controller is the oscillator with higher period. (d) If Tbi= Tminor Tbi= Tint and
Tmin Tint −Tmin Tmax < ε or Tmin Tint − Tint Tmax < ε
for ε = 0.1, then no oscillator is considered as controller.
4
Two coupling mechanisms
Following the discussion in Section 4, we investigate two general cases: the oscillators affect each other through synthesis or through degradation rates.
4.1 Coupling through synthesis rate
First, we consider the case where the clock acts on the cyclin complex MPF synthesis rate, i.e. BMAL1/CLOCK modulates parameter Vc, which expresses the activation of the kinase cdc25. The coupling is expressed
through a saturation function:
C1 = v1 δ1 δ1+ A
(3)
where δ1represents the coupling strength and v1guarantees that the concentrations remain at suf-ficient levels. The term C1 multiplies Vc.
Conversely, the complex MPF acts on REV-ERBα synthesis rate by inhibition: C2 = v2
δ2 δ2+ MPF
(4)
The term C2 multiplies VRin (2).
We study the interaction between the two oscillators as a function of the coupling strength. First, our results show that, through bidirectional coupling the two oscillators lock at phase 1:1. Second, varying the coupling parameters, the clock tends to play the role of controller, see Fig. 5, top. Indicatively, for v1, v2= 1.2, and for coupling strengths δ1= 0.5 and δ2= 100, (corresponding to 0.14 % of the maximum value of A and 91.65 % of the maximum value of MPF in the uncoupled systems), there is strong effect from the clock and weaker from the cell cycle : Tbi
Tcc
= 0.22 while Tbi TSmolen
= 0.92.
4.2 Coupling through degradation
We now investigate the case where the clock acts directly on the degradation rate of the MPF component of the cell cycle. The coupling term now is expressed through an increasing function since A promotes degradation rate of MPF:
0 400 0 120 0 100 0 1.2
Figure 4: Activity of variables MPF (cell cycle) and R (clock), with or without couplig (respectively, solid and dashed lines). Strong coupling from the side of the clock, initial period TSmolen= 30 min, Tcc = 126.77 min, period of the coupled system: Tbi = 27.78 min. Coupling parameters used: v1, v2= 1.5, δ1= 1.5, δ2= 100. 0 100 200 300 0 1 2 3 4 5 6 7 8
Figure 5: Coupled system period - response in the two interaction cases, as the coupling strengths δ1, δ2vary. Remaining parameters used: see Table 1 for the Smolen model, Table 2 for the cell cycle, v1,v2 =1.
C1 = v1 A δ1+ A
(5)
This function will multiply the term −γ1APC MPF, in MPF equation of cell cycle model.
Likewise, MPF now promotes the degradation rate of the REV/ERB-α. The coupling term will be:
C2 = v2
MPF δ2+ MPF
(6)
The term C2 will multiply the degradation rate −γR R, in R equation of the Smolen model, see (2). This scheme of interactions allows a wider range of period responses, as illustrated in Fig. 5, bottom. For instance, we now present a case where both oscillators strongly contribute to the coupling. With coupling parameters v1, v2 = 1, δ1= 0.5, δ2= 100 and uncoupled periods TSmolen= 30 min, Tcc= 126.77 min, the period of the coupled system is Tbi = 63.68 min, with ratios:
Tbi Tcc
= 0.5 and TSmolen
Tbi
= 0.43. Two ratios are very close so, according to Definition 3.2, none of the oscillators is a controller.
4.3 Controller - follower results
We are interested in exploring the coupling parameter range for which the two systems play the roles controller - follower. In Fig. 5 top, for the first interaction case (coupling through synthesis), we see that varying the coupling strength from the side of clock δ1, the period of the coupled system stays close to that of the clock. Thus, according to Definition 3.2, the clock is the controller in this case.
We also observe that δ2 (cell cycle → clock) does not greatly affect the qualitive period response. Whereas in the case of interaction through degradation rate (Fig. 5, bottom), the coupled system period varies with both δ1 and δ2. To interpret the controller - follower results in both coupling cases, we extract information from the bifurcation analysis for the synthesis and degradation parameters of the two systems. (Bifurcation analysis performed using Matcont.)
Cell cycle controlsIn the case of coupling through degradation the cell cycle is able to play the role of the controller, as δ2increases and δ1 remains low. This result can be interpreted as a stronger action from the cell cycle on the coupling: δ1≤ 0.5, is less than the minimum concentration value of the uncoupled A and δ2≤ 109.1 lower than the maximum uncoupled MPF, so it is likely that the term C2(6) contributes to significantly decrease the degradation rate of R. The latter results in the decrease of concentration of A, which finally can only weakly inhibit the cell cycle through MPF. In a simplified way, weak action from the side of clock allows the cell cycle to control the coupled system period; indicatively, our results show Tbi
Tcc
≈ 1, for δ2= 100 and 0.2 < δ1≤ 0.5.
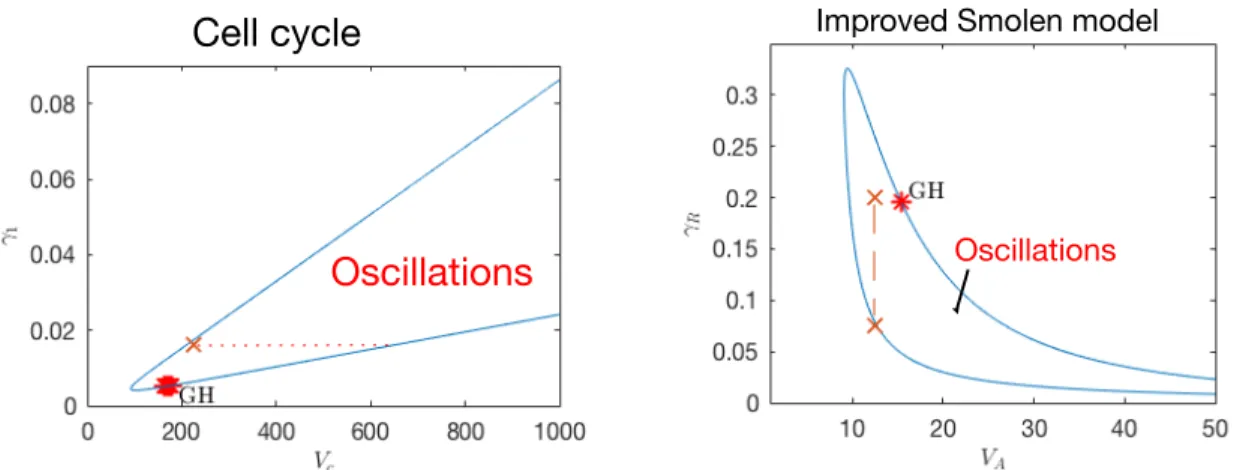
For a deeper analysis of this scenario, we extract information from the bifurcation analysis for the synthesis and degradation parameters of the uncoupled Smolen system. In Fig. 6 right we indicate the parameter region where the uncoupled Smolen oscillates. We note that for the initial VA= 12.5 min−1 the system becomes stable for γR< 0.077 min−1. Hence, as the coupling strength δ2 from the side of cell cycle increases the term −γRC2decreases and the system has no longer periodic solutions. The cell cycle in this case is able to play the role of the controller when the Smolen system is close to exit the oscillatory region. For instance, if δ2= 80 (δ1= 0.5), we have that −γRC2< 0.14 and
Tbi Tcc
= 0.8, see Fig. 7 (bottom).
Cell cycle
Oscillations
Improved Smolen model
Oscillations
Figure 6: Bifurcation analysis for cell cycle synthesis and degradation parameters (left) and the im-proved Smolen model (right). The red stars indicate Generalized Hopf points.
Clock controls As we observe in Fig.6 (left) the uncoupled cell cycle becomes stable for γ1< 6.4 × 10⁻³if Vc= 225.71 min−1. In the case of coupling through degradation, the term C1(5) becomes very small as δ1 increases, (Fig. 7 top), thus it forces the cell cycle to become stable: for δ1 > 1, (δ2= 100) we have that −γ1C1< 5 × 10⁻³. Under these coupling parameter conditions, clock is the controller with Tbi
TSmolen
≥ 0.7, Fig. 5 bottom. This observation can be interpreted as: the clock is more likely to be the controller of the coupled system period when the cell cycle starts to loose its instability due to the coupling strength.
In the case of coupling through MPF synthesis rate the cell cycle looses instability much faster than in the case of degradation: the initial γ1value is 0.0162 min−1 and for Vc< 210 min−1system (3) has no longer periodic behavior, see the bifurcation analysis in Fig. 6 left. Since the initial Vc value is 225.71 min−1the term VcC1decreases immediately as δ1increases, C1as in (3). One can translate this behavior as a strong clock effect on the coupled system period response, in this case (Fig. 5 top).
4.4 Effect of synthesis rates parameters
We now investigate the effect on the coupled system period of varying each oscillator period. This is done separately by varying the synthesis rate parameters Vcof MPF and VAof A.
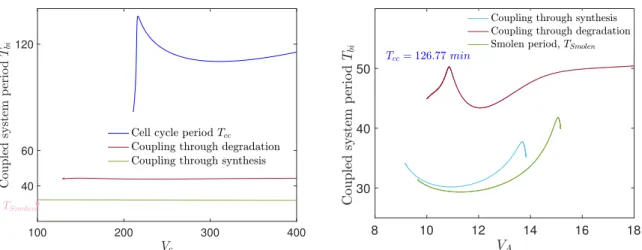
In Fig. 8 (top), we observe that increasing Vcthe coupled system period remains constant for both interaction cases. However, in the case of coupling through degradation, the coupled system period is greater than in case of coupling through synthesis. An interesting observation is that even when the cell cycle is at a stable steady state (for Vc< 209 min−1), the coupled system manifests oscillations in both interaction cases.
Varying now the synthesis rate of A (at bottom of Fig. 8), we notice that for VA> 12 min−1 the uncoupled clock period increases and so does the coupled period. The latter is strongly controlled by the clock when the coupling is through synthesis rate. In the case where the coupling is through degradation rate, Tbitakes higher values reflecting the cell cycle contribution.
It is surprising though, that for VA > 15.5 min−1 the clock (Smolen system) is at a stable steady state, whereas the coupled system oscillates with period around 50 min. In this way the cell cycle forces the clock (Smolen system) to oscillate. This observation can be interpreted as the capacity of the cell cycle to induce oscillations of the coupled system even when the clock is at a steady state.
In the bifurcation diagram for the parameters VA, γR of Fig. 6 we observe that as γRreaches values lower than 0.02 min−1the interval for periodic solutions of VAshifts to the right and increases. Indeed,
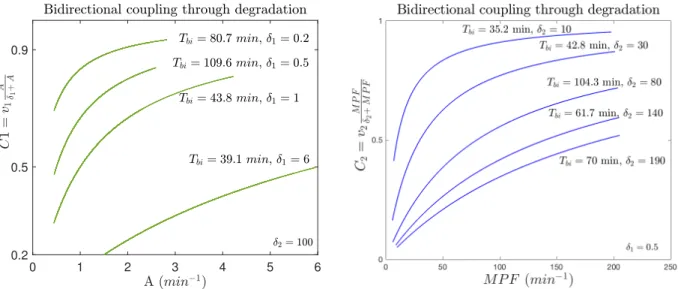
0 1 2 3 4 5 6 0.2
0.5 0.9
Figure 7: The term C1in coupling through degradation, as a function of the activator A concentration amplitude (top) v1, v2= 1, δ2= 100. The term C2in coupling through degradation, as a function of MPF concentration amplitude (bottom) v1, v2= 1, δ1= 0.5.
with coupling through degradation rate, the term −γRC2 decreases as δ2 increases, see Fig. 7 bottom, C2 as in (6). For example, for δ1= 1 and δ2= 100 ⇒ 0.05 < −γRC2< 0.7, so R degradation rate decreases allowing VA to take higher values in the oscillatory region, see Fig. 6 right. Thus, although the uncoupled Smolen system is at a stable steady state, the coupled system oscillates as it is shown in Fig. 8 (bottom).
5
Conclusion
In this paper we present a model-based investigation of the cell cycle and circadian clock coupling, using two reduced models. We consider two bidirectional schemes for the coupled system and observe that: (i) generally, in the case of coupling through synthesis rates, the coupled system closely follows the clock period, (ii) in the case of coupling through degradation rates, the cell cycle may have a higher contribution on the coupling. In either scheme, it is interesting to note that each of the oscillators can alone induce oscillations in the coupled system, implying that the coupling contributes to increase the parameter region where oscillations happen.
Many different coupling schemes remain to be discussed and tested. However, the current analysis provides some indications on how to couple the two systems so that the joint periodic behavior is improved and also suggests ways of regulating the period of the coupled system through one of the oscillators. These are promising directions to consider in the context of synthetic biology.
References
Almeida, S., Chaves, M., Delaunay, F., and Feillet, C. (2017). A comprehensive reduced model of the mammalian cell cycle. IFAC-PapersOnLine, 10.1016/j.ifacol.2017.08.2204.
Dhooge, A., Govaerts, W., and Kuznetsov, Y. (2003). Matcont: a matlab package for numerical bifur-cation analysis of odes. ACM Trans. Math. Softw., 10.1145/980175.980184.
Elowitz, M.B. and Leibler, S. (2000). A synthetic oscillatory network of transcriptional regulators. Nature, 403(6767), 335–338.
100 200 300 400 40 60 120 8 10 12 14 16 18 30 40 50
Figure 8: Coupled system period as a function of Vc (synthesis rate of MPF) and VA (synthesis rate of A, bottom) in the two interaction cases. Coupling parameters used: v1, v2= 1, δ1= 1, δ2= 100. Feillet, C., Krusche, P., Tamanini, F., Janssens, R.C., Downey, M.J., Martin, P., Teboul, M., Saito, S.,
L´evi, F.A., Bretschneider, T., van der Horst, G.T.J., Delaunay, F., and Rand, D.A. (2014). Phase lock-ing and multiple oscillatlock-ing attractors for the coupled mammalian clock and cell cycle. Proceedlock-ings of the National Academy of Sciences of the United States of America, 10.1073/pnas.1320474111.
Feillet, C., van der Horst, G.T.J., Levi, F., Rand, D.A., and Delaunay, F. (2015). Coupling between the circadian clock and cell cycle oscillators: Implication for healthy cells and malignant growth. Frontiers in Neurology, 10.3389/fneur.2015.00096.
Firippi, E. and Chaves, M. (In preparation). Improving the design of a synthetic genetic oscillator by piecewise linear approximation.
G´erard, C. and Goldbeter, A. (2012). Entrainment of the mammalian cell cycle by the circa-dian clock: Modeling two coupled cellular rhythms. PLoS Computational Biology, 10.1371/jour-nal.pcbi.1002516.
Glass, L. and Kauffman, S.A. (1973). The logical analysis of continuous, non-linear biochemical control networks. Journal of Theoretical Biology, https://doi.org/10.1016/0022-5193(73)90208-7.
Matsuo, T., Yamaguchi, S., Mitsui, S., Emi, A., Shimoda, F., and Okamura, H. (2003). Control mech-anism of the circadian clock for timing of cell division in vivo. Science, 10.1126/science.1086271.
Perez-Carrasco, R., Barnes, C.P., Schaerli, Y., Isalan, M., Briscoe, J., and Page, K.M. (2018). Combin-ing a toggle switch and a repressilator within the ac-dc circuit generates distinct dynamical behaviors. Cell Systems, 10.1016/j.cels.2018.02.008.
Pomerening, J.R., Kim, S.Y., and Ferrell, J.E. (2005). Systems-level dissection of the cell-cycle oscil-lator: Bypassing positive feedback produces damped oscillations. Cell, 122, 565–578.
Purcell, O., Savery, N.J., Grierson, C.S., and di Bernardo, M. (2010). A comparative analysis of synthetic genetic oscillators. J R Soc Interface, 10.1098/rsif.2010.0183.
Smolen, P., Baxter, D.A., and Byrne, J.H. (1998). Frequency selectivity, multistability, and oscilla-tions emerge from models of genetic regulatory systems. American Journal of Physiology - Cell Physiology, 274(2), C531–C542.
Stricker, J., Cookson, S., Bennett, M.R., Mather, W.H., Tsimring, L.S., and Hasty, J. (2008). A fast, robust and tunable synthetic gene oscillator. Nature, 10.1038/nature07389.
Tomazou, M., Barahona, M., Polizzi, K.M., and Stan, G.B. (2018). Computational re-design of synthetic genetic oscillators for independent amplitude and frequency modulation. Cell Systems, https://doi.org/10.1016/j.cels.2018.03.013.
¨
Unsal-Kac¸maz, K., Mullen, T.E., Kaufmann, W.K., and Sancar, A. (2005). Coupling of human circa-dian and cell cycles by the timeless protein. Molecular and Cellular Biology, 25(8), 3109–3116.
Ye, R., Selby, C.P., Chiou, Y.Y., Ozkan-Dagliyan, I., Gaddameedhi, S., and Sancar, A. (2014). Dual modes of clock:bmal1 inhibition mediated by cryptochrome and period proteins in the mammalian circadian clock. Genes & development, 10.1101/gad.249417.114.