HAL Id: inserm-00150114
https://www.hal.inserm.fr/inserm-00150114
Submitted on 2 Oct 2007
HAL is a multi-disciplinary open access archive for the deposit and dissemination of sci-entific research documents, whether they are pub-lished or not. The documents may come from teaching and research institutions in France or abroad, or from public or private research centers.
L’archive ouverte pluridisciplinaire HAL, est destinée au dépôt et à la diffusion de documents scientifiques de niveau recherche, publiés ou non, émanant des établissements d’enseignement et de recherche français ou étrangers, des laboratoires publics ou privés.
Estimating cancer risk in HNPCC by the GRL method.
Flora Alarcon, Christine Lasset, Jérôme Carayol, Valérie Bonadona, Hervé
Perdry, Françoise Desseigne, Qing Wang, Catherine Bonaïti-Pellié
To cite this version:
Flora Alarcon, Christine Lasset, Jérôme Carayol, Valérie Bonadona, Hervé Perdry, et al.. Estimating cancer risk in HNPCC by the GRL method.: GRL and cancer risk in HNPCC. European Journal of Human Genetics, Nature Publishing Group, 2007, 15 (8), pp.831-6. �10.1038/sj.ejhg.5201843�. �inserm-00150114�
Estimating cancer risk in HNPCC by the GRL method
Flora Alarcon1,2, Christine Lasset3, Jérôme Carayol1,2*,Valérie Bonadona3, Hervé Perdry1,2,
Françoise Desseigne3, Qing Wang3, Catherine Bonaïti-Pellié1,2
1 INSERM, U535, Villejuif, F-94817, France ; 2 Univ Paris-Sud, IFR 69, UMR-S535,
Villejuif, F-94817, France 3 Centre Léon Bérard, Lyon, France
Running title: GRL and cancer risk in HNPCC
Correspondence to:
Dr. Catherine Bonaïti-Pellié, INSERM U535 (Genetic epidemiology and structure of human
populations), BP 1000, 94817 Villejuif Cedex, France. Tel 33(0)1 45 59 53 49. Fax 33 (0)1
45 59 53 31. Email [email protected]
Key-words: Ascertainment, penetrance, pedigree analysis, HNPCC, genetic counselling
* Present address : IntegraGen SA, 4 rue Pierre Fontaine, 91058 Evry Cedex, France
HAL author manuscript inserm-00150114, version 1
HAL author manuscript
European Journal of Human Genetics 02/05/2007; epub ahead of print
HAL author manuscript inserm-00150114, version 1
HAL author manuscript
Abstract
Hereditary non-polyposis colorectal cancer (HNPCC) is an autosomal dominant syndrome
caused by germline mutations of the mismatch repair (MMR) genes. Only a few studies have
taken into account the selection of families tested for these mutations in estimating colorectal
cancer (CRC) risk in carriers. They found much lower estimates of CRC risks than previous
ones, but these estimates lacked precision despite the large number of families.
The aim of this study was to evaluate the efficiency of the “genotype restricted likelihood”
(GRL) method which provides unbiased estimates of risks whatever the ascertainment process
of families, and to estimate CRC and endometrial cancer risk for carriers of the MMR genes.
Efficiency of the GRL method was evaluated using simulations. Risks were estimated from a
sample of 36 families diagnosed with hereditary HNPCC and carrying a mutation of MSH2 or
MLH1, ascertained through a cancer family clinic in Lyon (France)
The efficiency of the GRL method was found to be strongly dependent on the proportion of
family members tested. By age 70 years, CRC risk was estimated at 47% (95% confidence
interval: 12%-98%) for men and 33% (95% confidence interval: 24%-54%) for women. The
endometrial cancer risk was only 14% (confidence interval: 6%-20%). As methods allowing
for the selection of families lack efficiency, large scale family studies should be undertaken
and data should be pooled in order to provide reliable and precise estimates of risks for an
optimal familial management.
Introduction
HNPCC is an autosomal dominant syndrome that predisposes carriers to colorectal and
endometrial cancer and cancers of other organs1. Mutations of the MMR genes (essentially
MLH1, MSH2 and MSH6) have been shown to be responsible for a majority of families with
this syndrome. Mutations are usually identified in families that fulfil the so-called Amsterdam
criteria2,3. These criteria include having three close relatives with an HNPCC-associated
cancer (of the colon, rectum, endometrium, small bowel, ureter or renal pelvis). If a mutation
is identified in one family member (index case), genetic testing is offered to relatives. If they
are found to be carriers, they may undergo intensive surveillance, which considerably
improves the prognosis of the disease.
Most studies estimate the risk of colorectal cancer in families with HNPCC syndrome
selected according to Amsterdam criteria without correcting for selection bias4-9. Estimates in
these studies range from 0.68 to 0.82, but these values have been shown to be substantially
overestimated10. Only a few studies have taken the ascertainment process into account11-13,
and their estimates are lower than those of the other studies. Penetrance values for
endometrial cancer range from 0.4 to 0.6 4,6,8,11. Because the criteria used to select families did
not include this tumour, these values should be unbiased.
We proposed an ascertainment-adjusted method for estimating the age-specific
cumulative risk (penetrance) of a given disease associated with deleterious mutations in
families in which these mutations have been identified14. This likelihood, called the
"genotype-restricted likelihood" (GRL), provides unbiased penetrance estimates, regardless of
the criteria used to select the families and without modelling the ascertainment process. It also
corrects for the bias that is introduced by selection according to genotype and which is
inherent in this selection since genotypes are available in relatives only if a mutation is
detected in the index case.
In the most recent study of Quehenberger et al.13, endometrial and colorectal cancer
risks were estimated for carriers of the MLH1 and MSH2 gene by using a maximum
likelihood method that corrected for ascertainment by conditioning on all observed
phenotypes, as in the GRL method. They confirmed that previous estimates of colorectal
cancer risks were largely overestimated, as colorectal cancer risks by age 70 years were
26.7% for men and 22.4% for women. Despite the large number of families (84), the
confidence intervals were quite large, suggesting a lack of efficiency of the method. Indeed,
the retrospective likelihoods based on modelling genotypes as a function of given phenotypes
are affected by a lack of efficiency15. This issue might be particularly crucial in case of
missing genotypes, i.e. the most usual situation. Using such methods, another question is
whether or not to include parts of the pedigree in which the phenotypes of relatives are known
but their genotypes are not available.
In this paper, we studied the efficiency of the GRL method according to the proportion
of relatives tested in the families and to the amount of family information available for the
analysis. We also evaluated this method in a sample of 36 families diagnosed with HNPCC.
Methods
Genotype restricted likelihood
The GRL is a function of observed genotypes (Gen), given observed phenotypes
(Phen), and ascertainment (Asc) of families. It can be written
P(Gen/Phen,Asc) = ) P(Asc/Phen ) P(Gen/Phen Phen) P(Asc/Gen,
Let g denote the genotype of non-carriers of the mutated allele and G that of carriers,
Geni the genotype of individual i, P(Geni) the corresponding probability, and P(Pheni/Geni)
the probability of individual i phenotype given his/her genotype. Thus, the contribution of a
given family f with s members can be written as (see Carayol and Bonaïti-Pellié14 for a complete demonstration): { } { } ) C Ω w j l,m,n s 1 i Γ v j l,m,n s 1 i
∑
∏
∏
∏
∑
∏
∏
∏
∈ = ∈ = = ) Gen , /Gen P(Gen ) P(Gen /Gen P(Phen ) Gen , /Gen P(Gen ) P(Gen ) /Gen P(Phen Phen) P(Gen/Asc, w n, w m, w l, w j, w i, i v n, v m, v l, v j, v i, iwhere Γ corresponds to the set of genotypic configurations compatible with the genotypes of the individuals tested, ΩC, to the set of genotypic configurations compatible with the selection
criteria (i. e., the index case carries the mutation), and Geni,v and Geni,w, to the genotypes of
individual i in genotypic configuration v and w respectively. The product on j is taken over all
individuals whose parents' status is unknown (grand-parents and spouses) and the product on
{l,m,n} over all parent-offspring triplets.
For an individual i with genotype Geni, P(Geni) is expressed as a function of the
frequency of the mutated allele in the general population for a founder, assuming
Hardy-Weinberg proportions. Otherwise, this probability depends on parental genotypes, assuming
Mendelian transmission.
Finally, let FGeni(t) be the penetrance function at age t (cumulative risk by age t). If
individual i is unaffected at age ti, the contribution of i to the likelihood is:
P(Pheni/Geni) = 1- FGeni(ti)
that is, the probability that individual i is still unaffected at age ti (survival probability).
If individual i is affected at age ti, the contribution of i to the likelihood is:
P(Pheni/Geni) = FGeni (ti+1) – FGeni (ti)
that is, the probability of being affected at age ti included in the one-year interval [ti ;ti+1[.
For the age-dependent penetrance function according to Geni, we chose a Weibull
model with parameters λGeni (scale parameter) and aGeni (shape parameter). This model is
widely used in parametric survival analysis because of its ability to adjust to observed data.
To take into account the possibility that some carriers will never develop the disease, we
introduced a third parameter, κGeni, corresponding to the fraction of individuals who will never be affected16,17. Finally, the penetrance function may be written:
))
aGeni Geni Geni exp( λ t
F =(1-κGeni ) .(1− − (6)
Simulation of family data
We used simulations to study the efficiency of the GRL in cases where some family
members had unknown genotypes. As in a previous paper14, samples of three-generation
families with at least two affected members were simulated, with various penetrance values.
The simulated pedigrees had a fixed structure: a couple of ancestors with four offspring and
their spouses, each with four offspring. We simulated the genotypes of family members
according to Mendel's laws for subjects whose parents were in the pedigree, ignoring the
possibility of de novo mutation and according to the frequency of the mutated allele for
founders. To obtain samples of sufficient size with at least one carrier individual (the index
case), without simulating too many families, this frequency was set at 0.10. Phenotypes were
simulated according to the age-dependent penetrance function, with the Weibull model. For
non-carriers (Gen=g), the parameter κg was set at 0 and parameters λg and ag at values
corresponding to a cumulative risk of 0.02 by age 80. For carriers (Gen=G), we considered
two different risk values, the first one corresponding to a cumulative risk of 0.2 (called "low
true penetrance") by age 80 and the second one to 0.5 (called "high true penetrance") by the
same age. We did not consider any gender differences in risks.
The families were selected if at least two members were affected. To keep sample
fluctuations to a minimum, sample size was fixed to 10,000 families after selection.
The loss (or gain) of efficiency was investigated by computing asymptotic relative
efficiencies (ARE) of penetrance estimates, i.e. the inverse of the ratio of the variance
estimate in a given situation to the variance obtained in a reference situation. To evaluate the
variance of the penetrance, we simulated, in each situation, 1000 replicates of the family
sample and computed the variance of the estimate by age 70.
The efficiency of the GRL according to the proportion of genotyped individuals in
families was studied by comparing the variance of the cumulative hazard functions calculated
with varying proportions of genotyped individuals (25%, 50%, and 75%) to the variance
computed when all genotypes are known. We also considered the most extreme situation,
where only two genotypes are known (the index case and one relative). Note that if only the
index case is genotyped, Γ and Ωc are identical, and the likelihood is a constant.
To study the information provided by family branches with no genotypic data, we
selected families in which the index case’s nuclear family included an affected relative tested
for the mutation, and members of the secondary nuclear families of the third generation were
not tested. We then compared the variance of the cumulative hazard function in four different
situations, according to whether the sample included for each family (figure 1): 1) only the
ancestors and members of the index case's nuclear family (pedigree A), 2) pedigree A +
members of secondary nuclear families with at least one affected (i.e. family types B and C),
3) pedigree A + members of secondary nuclear families with at least two affected (family type
C), and 4) all family members.
Parameters of the penetrance function were estimated by maximizing the likelihood of
simulated samples. We wrote a program that includes the maximization procedure GEMINI
as a subroutine18 and provides maximum likelihood estimates of the parameters λGand a G for carriers. Since κG was set at 0 in the simulation process, we did not estimate this parameter. We assumed that the penetrance was known for non-carriers and the three
parameters were set at the same values as in the family simulation process.
HNPCC families
The index cases investigated in this study are patients referred by their physicians or
self-referred for genetic counselling at the Centre Leon Bérard in Lyon (France) from January
1994 to January 2004. MMR testing was offered when they fulfilled the Amsterdam criteria I,
which include only colorectal tumours2, or II, which include extracolonic tumours associated
with the syndrome3, or even less stringent criteria, when one of the classic criteria was
missing. All the individuals included in this study signed an informed consent for genetic
testing. As this study did not involve any additional intervention, it was exempt under French
law from ethical review board approval. Blood samples were subjected to germline mutation
screening of MLH1 (NM_000249 for cDNA and NC_000003 for genomic DNA) and MSH2
(NM_000251 for cDNA and NC_000002 for genomic DNA) genes using genomic DNA
sequencing19. Of the 161 index cases meeting one of the selection criteria, 42 were found to
carry a deleterious mutation of MLH1 or MSH2. Five families were not informative because
none of the index case's relatives underwent mutation testing, and were therefore excluded.
Another family was excluded because numerous consanguineous loops made the program
unfeasible. Among the 36 mutated informative families, 22 index cases (61.1%) carried a
mutation of MLH1 and 14 (38.9%) a mutation of MSH2. Genetic testing identified 129
mutation carriers (51 men and 78 women) and 59 non-carriers. Clinical information was
available for 1185 family members (577 men and 608 women), 216 of whom were affected
by colorectal cancer (97 men and 94 women). Age at diagnosis ranged from 20 to 89 years in
men (mean: 44 years) and 18 to 82 years in women (mean: 45 years). Endometrial cancer was
reported in 30 women. The youngest woman was diagnosed at age 32 years and the oldest one
at age 88. Other tumours associated with the syndrome were observed (of the ovary, urinary
tract, stomach and small intestine), but there were too few cases to allow estimation of
penetrance. The cancer diagnosis was confirmed by medical and pathological reports in the
great majority of affected relatives (85%).
The GRL method was used to estimate the parameters of the penetrance function. For
each family member, the age t was taken as the age at last news or age of death if unaffected
and the age at first diagnosis of colorectal cancer or endometrial cancer if affected. We
assumed a frequency of 10-3 for the mutated allele and a de novo mutation frequency of 10-5,
after verifying that estimates of penetrance were not sensitive to errors in these values.
Parameters for non-carriers were fixed at values that fit their incidence in the French
population20. Maximum likelihood was used to estimate the three parameters of the
penetrance function:λG, a and G κG. Analyses were conducted separately for men and women.
Confidence intervals were calculated with the bootstrap method. One thousand samples
were constructed by re–sampling the 36 HNPCC families, and the penetrance function was
estimated for each new sample. We used the 2.5 and 97.5 percentiles of the distribution of
estimated penetrance at different ages to determine the corresponding lower and upper bounds
of the confidence interval of the risk for each cancer.
Results
Efficiency
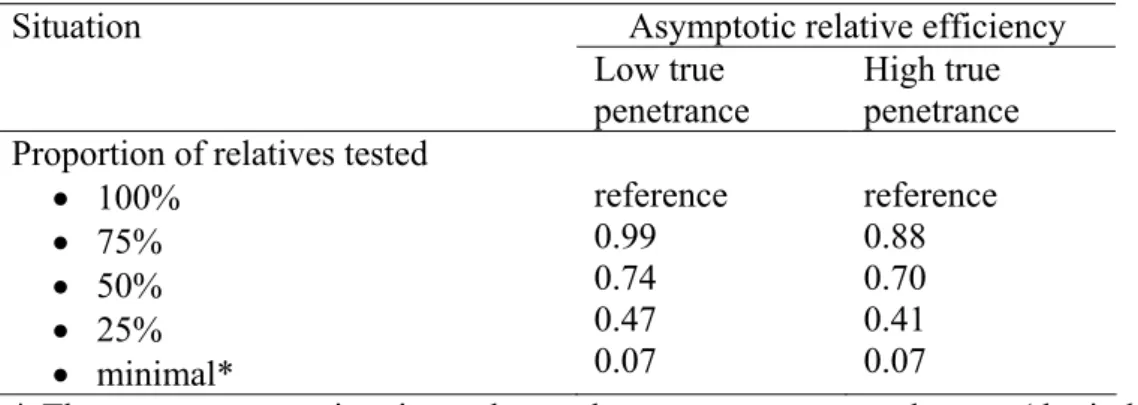
As shown in table 1, efficiency decreased with the percentage of relatives tested,
whatever the penetrance value. This reduction was particularly marked when only one family
member besides the index case was tested in which case efficiency fell to 7%.
Whatever the penetrance value, the information provided by family branches without
genotypic data did not increase efficiency of penetrance estimate with an asymptotic relative
efficiency of about 1.00 in all cases. This clearly indicates that the inclusion of family
branches in the analysis provides no significant information when genotypes are not available.
We could check that, whatever the proportion of missing genotypes and the family
branches included in the analysis, penetrance estimates using the GRL were unbiased.
Estimation of cancer risk in HNPCC
Figure 2 summarizes the penetrance functions of colorectal cancer estimated with the
GRL from the 36 HNPCC families. Penetrance was negligible before 30 years. Although
some cases of colorectal cancer were diagnosed before this age, most were index cases, which
do not contribute to the likelihood. Penetrance was found to be higher in men than in women,
with estimates of 0.47 and 0.34, respectively, at 70 years. Confidence intervals were rather
large: (0.12 – 0.98) for men and (0.24 – 0.54) for women.
Estimated penetrance for endometrial cancer was very low before 40 years, since only 3
women developed this tumour at an earlier age, 2 of them being index cases (Figure 3). The
cumulative risk at 70 years was estimated to be 0.14, with a confidence interval of (0.06 -
0.20).
Discussion
The results reported here show that efficiency may be problematic when only a few
individuals are tested. The proportion of relatives undergoing genetic testing in families with
such a genetic mutation and associated disease appears quite low, despite the benefits of
molecular screening and endoscopic surveillance. For example, in 32 Italian families with
germline mutations of MSH2, MLH1 or MSH6, only 34% of the first-degree relatives of
affected individuals underwent genetic testing21. In the present study, only 24% of the 292
first-degree relatives of the 36 index cases were tested. This proportion may increase in the
future, as families come to better understand the benefits of genetic testing.
We applied the GRL to estimate the risks of colorectal and endometrial cancer in
families with HNPCC syndrome selected by familial criteria and identification of a MSH2 or
MLH1 gene mutation. Lifetime penetrance of colorectal cancer was estimated at 47% for men
and 33% for women. These risks were considerably lower than the first estimates reported in
the literature, and were consistent with the values determined by studies taking into account
the ascertainment bias11-13. Dunlop et al.11 selected subjects as a function of age at diagnosis
of the index case (at or below 35 years of age) and presence of MSI (microsatellite instability)
in the patient’s tumour; MSI is characteristic of tumours due to MMR mutations, that is,
independent of family history. They obtained risk estimates of 52% for CRC, and 42 % for
uterine cancer by the age of 70 years. Parc et al.12 analysed data from families of patients
referred to a cancer family clinic and satisfying at least one of the modified Amsterdam
criteria3. To avoid ascertainment bias, they used a statistic based on the proportion of carriers
among unaffected individuals, which allowed an estimation of the overall cancer risk (but not
separate estimations for specific types). They obtained risk estimates of 43% by age 38 and
62% by age 51. Neither study provided confidence intervals but these intervals were probably
large due to the small number of families (6) in the first study and the relatively young ages of
unaffected individuals tested for the mutation in the second one. Quehenberger et al.13 used a
method based on the same principles as ours in that they conditioned the likelihood of the
observed genotypes on the observed phenotypes and on the event that at least one cancer
patient was a mutation carrier. We could expect that our estimates would be very close to
theirs. Indeed, there was only a slight difference in that we found a higher risk of CRC and a
smaller risk of endometrial cancer. However, because of the large confidence intervals in the
two studies and of the absence of difference found by Quehenberger et al. 13, the penetrance
values were not estimated separately for MLH1 and MSH2. Our results, combined to those of
the three studies described above, confirm that most studies have overestimated the risks of
colorectal cancer in HNPCC syndrome. Regarding the risk of endometrial cancer, we found a
much lower estimate than previous studies but our results were not strongly different from
those of Quehenberger et al.13 who found a risk of 31.5% (confidence interval: 11.1% -
70.3%). In our study, the upper bound of the confidence interval was 20%, which enables us
to conclude that previous studies might have overestimated this risk, probably because
endometrial cancer, although not “officially” included in the recommended criteria, has been
known to be associated with the syndrome for a long time, and this factor might have played a
role in referring patients from physicians to oncogeneticists.
A considerable advantage of the GRL, as well as other retrospective methods, is that it
is valid regardless of the inclusion criteria. It can thus be applied to samples of families
selected according to different criteria. This property should be used in the future to pool large
amounts of data of HNPCC families from different studies, in order to obtain reliable and
precise estimates of risks. This would also permit to estimate the risk of other
HNPCC-associated cancers, scarcely known at present, and help organising the management of
families and the surveillance of carrier relatives. Such a study is presently on-going in France.
It aims at collecting data from all the families tested for MLH1, MSH2 and MSH6 mutations.
It will also allow to detect a possible genetic heterogeneity among families according to the
mutation involved, and to test for the role of other familial factors, either genetic or not, that
could influence cancer risk in carriers.
Currently, carriers of MMR mutations in HNPCC families frequently undergo early
colonoscopic screening at the age of 20 or 25 years. This should be considered when defining
uninformative censoring events for unaffected relatives. Observation time was censored at age
of first colonoscopy in the study by Quehenberger et al.13 and at current age in the present
one. These procedures could lead, in the first case, to shorter observation times for most
individuals and, in the second case, to overlooking removal of pre-cancerous lesions such as
polyps. However, the clinical events observed during colorectal surveillance should be taken
into account. The age at first diagnosis of an adenomatous polyp or the age at last
colonoscopy in the absence of polyp detection should be more appropriate censoring times as
more complete surveillance information is used to define the observation times. This could
increase the power of the studies and the accuracy of the estimations of cancer risks.
Acknowledgements
We acknowledge with gratitude the support of the Fondation de France and the Ligue
Nationale Contre le Cancer through Jérôme Carayol’s fellowship and the support of the Ligue
Contre le Cancer du Rhône et de l’Ardèche for the management of the HNPCC families
database. We thank Catherine Huber for helpful advice and Marie Dominique Reynaud for
editing the manuscript.
There are no competing interests.
References
1. Lynch HT, de la Chapelle A: Genetic susceptibility to non-polyposis colorectal cancer. J
Med Genet 1999: 36: 801-818.
2. Vasen HF, Mecklin JP, Khan PM, Lynch HT: The International Collaborative Group on
Hereditary Non-Polyposis Colorectal Cancer ICG-HNPCC). Dis Colon Rectum 1991; 34:
424-425.
3. Vasen HF, Watson P, Mecklin JP, Lynch HT: New clinical criteria for hereditary
nonpolyposis colorectal cancer (HNPCC, Lynch syndrome) proposed by the International
Collaborative Group on HNPCC. Gastroenterology 1999; 116: 1453-1456.
4. Aarnio M, Mecklin JP, Aaltonen LA, Nyström-Lahti M, Järvinen HJ: Life-time risk of
different cancers in hereditary non-polyposis colorectal cancer (HNPCC) syndrome. Int J
Cancer (Pred Oncol) 1995; 64: 430-433.
5. Voskuil DW, Vasen HF, Kampman E, Van't Veer P and the National Collaborative Group
on HNPCC: Colorectal cancer risk in HNPCC families: development during lifetime and
in successive generations. Int J Cancer 1997; 72: 205-209.
6. Vasen HFA., Wijnen JT, Menko FH, et al: Cancer risk in families with hereditary
nonpolyposis colorectal cancer diagnosed by mutation analysis. Gastroentology 1996;
110: 1020-1027.
7. Lin KM, Shashidharan M, Thorson AG, et al: Cumulative incidence of colorectal and
extracolonic cancers in MLH1 and MSH2 mutation carriers of hereditary nonpolyposis
colorectal cancer. J Gastrointest Surg 1979; 2: 67-71.
8. Aarnio M, Sankila R, Pukkala E, et al: Cancer risk in mutation carriers of
DNA-mismatch-repair genes. Int J Cancer 1999; 81: 214-218.
9. Vasen HF, Stormorken A, Menko FH, et al: MSH2 mutation carriers are at higher risk of
cancer than MLH1 mutation carriers: a study of hereditary nonpolyposis colorectal cancer
families. J Clin Oncol 2001; 19: 4074-4080.
10. Carayol J, Khlat M, Maccario J, Bonaïti-Pellié C: Hereditary non-polyposis colorectal
cancer: current risks of colorectal cancer largely overestimated. J Med Genet 2002; 39:
335-339.
11. Dunlop MG, Farrington SM, Carothers AD, et al: Cancer risk associated with germline
DNA mismatch repair gene mutations. Hum Mol Genet 1997; 6: 105-110.
12. Parc Y, Boisson C, Thomas G, Olschwang S: Cancer risk in 348 French MSH2 or MLH1
gene carriers. J Med Genet 2003; 40: 208-213.
13. Quehenberger F, Vasen HFA, van Houwelingen HC: Risk of colorectal and endometrial
cancer for carriers of mutations of the hMLH1 and hMSH2 gene: correction for
ascertainment. J Med Genet 2005; 42: 491-496.
14. Carayol J, Bonaïti-Pellié C: Estimating penetrance from family data using a retrospective
likelihood when ascertainment depends on genotype and age of onset. Genet Epidemiol
2004; 27 :109-117.
15. Kraft P, Thomas DC: Bias and efficiency in family-based gene-characterization studies:
Conditional, Prospective, Retrospective, and joint likelihoods. Am J Hum Genet 2000; 66:
1119-1131.
16. Sposto R: Cure model analysis in cancer: an application to data from the Children's
Cancer Group. Stat in Med 2002; 21: 293-312.
17. Planté-Bordeneuve V, Carayol J, Ferreira A, et al: Genetic study of transthyretin amyloid
neuropathies: carrier risks among French and Portuguese families. J Med Genet 2003; 40:
e120.
18. Lalouel JM: GEMINI – a computer program for optimization of general non linear
functions. Technical report no 14. Salt Lake City: university of Utah, Department of
Medical Biophysics and Computing, 1979.
19. Wang Q, Lasset C, Desseigne F, et al: Prevalence of germline mutations of hMLH1,
hMSH2, hPMS1, hPMS2 and hMSH6 genes in 75 French kindreds with nonpolyposis
colorectal cancer. Hum Genet 1999 ; 105: 79-85.
20. Remontet L, Esteve J, Bouvier AM, et al: Cancer incidence and mortality in France over
the Period 1978-2000. Rev Epidemiol Sante Publique 2003; 51: 3-30.
21. Ponz de Leon M, Benatti P, Di Gregorio C, et al: Genetic testing among high-risk
individuals in families with hereditary nonpolyposis colorectal cancer. Br J Cancer 2004;
90: 882-887.
Table 1. Efficiency of the GRL for estimating penetrance function according to the proportion
of relatives tested for the mutation
Asymptotic relative efficiency Situation
Low true penetrance
High true penetrance Proportion of relatives tested
• 100% • 75% • 50% • 25% • minimal* reference 0.99 0.74 0.47 0.07 reference 0.88 0.70 0.41 0.07
* The most extreme situation, when only two genotypes are known (the index case and one relative)
Legends for figures
Figure 1. Pedigree structure with index case’s ancestors and nuclear family and secondary
nuclear families (index case marked with an arrow)
Figure 2. Penetrance function and confidence intervals at 30, 50 and 70 years of colorectal
cancer risk in MSH2 and MLH1 mutation carriers for men (solid line) and women (dotted
line), estimated from the 36 HNPCC families.
Figure 3. Penetrance function and confidence intervals at 30, 50 and 70 years of endometrial
cancer risk in MSH2 and MLH1 mutation carriers, estimated from the 36 HNPCC families.
Index case's nuclear family with genotype available
for the index case and one affected relative
Secondary nuclear family with one affected relative and no genotype available
Secondary nuclear family with two affected relatives and no genotype available
Figure 1.
A
B
C
Figure 2.
Figure 3.