HAL Id: halshs-02487423
https://halshs.archives-ouvertes.fr/halshs-02487423
Submitted on 29 Nov 2020
HAL is a multi-disciplinary open access archive for the deposit and dissemination of sci-entific research documents, whether they are pub-lished or not. The documents may come from teaching and research institutions in France or abroad, or from public or private research centers.
L’archive ouverte pluridisciplinaire HAL, est destinée au dépôt et à la diffusion de documents scientifiques de niveau recherche, publiés ou non, émanant des établissements d’enseignement et de recherche français ou étrangers, des laboratoires publics ou privés.
Copyright
Topological analysis of a weighted human behaviour
model coupled on a streets and places network in the
context of urban terrorist attack
Damienne Provitolo, René Lozi, Emmanuel Tric
To cite this version:
Damienne Provitolo, René Lozi, Emmanuel Tric. Topological analysis of a weighted human behaviour model coupled on a streets and places network in the context of urban terrorist attack. Pammy Manchanda; René Pierre Lozi; Abul Hasan Siddiqi. Mathematical Modelling, -Optimization, Analytic and Numerical Solutions, Springer, pp.117-146, 2020, Industrial and Applied Mathematics, 978-981-15-0927-8. �10.1007/978-981-15-0928-5_5�. �halshs-02487423�
1 Published in: Mathematical Modelling, Optimization, Analytic and Numerical Solutions (Pammy Manchanda, René Lozi, Abul Hasan Siddiqi, Editors), Springer Series Industrial and
Applied Mathematics, Chapter 5, pp. 117-146, 2020. ISBN 978-981-15-0927-8, doi.org/10.1007/978-981-15-0928-5_5
Exemplaire auteurs - Authors’ personal copy
Chapter 5
Topological analysis of a weighted human behaviour model
coupled on a street and place network in the context of urban
terrorist attacks
D. Provitolo
1, R. Lozi
2and E. Tric
31,3 Université Côte d'Azur, CNRS, Observatoire de la Côte d’Azur, IRD, Géoazur, France 2 Université Côte d'Azur, CNRS, LJAD, France
Abstract
This article introduces a new model of weighted human behaviour in the context of urban terrorist attacks. In this context, one of the major challenges is to improve the protection of the population. In achieve this goal, it is important to better understand and anticipate both individual and collective human behaviour, and the dynamics of the displacements associated with these behaviours. Based on the recently published Panic-Control-Reflex (PCR) model, this new Coupled Weighted PCR model takes into account the role of spatial configurations on behavioural dynamics. It incorporates, via a bottleneck effect, the narrowness and the length of the streets, and thus the pressure and counter pressure of the crowd in dangerous and safe places. The numerical evacuation simulations highlight that, depending on their size, intermediate places or public squares modulate the dynamics and the speed of flow of the crowd as it evacuates to a safe place. This model features a user-friendly graphical representation, which allows planners to accurately decide where to organize host public events in a specific territorial context.
Keywords: human behaviour, panic, terrorism, street and place network, urban context, mathematical modelling, Coupled Weighted PCR model
1 e-mail: provitol@geoazur.unice.fr 2 e-mail: Rene.lozi@univ-cotedazur.fr 3 e-mail: Emmanuel.tric@univ-cotedazur.fr
2
5.1
Introduction
In the context of disasters, and in order to better protect the population, one of the major challenges today is to better understand and anticipate both individual and collective human behaviour, and the dynamics of the displacements associated with these behaviours.
Indeed, the impact of a dangerous phenomenon is particularly determined by the behaviour of the affected population. These reactions allow anyone to ensure their own safety and that of their family.
This is especially true in the case of sudden and unpredictable events, such as terrorist attacks. These events require immediate reactions for self-protection and self-evacuation, before the arrival of emergency response services.
In spite of the long history of terrorism, there is currently no uniform definition of this word, because "depending on the political configuration, this one will be terrorist for some; instead he will be hailed freedom fighters for others" [1]. However, it is possible to identify different forms of terrorist acts, such as attacks, kidnappings, sabotage, bio-terrorism, or cyber-terrorism. Moreover, terrorist acts can be committed at different levels by individuals, groups or states.
In this article, we focus specifically on the new forms of terrorism, such as the attacks perpetrated by sects or groups which are becoming more and more active. These attacks target places frequented by the public (bus and subway stations, airports, hotels, cafes, etc.), in order to spread panic among the population. The sarin gas attack on the Tokyo subway committed by the Aum sect (1995), the bomb attacks in bus and subway stations (Nigeria, 2014; Belgium, 2016), at airports (Brussels airport, 2016; Atatürk airport, 2016) or near the finish line of the Boston Marathon (2013), and acts perpetrated by Islamic organizations (Kashmir, 2019), are a few examples of a very long list of terrorist attacks. All these events triggered mass movements of flight and collective panic.
Moreover, in order to cause as many casualties as possible and to complicate the response of the security forces, terrorists have developed a new modus operandi by conducting simultaneous attacks in urban areas. In this way, for some coordinated attacks, human losses have been massive, yet constrained in time and space. This was the case for September 11, 2001, in New York and near Washington D.C., where a series of four coordinated terrorist attacks claimed by the al-Qaeda terrorist group killed nearly 3,000 victims and injured over six thousand. India also endured terrifying terrorist attacks in November 2008 when an Islamic terrorist organization based abroad carried out a series of 12 coordinated shooting and bombing attacks lasting four days across Mumbai.
This modus operandi also makes it possible to prolong the attacks to maximise media coverage and to increase the feeling of terror and panic, as was seen during the Paris and Saint-Denis (France) terrorist attacks of November 2015.
In response to tightened police controls to reduce bombing attacks, new types of ad hoc weapons are now employed, like lorries or cars simply driven directly through a crowd massed for a cultural event or simply strolling peacefully. These attacks are most often led by
3 "lone wolves", who are difficult to detect beforehand and equally difficult to locate because they are "nested" among civilians. On July 14, 2016, 86 people who attended the Bastille Day fireworks on the "Promenade des Anglais" in Nice, France, were killed; 458 more were wounded. Since this day the frequency of such kinds of terrorist attacks has grown rapidly in western countries: in Berlin, Germany, December 19, 2016; in London, England, March 22, 2017; in Stockholm, Sweden, April 7, 2017; and in Barcelona, Spain, August 16, 2017. It is not only cars that have been used in such attacks, but true weapons like military guns (Las Vegas, USA, October 2, 2017) or simple tools like knives (Marseille, France, October 1, 2017), hammers, etc.
Nowadays, in order to protect inhabitants, authorities have developed diversified risk reduction strategies. These are complementary, with some acting directly on the threat, and others targeting the vulnerability of potential victims. In the field of counter-terrorism, the most widespread strategies aim to fight against the threat. Thus, in order to avoid new attacks, actions aiming to dismantle terrorist networks are carried out by the police and intelligence services. Attention is therefore focused on dangerous groups, but it is difficult to detect and neutralise all terrorist threats, especially those perpetrated by such "lone wolves".
Thus, prevention policies also focus on reducing the vulnerability of the population. It is then a question of hindering the terrorist action itself by deploying security measures as close as possible to the potential targets (festivals, concerts, college, train and metro stations, etc.). In many countries, like in India and France, more law enforcement officers and even the army have been deployed for such measures; however this can be done only for a limited period of time.
More recently, in France, other actions, such as the distribution of leaflets and information documents have been deployed, to increase awareness among the population about the responses that could save lives, for example to: flee where possible, barricade the entrance, hide behind a solid obstacle, turn off the phone, etc. This effort of dissemination of the best practices in the face of an attack is already a step forward but it remains incomplete.
We must also look at the reality of human behaviour (i.e. what people actually do during a terrorist attack). Their reactions simultaneously depend on their own emotions, the culture of risk and the environmental context (a closed environment like an auditorium or theatre, compared to an open geographical environment, such as a public square, place or networks of streets). When such an attack happens, the topography of the area is very important. The dynamics of human reactions and the associated displacements are guided by the space and the alternatives that it offers, especially in terms of evacuation, flight, and accessibility to refuge areas.
Consider, for example, the terrible Jallianwala Bagh massacre, which took place on April 13, 1919 in Amritsar, Punjab, when a crowd of non-violent protesters were fired upon by troops of the British Indian Army.
The Jallianwalla Bagh is a public garden with an area of 28,000 m2, walled on all sides with five entrances (Figs. 5.1 and 5.2). The largest entry point was blocked by a tank and the
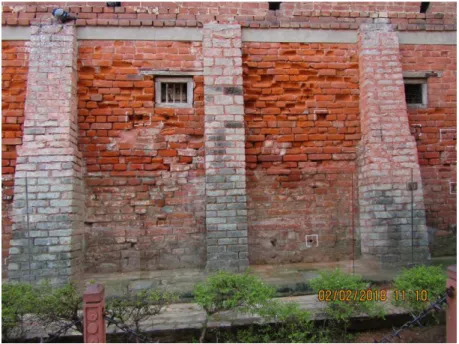
4 main exit was locked. The troops fired on the crowd, directing their bullets largely towards the few open gates through which people were trying to flee (Fig. 5.3).
Fig. 5.1 Spatial configuration of Jallianwalla Bagh (Amritsar, India) © R. Lozi, Feb. 2018
Fig. 5.2 Jallianwana Bagh Memorial (Amritsar, India) © D. Provitolo, Feb. 2018
More recently, two terrorist attacks in Mediterranean cities, in the heart of the historic
town centres of Barcelona (2017; Fig. 5.4) and Nice (2016), have shown that the population
5 esplanades or parks. Spatial configurations can therefore either increase or mitigate the vulnerability of populations.
In an urban context, it is also important to study the impact of the width of alleys and the
shelter capacity of public squares or places so that the population can ensure its own self-evacuation (Fig. 5.4).
Fig. 5.3 Bullet marks can be easily seen on the wall (Amritsar, India) © D. Provitolo, Feb. 2018
6 Of course, it is difficult to artificially reproduce a disaster, which would otherwise allow us to observe the diversity of human reactions that could occur, to follow the spatio-temporal dynamics and to analyse the impact of territorial configurations on these dynamics. To overcome these limits, it is possible to develop mathematical models from which evolution scenarios are simulated by varying parameters or initial conditions. The computer thus becomes the virtual laboratory and the simulation is understood to be an experiment on a model, a digital experience [2].
The Com2SiCa research team1 proposed the Panic-Control-Reflex (PCR) model [3], which is a model that simulates the possible human behaviour that can occur during sudden onset and unpredictable disasters, such as a tsunami, earthquake, or technological disaster. This model is formalized by a system of ordinary differential equations to describe behavioural dynamics over time [4-6].
In this article we propose an extension of the PCR model in order to take into account the influence of spatial configuration in the mathematical modelling of the dynamics of human reactions in the face of traumatic situations, such as terrorist attacks. This dynamic and the associated displacements are indeed guided by the territorial configurations (networks of streets and places) and the alternatives that they offer in terms of evacuation, flight, and accessibility to shelters. We call this extended model the Coupled Weighted PCR (CWPCR).
In Section 5.2, we will present the Panic-Control-Reflex model in its graphical and mathematical formalism, as published by the authors cited above. Then, in Section 5.3, this model will be improved in order to take into account the role of spatial configurations on behavioural dynamics. The CWPCR model incorporates the pressure and counter pressure of the crowd in each place via a bottleneck effect, which is induced by the narrowness and the length of the streets and the size of places. In Section 5.4 we will consider an oriented network with three nodes representing three places or public squares of different sizes, linked by narrow streets. This part is therefore devoted to the analysis of the impact of the parameters (the size of the places, the width of the streets) on the evacuation of the population in the face of a terrorist attack, by means of numerical simulations. The numerical results highlight that, depending on their respective size, intermediate places modulate the dynamics and the speed of flow of the crowd. In this sense, they become strategic places both for the planners who must think about the organization of the area to host public events and festivals, and also for the terrorists who can use these strategic places to multiply the effect of their harmful actions by trapping the flight movements between two areas of action. This model is used with a user-friendly graphical representation, which allows planners to accurately consider where to organize host public events in a specific territorial context. Finally, in Section 5.5, a brief conclusion will be drawn.
1
7
5.2 The PCR system: an a-spatial model for analysing the dynamics of
human behaviour during a disaster
5.2.1. Neuroscientific background of the PCR system
The PCR model [3-6] is a simulation model of the dynamics of collective human behaviour during a disaster (Fig. 5.5). It has been developed from the SIR based-models, which are compartmental models that are widely used in epidemiology [7]. In these models, the population can be decomposed into several subpopulations, each of which corresponds to a compartment. The PCR model focuses on:
i. different human behavioural states, namely daily behaviour before a disaster occurs, as well as reflex, panic and controlled behaviours that are observed during a disaster,
ii. transitional processes from one reaction to another. Indeed, neuroscience research shows that in disaster situations, humans are rarely stuck in one type of behaviour. The population switches between different behavioural states, some of which are the result of instinctive reactions [8], others of reasoned reactions [9].
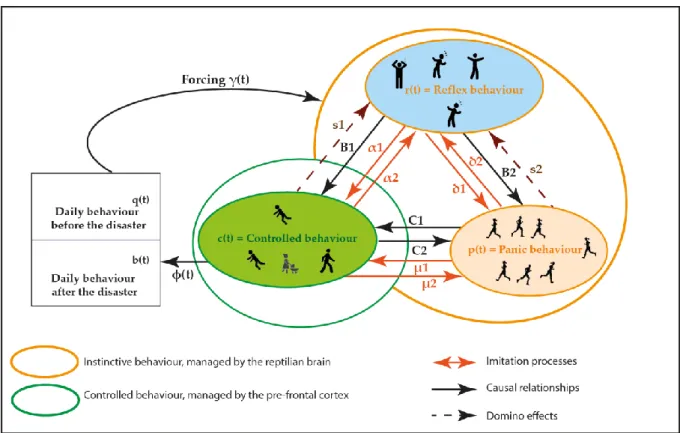
To take these behavioural sequences into account, the PCR model formalizes human reactions as a chain of behaviours that appear in a certain order. It distinguishes q(t), the daily behaviour before, and b(t), after the disaster; r(t) and p(t), the uncontrolled emotional behaviours which are managed by the reptilian zone of the brain; and c(t), the reasoned behaviours that are controlled by the prefrontal cortex [10-12]. This is represented in Fig. 5.5.
As the brain switches from one behavioural state to another, in the context of terrorist acts and therefore in a situation of sudden and unforeseen threat, the whole impacted population first adopts a behavioural reaction, Reflex r(t), under the influence of surprise and the suddenness of the event, before transiting to the Panic reflex behaviour p(t), or Controlled behaviour c(t).
Reflex r(t) and Panic p(t) behaviour are instinctive, automatic reactions, allowing one to react extremely quickly to the threat, either by being stunned and paralysed r(t), or by fleeing as quickly as possible due to the panic fear p(t). In a context of a dense crowd, the context sought by terrorist groups, panic escape behaviour can worsen the vulnerability of the population because of the risk of crushing and suffocation [13].
Controlled behaviour c(t) concerns reasoned and self-control reactions. They can take different forms during a catastrophe, for example, in the form of evacuation, leak, containment, sheltering, search for help, mutual aid or, on the contrary, looting, etc. Despite their diversity, the PCR model aggregates all of these controlled behaviours.
During the event, the switches from one behavioural state to another are caused by transitional dynamics due to:
i. Causal relationships (B1, B2, C1, C2). Once the population is in the reflex
behaviour state, a part of it can evolve towards controlled behaviours at the rate B1, while another part transitions towards panic behaviours at the rate B2.
8 Likewise, a part of the panicked population may switch to controlled behaviour at the rate C1. According to the evolution of the situation, individuals who have
adopted a controlled behaviour may switch back to panic behaviour at the rate C2. This process can be iterated many times.
ii. Processes of imitation and contagion, which are well-known in crowd psychology and have been termed “emotional contagion” [14]. The imitation processes are modelled identically to epidemiological propagation [15]. The imitation is valid in both directions and is modelled by the function F(r,c) Eq.(5.3) for emotional contagion between reflex and controlled behaviour (using the damping coefficients α1 and α2), by the function G(r,p) Eq.(5.4) for
emotional contagion between reflex and panic behaviour (δ1 and δ2), and by
the function H(c,p) Eq.(5.5) for emotional contagion between controlled and panicked behaviour (μ1 and μ2).
iii. Domino effects, which illustrate a succession of events (s1 and s2)
corresponding, for example, to a new attack in urban area or to a closed door during an evacuation. In the PCR model, the parameters s1 and s2 are either
constant or built in a periodic form.
The triggering of the threat is represented by a forcing function (t), the form of which may vary according to the specificities of the danger (event with fast or slow kinetics, expected or not).
Fig. 5.5 Graphical representation of the Panic, Control, Reflex behaviour model (PCR) in the exceptional
9
5.2.2. Equations of the PCR system
In [4-6] the authors introduce the Panic-Control-Reflex model (PCR) by using a system of five Ordinary Differential Equations (ODE), which describe the human behaviours in one specific place during a catastrophic event. We include these ODE Eqs. (5.1)-(5.6) in order to describe the modifications we introduce to them in the next Section, where we seek to model such behaviours when a network of places and streets or stairs linking those places in a town is considered. In Section 5.3 we will identify this network to a mathematical graph, the places are called vertices or nodes, and the streets and stairs are the edges linking those nodes.
( , ) X = t X (5.1) with X dX dt = , 5 ( , , , , )T X = r c p q b R and
given by ( ,t X)= (
i( ,t X))
T, i =1,...,5, where the functions i are defined by1 1 2 1 2 2 1 1 2 1 ( ) ( , ) ( ) ( ) 1 ( ) ( ) ( ) ( ) ( ) ( ) ( ( ), ( )) ( ) ( ) ( ( ), ( )) ( ) ( ) ( , ) ( ) ( )(1 ( )) ( ) ( ) ( ) ( ) ( ) ( ( ), ( )) ( ) ( ) ( ( ), ( )) ( ) ( m r t t X t q t B B r t s t c t s t p t r F r t c t r t c t G r t p t r t p t t X t c t b t B r t C p t C c t s t c t F r t c t r t c t H c t p t c t p = − − + + + + + = − − + + − − − + 3 2 1 2 2 4 5 ) ( , ) ( ) ( ) ( ) ( ) ( ) ( ( ), ( )) ( ) ( ) ( ( ), ( )) ( ) ( ) ( ) ( , ) ( ) ( ) 1 ( , ) ( ) ( )(1 ( )) m t t X B r t C p t C c t s t p t G r t p t r t p t H c t p t c t p t r t t X t q t r t X t c t b t = − + − − − = − − = − (5.2)
and the variables ( ), ( ), ( ), ( ), ( )r t c t p t q t b t denote, respectively, the densities of people being in a reflex, control, panic, daily or back to daily behaviour [6].
The parameters involved in (5.2) are real positive coefficients previously defined in Sec. 5.2.1: r m 0(reflex behaviour maximum value);Bi 0,Ci 0,i=1, 2;
0, 0, 0, 1, 2
i i i i
= ; si 0,i=1, 2.
The imitation functions ,F G and H are real valued functions defined on ℝ× ℝ by
1 1 2 2 ( ) ( ) ( ( ), ( )) ( ) ( ) r t c t F r t c t f f c t r t = − + + + (5.3) 1 1 2 2 ( ) ( ) ( ( ), ( )) ( ) ( ) r t p t G r t p t g g p t r t = − + + + (5.4) 1 1 2 2 ( ) ( ) ( ( ), ( )) ( ) ( ) c t p t H c t p t h h p t c t = − + + , (5.5)
10 where is a positive number and f g hi, i, i for i =1, 2 are real valued functions defined on ℝ. They have a decreasing shape indicating that the behaviour imitation is symmetric. Moreover they are normalized,
0 ≤ 𝑓𝑖(𝑢) ≤ 1, 0 ≤ 𝑔𝑖(𝑢) ≤ 1, 0 ≤ ℎ𝑖(𝑢) ≤ 1, ∀𝑢 ∈ ℝ, 𝑖 = 1,2 (5.6) Because this model does not take the mortality rate into account, the population remains constant and, in one node, can be normalized to 1. Therefore Eq. (5.1) is considered when time is proceeding from an initial time t 0 0, with initial condition
0 0 0 0 0 0 0 0 0 0
( ( ), ( ), ( ), ( ), ( ))r t c t p t q t b t =( ,r c ,p q b, , ) (5.7) that satisfies the following properties
0 0 0 0 0 ( ) 0, ( ) 0, ( ) 0, ( ) 0, ( ) 0 r t c t p t q t b t (5.8) 0 0 0 0 0 ( ) ( ) ( ) ( ) ( ) 1 r t +c t + p t +q t +b t = (5.9)
Equation (5.9) remains true throughout the process because the sum of the five equations (5.2) is null, therefore
0 ( ) 1 ( ( ) ( ) ( ) ( )),
b t = − r t +c t + p t +q t t t (5.10) which implies that Eq. (5.2) can be reduced to the system of only four ODE
1 2 1 2 1 1 2 1 ( ) ( ) ( ) ( ) 1 ( ) ( ) ( ) ( ) ( ) ( ) ( ( ), ( )) ( ) ( ) ( ( ), ( )) ( ) ( ) ( ) ( ) ( )(1 ( )) ( ) ( ) ( ) ( ) ( ) ( ( ), ( )) ( ) ( ) ( ( ), ( )) ( ) ( ) m r t r t t q t B B r t s t c t s t p t r F r t c t r t c t G r t p t r t p t c t t c t b t B r t C p t C c t s t c t F r t c t r t c t H c t p t c t p t p = − − + + + + + = − − + + − − − + 2 1 2 2 ( ) ( ) ( ) ( ) ( ) ( ) ( ( ), ( )) ( ) ( ) ( ( ), ( )) ( ) ( ) ( ) ( ) ( ) ( ) 1 m t B r t C p t C c t s t p t G r t p t r t p t H c t p t c t p t r t q t t q t r = − + − − − = − − (5.11)
The initial condition of Eq.(5.11) corresponding to ( ,r c0 0,p q b0, 0, 0)for Eq. (5.2) becomes
simply
0 0 0 0
( ,r c ,p q, ) (5.12)
5.2.3. Transitional dynamics
Both forcing functions,
and
, respectively model the beginning of the disaster and the return to a quiescent daily behaviour. Their shape can be adapted to various scenarios. Whent
is sufficiently large they satisfy ( ) t =( ) 1t = . In catastrophic situations it is considered that
is a stiff function, ranging from 0 to 1 in a very brief interval of time [4-6] because if we consider a bomb attack, all the crowd that is near the explosion passes from daily to reflex behaviour in an instant, and it takes a very long time for people to return to their normal state.11 Therefore, one can suppose that a terror attack is shaped by two characteristic times: ts (for start) and te (for end) with t0 ts tefor which
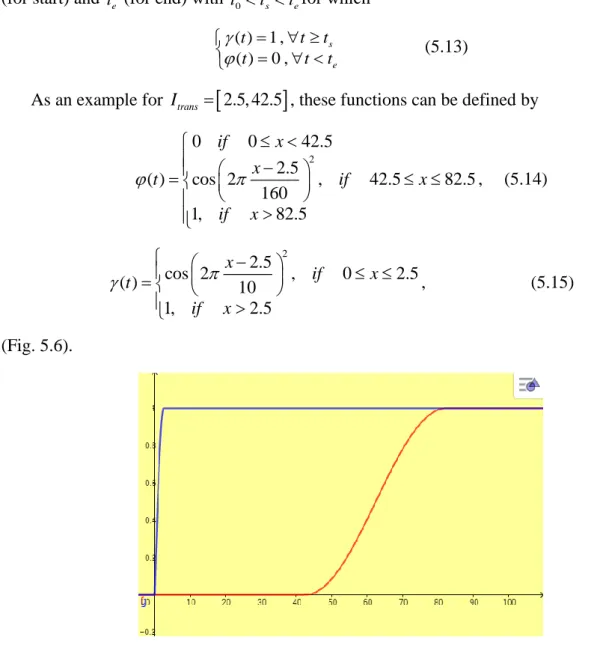
( ) 1 , ( ) 0 , s e t t t t t t = = (5.13)
As an example for Itrans =
2.5, 42.5
, these functions can be defined by2 0 0 42.5 2.5 ( ) cos 2 , 42.5 82.5 160 1, 82.5 if x x t if x if x − = , (5.14) 2 2.5 cos 2 , 0 2.5 ( ) 10 1, 2.5 x if x t if x − = , (5.15) (Fig. 5.6).
Fig. 5.6 Forcing functions( )t , blue curve, and ( )t , red curve, Itrans =
2.5, 42.5
Following [6] we keep the term transitional dynamics for the dynamics of the PCR model (likewise for both improved WPCR and CWPCR models presented Section 5.3) in the interval of time Itrans =
t ts, e
(in terror attacks this interval of time can last from several minutes up to hours as observed during the 2016 terrorist attack in Nice). Therefore intrans t I
functions
and
verify
( ) 1 ( ) 0 t t == (5.16)Hence, during the transitional dynamics, the population with daily behaviour collapses and there is not yet a population that is back to daily behaviour (i.e. ( )q t =b t( )= ). 0
12 1 2 1 2 1 1 2 1 2 1 2 2 ( ) ( ) ( ) ( ) ( ) ( ) ( ) ( ( ), ( )) ( ) ( ) ( ( ), ( )) ( ) ( ) ( ) ( ) ( ) ( ) ( ) ( ) ( ( ), ( )) ( ) ( ) ( ( ), ( )) ( ) ( ) ( ) ( ) ( ) ( ) ( ) ( ) ( ( r t B B r t s t c t s t p t F r t c t r t c t G r t p t r t p t c t B r t C p t C c t s t c t F r t c t r t c t H c t p t c t p t p t B r t C p t C c t s t p t G r t = − + + + + + = + − − − + = − + − − ), ( )) ( ) ( )p t r t p t H c t p t c t p t( ( ), ( )) ( ) ( ) . − (5.17)
5.3. Mathematical Weighted and Coupled PCR system
5.3.1. The Weighted PCR system
Equations (1-4) model the human behaviours, in one specific place, during a catastrophic event. As explained in the first part of this article, it is based on neuroscience studies.
However just before a dramatic event like a terror attack in a city, the crowd is generally spread across several places, public squares and streets. In the aftermath of the initial shock, people are rushing through the streets to reach what they think will be more secure places (Fig. 5.7).
Fig. 5.7 Possible paths of rushing people in a city network.
In this article, we define the city by a mathematical graph, where the places and public squares are called vertices or nodes and are denoted N1,N2, ,Np, and the streets,
escalators, doors, and stairs are the oriented edges (Ni →Nj) linking these nodes. They are
oriented, because the flow from one place toward another is not symmetric. Our aim is to model the motion of the crowd through such edges. To achieve this, we must to introduce some “geographical” particularities of the city, like the size of places, the narrowness of streets, and the number of people initially present in each place. This is why we need to
3
2
1
13 upgrade the standard PCR model, into the Weighted PCR (WPCR) model, by introducing new data, with Weight standing for the relative sizes of crowd, places and streets.
Firstly, on each node Nk, k =1,p we call r tk( ),c tk( ), p tk( ),q tk( ),b tk( ) the number of people being in reflex, control, panic, daily and back to daily behaviour and V tk( )the total number of people present at this node
( ) ( ) ( ) ( ) ( ) ( )
k k k k k k
V t =r t +c t +p t +q t +b t (5.18)
Since we consider that the nodes are not identical (as is seen in an actual city) they do not generally contain, at each moment, the same number of people. Moreover, this number is varying with time when the crowd is moving through the streets. That is why it is more convenient to consider that the five variables of the WPCR model represent actual numbers of people, rather than densities, as in PCR model. Densities can be used only when there is no motion at all between places, and the population in each place, is the same. Of course, this number of people can be transformed locally to density whenever it is necessary.
Secondly, in order to more precisely model the characteristics of the city, we introduce k
W , the maximum capacity of the number of people who can be present in each node Nk (i.e. due to the size of the corresponding place). Each maximum capacity is a constant. At every time one must have
( )
k k
V t W (5.19)
The Weighted Panic-Control-Reflex model (WPCR) is then defined on each node k by
( , ) k k X = t X (5.20) with k k dX X dt = , 5 ( , , , , )T k k k k k k X = r c p q b R and
given by ( ,t Xk)= (
i( ,t Xk))
T, 1, ..., 5i = , where the functions i are defined by
(
)
1 1 2 1 2 2 1 1 2 1 ( , ) ( ) ( ) ( ) ( ) ( ) ( ) ( ) ( ) ( ) ( ) ( ( ), ( )) ( ) ( ) ( ( ), ( )) ( ) ( ) ( , ) ( ) ( ) ( )( ( )) ( ) ( ) ( ) ( ) ( ) ( ( ), k k k k k k k k k k k k k k k k k k k k k k k k k k k t X r t t q t W r t B B r t s t c t s t p t F r t c t r t c t G r t p t r t p t t X c t t c t W b t B r t C p t C c t s t c t F r t c = = − − + + + + + = = − − + + − − −(
)
3 2 1 2 2 4 5 ( )) ( ) ( ) ( ( ), ( )) ( ) ( ) ( , ) ( ) ( ) ( ) ( ) ( ) ( ) ( ( ), ( )) ( ) ( ) ( ( ), ( )) ( ) ( ) ( , ) ( ) ( ) ( ) ( ) ( , ) ( ) ( ) ( )( k k k k k k k k k k k k k k k k k k k k k k k k k k k k t r t c t H c t p t c t p t t X p t B r t C p t C c t s t p t G r t p t r t p t H c t p t c t p t t X q t t q t W r t t X b t t c t W + = = − + − − − = = − − = = k b tk( )) − (5.21)the initial condition satisfies
0 0 0 0 0 0 ,0 ,0 ,0 ,0 ,0 ,0
( ) ( ) ( ) ( ) ( ) ( )
k k k k k k k k k k k k k
r t +c t +p t +q t +b t =V t =r +c +p +q +b =V W (5.22) We suppose that the characteristic parameters B B C C1, 2, 1, 2,of each node have the same
value, because they depend on cultural and psychological factors specific to each individual rather than to spatial configurations and crowd context. Thus, all the parameters and the
14 functions are the same as those defined in Sect. 5.2.2., which is why we use function i instead of function k i, .
5.3.2. Flows and bottleneck coupling
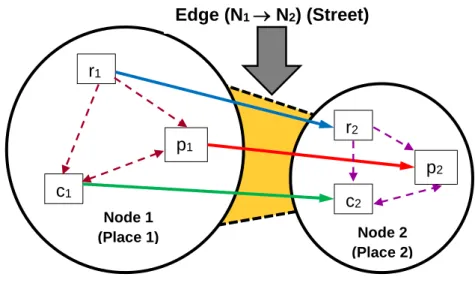
As previously defined, nodes are linked by edges. We now aim to model the motion of the crowd through such edges (i.e. streets, stairs, escalators, doors, etc.). For the sake of simplicity, we present the coupling on a simplified oriented network with only two nodes
1 1
(N W; ) and (N W2; 2), and one edge (N1→N2). We suppose that during the short interval
of time when people are travelling inside one edge, they remain in the same behavioural class (Fig. 5.8.). In this figure, the “geographical” edge (N1→N2) (i.e. the street linking node 1 to
node 2) is split in three “behavioural edges” meaning that on the same street people in reflex, panic or controlled behaviour are escaping from node 1 to node 2, therefore people in each particular behaviour in node 1 are meeting people in the same behaviour in node 2.
Fig. 5.8 Two nodes network: people in every state are rushing from node 1 towards node 2, maintaining the
same behavioural class. (This representative colour scheme is used for the remainder of the article.)
To continue focusing on the special coupling that we are introducing here, we suppose that imitation mechanisms are not activated (i.e. FH , which is equivalent to G 0
0
i i i
= = = for i =1, 2), and, furthermore, there is no domino effect (si=0,i=1, 2) and
we also suppose that we are in the interval Itrans =
t ts, e
where only transitional dynamics are considered. Of course, it is easy to relax such limitations, which are not dependent upon the coupling, by not eliminating the corresponding terms in the equations.In each node Nk,k =1, 2 such transitional dynamics are the solution of the system
1 2 1 1 2 2 1 2 2 ( ) ( ) ( ) ( ) ( ) ( ) ( ) ( ) ( ) ( ) ( ) k k k k k k k k k r t B B r t c t B r t C p t C c t p t B r t C p t C c t = − + = + − = − + (5.23) Node 1 (Place 1) r1 p1 c1 p2 c2 r2 Edge (N1 → N2) (Street) Node 2 (Place 2)
15 which is the reduction of system (5.21) in the transition interval (as Eq. (5.17) is the reduction of Eq. (5.2)).
Note: in the WPCR model, the terms r t c tk( ), k( ), p t q t b t can be considered as k( ), k( ), k( ) flows, because a flow is a quantity of something divided by a unit of time. There are two kinds of flow. In Eqs. (5.21)-(5.23) flows are “behavioural”, as they represent the quantities of people changing their behaviour per unit of time. Now we consider also “motion” flows, which are the quantities of people in each behaviour class, moving from one node to another node, per unit of time. Of course, both kinds of flow are combined to produce a global equivalent in the following equations.
In [16] different types of flow situations are considered in pedestrian facilities, such as unidirectional, bidirectional and crossing: it is said that “Unidirectional and bidirectional flow conditions can be commonly observed in corridors, stairs and bottlenecks of pedestrian facilities such as transport terminals, shopping malls, etc. An understanding of the fundamental relationship between flow - speed - density is important in the planning, design and operation of pedestrian facilities. Capturing the realistic behaviour of pedestrians in various pedestrian facilities with different geometric elements such as corridors, bottlenecks, stairs, escalators etc. is essential in order to estimate the flow parameters accurately. The important parameters such as width of the bottleneck slope of the stairs plays a vital role in deciding the capacity of the respective element. The flow density relationship for different geometric elements is important and further analysis like spatial and temporal development of the basic quantities (velocity, density and flow) on different elements like corridors, stairs and bottlenecks should be considered”.
Fig. 5.9 Relationship between flow and density of pedestrians from the literature, from [17, derived from Fruin,
Weidmann, Virkler, Older, Sarkar and Tanariboon]
Many studies on pedestrian flows have been published [17-23]. We consider, in particular, the survey of [17], in which the graphs of six different experiments showing the relationship between the flow of pedestrians and their densities are displayed. All these graphs show clearly a nonlinear relationship of a logistic type between density and flow (Fig. 5.9).
Moreover, Daamen and co-authors developed a first-order traffic flow theory to describe two-dimensional pedestrian flow operations in the case of an oversaturated bottleneck in front
16 of which a large, high-density region has formed (Fig. 5.10). Such a mathematical model also highlights the logistic relationship for any bottleneck width.
Fig. 5.10 Relationship between flow and density of pedestrians going through an oversaturated bottleneck, from
[17]
We now introduce our hypothesis for the coupled WPCR (CWPCR), based on this type of logistic relationship. Again, for the sake of simplicity, we consider only unidirectional motion of the crowd (i.e. motion on an oriented graph) as in Fig. 5.8, because it is supposed that a terrorist attack occurs in node 1 and that people try to escape from this node towards node 2. As an aside, in forthcoming research we will allow bidirectional motion in more complex network, where bidirectional motion will be simply obtained by adding symmetric terms in Eq. (5.24).
When the crowd is moving from one node to another, its speed and the corresponding motion flow depends on three factors. The first factor reflects the narrowness and the length of the street. More people can go from one place to the next if the street is large, rather than in the case of a narrow street. This topological characteristic will be modelled by a “roughness” coefficient 1,2. In fact, in the considered coupling, we suppose that people cannot change their behaviour when they move from one node to another (e.g. controlled people remain controlled, panicked people remain panicked, and so on), and thus we use three such roughness coefficients: c,1,2,p,1,2,r,1,2, to refer to the population in reflex, panic or
controlled situations, respectively. Of course, they can have the same value. The second factor is proportional to the number of people present in the first node. This is equivalent to the pressure of the crowd in the first place. The third factor reflects the counter pressure due to the maximal capacity of the second place conjugated with the number of persons already present there. The combination of pressure and counter pressure gives a bottleneck effect.
17 We propose to model this bottleneck effect by a nonlinearity of a logistic type to keep the same philosophy as the authors cited above.
Thus, the bottleneck coupling corresponding to Fig. 5.8, is given by the system
1 1 2 1 ,1,2 1 2 2 2 2 1 1 1 1 1 2 1 ,1,2 1 2 2 2 2 1 2 1 1 1 2 1 ,1,2 1 2 2 2 2 2 1 2 2 ( ) ( ) ( ) ( )( ( ) ( ) ( )) ( ) ( ) ( ) ( ) ( )( ( ) ( ) ( )) ( ) ( ) ( ) ( ) ( )( ( ) ( ) ( )) ( ) ( ) ( r c p r t B B r t r t W c t p t r t c t B r t C p t C c t c t W c t p t r t p t B r t C p t C c t p t W c t p t r t r t B B r = − + − − − − = + − − − − − = − + − − − − = − + ,1,2 1 2 2 2 2 2 1 2 1 2 2 2 ,1,2 1 2 2 2 2 2 2 2 1 2 2 2 ,1,2 1 2 2 2 2 ) ( )( ( ) ( ) ( )) ( ) ( ) ( ) ( ) ( )( ( ) ( ) ( )) ( ) ( ) ( ) ( ) ( )( ( ) ( ) ( ) ( )) r c p t r t W c t p t r t c t B r t C p t C c t c t W c t p t r t p t B r t C p t C c t p t W t c t p t r t + − − − = + − + − − − = − + + − − − (5.24)
with initial conditions satisfying
1,0 1,0 1,0 1,0 1; 2,0 2,0 2,0 2,0 2
r +c + p =V W r +c + p =V W
In this system the bottleneck coupling, concerning, for example, the controlled population that is moving from node 1 to node 2 is given by the term:
,1,2 1( )( 2 2( ) 2( ) 2( ))
c c t W c t p t r t
− − − (5.25)
in the second equation of (16)
1( ) 1 1( ) 1 1( ) 2 1( ) c,1,2 1( )( 2 2( ) 2( ) 2( ))
c t =B r t +C p t −C c t − c t W −c t −p t −r t (5.26)
In this bottleneck coupling (5.25), c,1,2 is the parameter which models the topological characteristic of the street linking node 1 to node 2. The second factor c t1( )of (5.25) reflects
the pressure of controlled people in node 1 willing to escape towards node 2 and also the proportionality of people escaping with respect to people staying in node 1. Finally, the factor
2 2 2 2
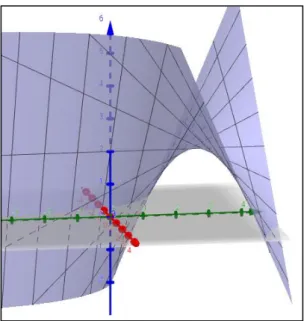
(W −c t( )−p t( )−r t( )) shows the counter-pressure which is maximum (i.e. the term vanishes) when W2 =c t2( )+p t2( )+r t2( ) because, in this case, there is no more room for people coming from node 1. This bottleneck coupling is nonlinear as shown on Fig. 5.11. As we consider only transitional dynamics where q tk( )=b tk( )=0, Eq. (5.25) can be written
,1,2 1( )( 2 2( ))
c c t W V t
18
Fig. 5.11 Graph of the bottleneck coupling function
5.3.3. Fixed points of the two-node system
The fixed-point research allows us to identify the point of equilibrium towards which the system tends during the transitional period. This equilibrium point highlights the primordial role of the size of node 2 in the context of evacuation dynamics. It is important to note that the mathematically calculated equilibrium point does not necessarily correspond to the equilibrium situation sought by crisis management personnel. Thus, the equilibrium point obtained in situation 2 below, in which a part of the population cannot escape and remains in a dangerous place, does not correspond to a crisis equilibrium situation. The population stranded in the initial place (node 1) remains very vulnerable to the terrorist threat.
The fixed point ( * * * * * * 1, 1, 1, 2, 2, 2
r c p r c p ) of the system toward which the solution Eq. (5.24)
19 * 1 * 1 * 1 * 2 1 1,0 2,0 * 2 1 2 2 1,0 2,0 * 2 1 2 * 1 1 1,0 2,0 2 * 1 1 2 2 1,0 2,0 2 * 1 1 2 * 2 * 1 2 2 1 2 * 2 2 2 1 2 0 0 0 0 ( ) ( ) 0 ( ) ( ) 0 r c p r C V V c C C C V V p C C r C V V W c C C C V V W p C C r C W c C C C W p C C = = = = + = + + = + = + − = + + − = + = = + = + 1,0 1,0 1,0 2,0 2,0 2,0 1,0 2,0 2 1,0 1,0 1,0 2,0 2,0 2,0 1,0 2,0 2 if , if , r c p r c p V V W r c p r c p V V W + + + + + = + + + + + + = + (5.28)
The values of this fixed point mean that:
Situation 1: if the number of people initially staying in both nodes is less than the capacity of node 2 (i.e. V1,0+V2,0 W2), after a while, node 1 becomes empty and all the
crowd has sought refuge in node 2.
Alternatively, in Situation 2: if this number is greater than the capacity (i.e.
1,0 2,0 2
V +V W ), then node 2 becomes full and the remaining people W2−(V1,0+V2,0) are still stranded in node 1.
From Eq. (5.28) it is obvious that only the ratio 1 2
C
C is significant for the limit of solutions of Eq. (5.24) because * * 1 2 1 * * 1 2 2 c c C
p = p =C , instead of parameters B1 and B2, becomes important for the pace at which the “reservoir” of people in reflex behaviour is emptied.
Of course, across the world there are different cultures, which lead to different behaviours. These behaviours can be modelled varying parameters.
For example, if populations are not made aware of major risks and not prepare for them, it causes a panic reaction (B1 < B2), this behaviour is then regulated by the ratio 1
2
C
C . The higher this ratio, the more the population remains or transits in the controlled state.
In both simulated situations, we choose a set of parameters that highlight a weak risk culture, while favouring the return to a controlled behaviour: instead, the values,
1 0.2, 2 0.4
20 panic in the crowd context is compensated by controlled reactions for a part of the population who keep self-control, notably because there is no new threat or sudden attack.
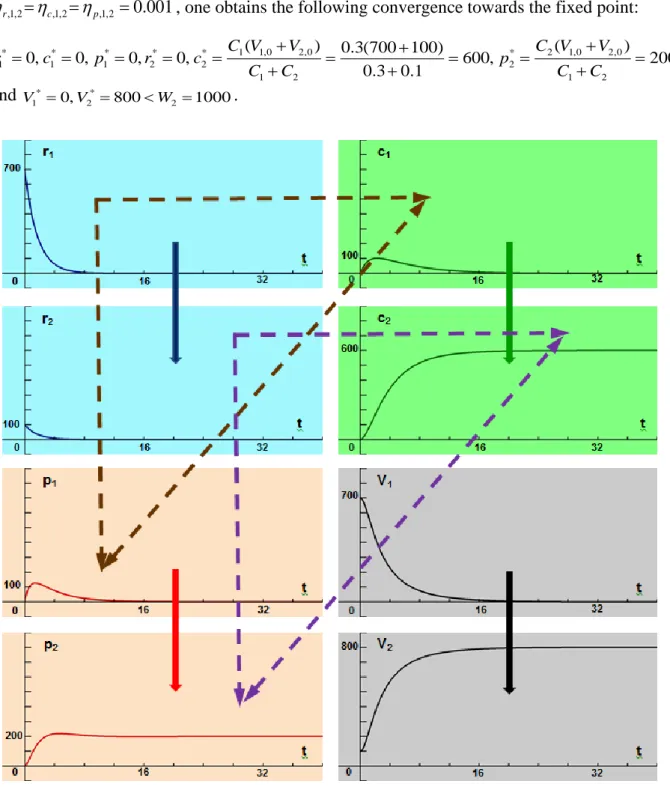
Therefore, in situation 1 (Fig. 5.12) when V1,0 =700,V2,0 =100,W2 =1000 and ,1,2 ,1,2 ,1,2 0.001
r c p
= = = , one obtains the following convergence towards the fixed point:
1 1,0 2,0 2 1,0 2,0 * * * * * * 1 1 1 2 2 2 1 2 1 2 ( ) 0.3(700 100) ( ) 0, 0, 0, 0, 600, 200 0.3 0.1 C V V C V V r c p r c p C C C C + + + = = = = = = = = = + + + and * * 1 0, 2 800 2 1000 V = V = W = .
Fig. 5.12 Situation 1: Convergence towards the fixed point (0, 0, 0, 0, 600, 200). In this figure the change of
behavioural states is symbolized by dotted arrows, and the motion between nodes by plain arrows is as displayed in Fig. 5.8.
In situation 2 (Fig. 5.13) when V1,0 =700,V2,0 =100,W2 =500, one obtains the following
21 1 1,0 2,0 2 2 1,0 2,0 2 * * * 1 1 1 1 2 1 2 ( ) 0.3(700 100 500) ( ) 0, 225, 75, 0.3 0.1 C V V W C V V W r c p C C C C + − + − + − = = = = = = + + + * * 1 2 * 2 2 2 2 2 1 2 1 2 0, C W 375, C W 125 r c p C C C C = = = = = + + and V1* =300,V2* =500=W2.
Fig. 5.13 Situation 2: Convergence towards the fixed point (0, 225, 75, 0, 375, 125)
Examining both Figs. 5.12 and 5.13, it appears that one of the main trends of the CWPCR model is to take into account the role of the spatial configuration on both behavioural dynamics and on the crowd’ ability to escape from a dangerous place towards a place of shelter, when such a place offers sufficient room for the crowd. In effect, in the first situation, everyone can leave place 1, as we can see on Fig. 5.12 where V1(t) vanishes for t > 15 mn, and the entire population escapes to place 2 (V2(t) = 800 for t > 15 min). However, in the second situation, a part of the population remains stranded in place 1, because W2 = 500, which is less than the total number of the crowd equal to 800. Therefore, we can see in Fig.
22 5.13 that V1(t) tends to 300 = 800 – 500. These first results lead us to consider more complicated spatial configuration networks in the following section.
5.4. Influence of the spatial configuration on the pace of evacuation
We now seek to identify the obstacles that slow the escape of the crowd in the aftermath of the initial shock by analysing the topology of the network of streets and places in a city. This information can potentially be used to improve the design of a city to facilitate the escape of a crowd towards more secure places.
For the sake of simplicity, we consider first a simplified oriented network with only three nodes (N W1; 1) ; (N W2; 2) ; (N W3; 3) and two edges (N1→N2) ; (N2→N3) (Fig. 5.14). Such a
simplified network can be straightforward complexified by adding as many nodes and edges as necessary, without any difficulty. However, it is better to first focus our attention on the nature of the obstacles in this simplified network.
Fig. 5.14 Three node network: people in every state are rushing from node 1 towards node 2, and from node 2
towards node 3, keeping the same behavioural class
5.4.1. Equation of the three node network
The corresponding equation of the three nodes network is
1 1 2 1 ,1,2 1 2 2 2 2 1 1 1 1 1 2 1 ,1,2 1 2 2 2 2 1 2 1 1 1 2 1 ,1,2 1 2 2 2 2 2 1 2 2 ( ) ( ) ( ) ( )( ( ) ( ) ( )) ( ) ( ) ( ) ( ) ( )( ( ) ( ) ( )) ( ) ( ) ( ) ( ) ( )( ( ) ( ) ( )) ( ) ( ) ( r c p r t B B r t r t W c t p t r t c t B r t C p t C c t c t W c t p t r t p t B r t C p t C c t p t W c t p t r t r t B B r = − + − − − − = + − − − − − = − + − − − − = − + ,1,2 1 2 2 2 2 ,2,3 2 3 3 3 3 2 1 2 1 2 2 2 ,1,2 1 2 2 2 2 ,2,3 2 3 3 3 3 2 2 2 1 2 2 2 ) ( )( ( ) ( ) ( )) ( )( ( ) ( ) ( )) ( ) ( ) ( ) ( ) ( )( ( ) ( ) ( )) ( )( ( ) ( ) ( )) ( ) ( ) ( ) ( ) r r c c t r t W c t p t r t r t W c t p t r t c t B r t C p t C c t c t W c t p t r t c t W c t p t r t p t B r t C p t C c t + − − − − − − − = + − + − − − − − − − = − + + ,1,2 1 2 2 2 2 ,2,3 2 3 3 3 3 3 1 2 3 ,2,3 2 3 3 3 3 3 1 3 1 3 2 3 ,2,3 2 3 3 3 3 3 2 3 1 3 2 ( )( ( ) ( ) ( ) ( )) ( ) ( ) ( ) ( ) ( )( ( ) ( ) ( )) ( ) ( ) ( ) ( ) ( )( ( ) ( ) ( )) ( ) ( ) ( ) p p r c p t W t c t p t r t p W c p r r t B B r t r t W c t p t r t c t B r t C p t C c t c t W c t p t r t p t B r t C p t C − − − − − − − = − + + − − − = + − + − − − = − + c t3( ) p,2,3p t W2( )( 3 c t3( ) p t3( ) r t3( )) + − − − (5.29) Edge (N1→ N2) (Street) Edge (N2→ N3) (Street)
r1 p1 c1 c2 p2 r2 r3 p3 c3 Node 1 (Place 1) Node 2 (Place 2) Node 3 (Place 3)
23
5.4.2. Scaling the parameters
Fixing the value of all the parameters in PCR, WPCR or CWPCR is a very complicated task, which has not yet been done on an experimental basis. In the framework of the Com2SiCa project, an experimental protocol is under scrutiny, in order to achieve these results in the near future. However, it is important to note that only relative values between parameters are important, because there is a relationship between the unit of time and the unit used for the parameters. In other words, considering all the parameters of the adimensional Eq. (5.29), (i.e. Bi0,Ci0,c i j, , ,p i j, , ,r i j, , ,i=1, 2, j=2, 3) integrated with respect to the
variable time
t
, it is nearly equivalent to consider such parameters multiplied by the same constant and integrated using the time variable t
= (e.g. can be considered in seconds, minutes, or hours). There is not, strictly speaking, equivalence because such parameters are linearly used in the WPCR model, however in the CWPCR model the coupling is nonlinear and a slight distortion intervenes during a transient short period for some variables.
5.4.3. Speed of convergence towards the fixed points
To stay closer to reality, we further assume that people in reflex situation are stunned and paralysed. They cannot rush from one node to another (Fig. 5.15), therefore the transitions between r r r1, ,2 3 are forbidden. People in this stunned state can only change their behaviour (from r to p or c).
Fig. 5.15 Three node network: people in the reflex behaviour state are stranded in their original node
To achieve this goal Eq. (5.29) is simply modified to vanish parameters
, , , 1, 2, 2, 3
r i j i j
= = .As previously described (Sect. 5.3.3), we consider the values of the parameters
t
Edge (N1→ N2) (Street) Edge (N2→ N3) (Street)
r1 p1 c1 p2 c2 r2 r3 p3 c3 Node 1 (Place 1) Node 2 (Place 2) Node 3 (Place 3)
24
1 0.2, 2 0.4, 1 0.3, 2 0.1
B = B = C = C = and we choose c,1,2=c,2,3=p,1,2 =p,2,3=0.005.
For the following values V1,0=20000,V2,0 =0,V3,0 =0,W120000,W2 =1000,W3 =20500,
the fixed point ( * * * * * * * * * 1, 1, 1, 2, 2, 2, 3, 3, 3 r c p r c p r c p ) = (0, 0, 0, 0, 0, 0, 0, 15000, 5000) is straightforward to compute: * 1 * 1 * 1 * 2 * 2 * 1,0 2,0 3,0 3 2 * 3 1 1,0 2,0 3,0 * 3 1 2 2 1,0 2,0 3,0 * 3 1 2 0 0 0 0 0 if , 0 0 ( ) ( ) r c p r c V V V W p r C V V V c C C C V V V p C C = = = = = = + + = + + = + + + = + (5.30) * 1 * 1 * 1 * 2 1 1,0 2,0 3,0 3 * 2 1 2 3 1,0 2,0 3,0 3 2 1,0 2,0 3,0 3 * 2 1 2 * 3 * 1 3 3 1 2 * 2 3 3 1 2 0 0 0 0 ( ) if , ( ) 0 r c p r C V V V W c C C W V V V W C V V V W p C C r C W c C C C W p C C = = = = + + − = + + + − + + = + = = + = + (5.31) * 1 * 1 * 1 * 2 1 1,0 2,0 3,0 2 3 * 2 1 2 2 3 1,0 2,0 3,0 2 1,0 2,0 3,0 2 3 * 2 1 2 * 3 * 1 3 3 1 2 * 2 3 3 1 2 0 0 0 0 ( ) if , ( ) 0 r c p r C V V V W W c C C W W V V V C V V V W W p C C r C W c C C C W p C C = = = = + + − − = + + + − − + + + = + = = + = + (5.32)
25
Moreover * * *
1 0, 2 0, 3 20000
V = V = V = . This value means that, initially, all the people are
in node 1 and both nodes 2 and 3 are empty, but after a certain period of time, both nodes 1 and 2 are empty and everyone has reached node 3. One can see the flow of people through the two edges (N1→N2) ; (N2→N3), in Fig. 5.16.
26
5.4.4. Influence of the intermediate place capacity on the evacuation dynamics
Intermediate places play a central role in the fluidity or, to the contrary, the congestion of movement between a dangerous place and a shelter place. This can be shown in the following numerical experiments: with the same parameter values, except for the size of node 2, we analyse the speed at which the people are emptying the place of the terrorist (node 1). We consider the following values of (Fig. 5.17).
Fig. 5.17 Convergence towards the fixed point (0, 0, 0, 0, 0, 0, 0, 15000, 5000) for the values of parameters = 0.2, = 0.4, = 0.3, = 0.1, c,1,2=c,2,3 =p,1,2 =p,2,3=0.005, = 20000, = 0,
= 0, , = 20500 and the values of W2= 50 (red curves), W2= 100 (green curves), W2= 200 (blue curves), W2= 1000 (black curves)
In the case W2 = 1000 (black curves) the flight of the entire population from place 1 to place 2 (which can be a small square) and then to place 3 is very fast, it lasts less than 10 minutes (Figs 5.17c, f, i), because place 3 can foster the entire population. There is a massive influx of panicked people (Fig. 5.17d), which is greater than the controlled one (Fig. 5.17e), into place 2, which empties very quickly as the majority of controlled people reach the safe shelter (Fig. 5.17h). However, it can be noted that a significant number of the panicked population remains in the refuge place, and this number is only slowly decreased (see bump (Fig. 5.17g)).
This is explained by the fact that the flight dynamics are not hindered by obstacles or bottlenecks, and the fleeing populations have not enough time to change their behavioural state.
On the other hand, if W2 = 50 (red curves), the evacuation of the total population from place 1 to place 2 and then place 3 is much slower (about 25 minutes instead of less than 10 minutes, (Figs 5.17c, f, i)). The panicked population has time to calm down in place 1, because there is no new attack (it has been assumed that there is no domino effect, s1 = s2 =
1 B B2 C1 C2 V1,0 V2,0 3,0 V W1V1 W3 2: 50, 100, 200, 1000 W
27 0). It is thus a population that is mainly in a state of reasoned behaviour that arrives in place 3 (Figs. 5.17g, h).
It can be highlighted from this first analysis that the faster the speed of change of location (hence decreasing the vulnerability of populations), the faster this speed leads to significant flows of panic in both places 2 and 3. There is a paradox here: the fast self-safety movement of populations leads to situations of collective panic that are more difficult to manage. This fact must be taken into account by emergency services and emergency physicians.
Although the deaths that occur are not included in this CWPCR model version, one can imagine that the escape of panicked populations would induce more victims.
As said before, the simulation results shed light on the importance of the size of the intermediate places and their role in the fluidity or, to the contrary, on the congestion of movements between a dangerous place and a shelter place.
Depending on their respective size, intermediate places will modulate the dynamics and the speed of flow of the crowds. In this sense, they become strategic places both for the planners, who must think about the organization of the area to host public events, and also for the terrorists who can use these strategic places to multiply the effect of their harmful actions by trapping the flight movements between two areas of action.
This can be summarized in both Figs. 5.18 and 5.19, where the duration of evacuation time for 80% of people from place 1 is displayed according two variables: the capacity of place 2 versus that of place 3. The arrow goes from long durations (in warm colours) to short durations (in cold colours). This representation is similar to a heat map. It is an easy way to identify a “hot spot” (i.e. a configuration with an excessively long evacuation time) or, to the contrary, a more comfortable configuration with an acceptable evacuation duration time, which would save more lives.
In Fig. 5.18, the parameters that model the topological characteristics of the street linking node 1 to node 2, and node 2 to node 3, are set to :c,1,2=c,2,3 =p,1,2 =p,2,3 =0.0025.
In contrast, in Fig. 5.19 their values are doubled: c,1,2=c,2,3=p,1,2 =p,2,3=0.005, to model larger streets. In this case, shorter evacuation times are obtained.
28
Fig. 5.18 Time required to evacuate 80% of population from place 1 according to W2 and W3 with η = 0.0025
andV1,0 = 20 000
Fig. 5.19 Time required to evacuate 80% of population from place 1 according to W2 and W3 with η = 0.005
29 One can see the necessary configurations that are required for a given evacuation time in Figs. 5.18 and 5.19. As an example, if we consider a duration between 20 and 25 minutes, in Fig. 5.18, this duration can be obtained with a narrow intermediate place that can accommodate 40 to 50 people, only if the capacity of place 3 is greater than 30,000 people. Instead the same duration is possible with a smaller place 3 (with a capacity between 16,500 and 17,000 people) if the capacity of place 2 is higher (between 90 and 100 people). That means that if planners who organize sites to host public events or festivals cannot enlarge the intermediate place (for example, due to the shape of a historic city center) they must establish a larger final evacuation shelter.
5.5. Conclusion
In this article we have developed a new model of weighted human behaviour coupled on street and place networks, in the context of an urban terrorist attack, thus improving the PCR model [3-4] with bottleneck coupling and by taking into account the capacity of every place and the number of people stranded in these places. The simulation results in a simple network with three nodes (places or public squares) and two edges (streets) that demonstrates the key role of the capacity of an intermediate place in the dynamics of evacuation from dangerous to safe places. This model is presented with a user-friendly graphical representation, which allows planners to accurately consider where to host public events in a specific territorial context.
Acknowledgements
This work has been supported by the French government, through i) the National Research Agency (ANR) under the Societal Challenge 9 "Freedom and security of Europe, its citizens and residents" with the reference number ANR-17-CE39-0008, co-financed by French Defence Procurement Agency (DGA) and The General Secretariat for Defence and National Security (SGDSN), and ii) the UCAJEDI Investments in the Future project managed by the National Research Agency (ANR) with the reference number ANR-15-IDEX-01.
References
[1] Marchesin, Ph.: Introduction aux relations internationales, Paris, Karthala, coll. Hommes et Sociétés, (2008).
[2] Colonna, J.-F.: Expériences virtuelles et virtualités expérimentales. In: Réseaux, volume 11, n°61, (1993).
[3] Provitolo, D., Dubos-Paillard, E., Verdière, N., Lanza, V., Charrier, R., Bertelle, C., Aziz-Alaoui, M. A. “Les comportements humains en situation de catastrophe: de l’observation à la modélisation conceptuelle et mathématique”, Cybergeo : Européean Journal of Geography [on line], document 735, set on line on September, 10, 23 p., (2015).
[4] Verdière, N., Lanza, V., Charrier, R., Provitolo, D., Dubos-Paillard, E., Bertelle, C., Aziz-Alaoui, M. A.: “Mathematical Modeling of Human Behaviours During Catastrophic Events”, ICCSA14, 23-26 June, Le Havre, 8 p., (2014).


![Fig. 5.9 Relationship between flow and density of pedestrians from the literature, from [17, derived from Fruin, Weidmann, Virkler, Older, Sarkar and Tanariboon]](https://thumb-eu.123doks.com/thumbv2/123doknet/14703133.565440/16.892.172.723.691.929/relationship-density-pedestrians-literature-derived-weidmann-virkler-tanariboon.webp)
![Fig. 5.10 Relationship between flow and density of pedestrians going through an oversaturated bottleneck, from [17]](https://thumb-eu.123doks.com/thumbv2/123doknet/14703133.565440/17.892.140.765.195.534/fig-relationship-flow-density-pedestrians-going-oversaturated-bottleneck.webp)