HAL Id: hal-00546673
https://hal-brgm.archives-ouvertes.fr/hal-00546673
Submitted on 14 Dec 2010
HAL is a multi-disciplinary open access
archive for the deposit and dissemination of
sci-entific research documents, whether they are
pub-lished or not. The documents may come from
teaching and research institutions in France or
abroad, or from public or private research centers.
L’archive ouverte pluridisciplinaire HAL, est
destinée au dépôt et à la diffusion de documents
scientifiques de niveau recherche, publiés ou non,
émanant des établissements d’enseignement et de
recherche français ou étrangers, des laboratoires
publics ou privés.
Modelling the long-term evolution of groundwater’s
quality in a flooded iron-ore mine using a reactive
transport pipe network model
Laurent Vaute, Pierre Le Pape, Pauline Collon-Drouaillet, Robert Fabriol
To cite this version:
Laurent Vaute, Pierre Le Pape, Pauline Collon-Drouaillet, Robert Fabriol. Modelling the long-term
evolution of groundwater’s quality in a flooded iron-ore mine using a reactive transport pipe network
model. International Mine Water Association Symposium (IMWA 2010), Sep 2010, Sydney (Nova
Scotia), Canada. p. 317-320. �hal-00546673�
Modelling the long-term evolution of groundwater’s quality in a flooded
iron-ore mine using a reactive transport pipe network model
laurent vaUte¹, Pierre lePaPe², Pauline Collon-dRoUaillet³, Robert FaBRiol¹
¹BRGM, 1 avenue du Parc de Brabois, F-54500 Vandoeuvre-lès-Nancy, France, [email protected] ²UMR 8148 IDES, Université Paris-sud-CNRS, Bât. 504, F-91405 Orsay, France, [email protected]
³CRPG-CNRS, Nancy Université, ENSG, rue du doyen Marcel Roubault, BP 40, F-54501 Vandoeuvre-lès-Nancy, France, [email protected]
Abstractover the past 25 years, underground mine flooding in the lorraine iron Basin (France) has
re-sulted in a high concentration of dissolved sulphate and have made the water unsuitable for human consumption. this problematic issue has led to the development of numerical tools to support water-resource management in mining contexts. as water flows mainly in galleries and collapsed zones, we consider the flooded mine as a network of pipes and tanks. the software used for simulating flow and reactive transport in this network is the ePanet 2 code. a simplified sulphate dissolution-precipitation model, based on previous works, is included as source/sink in the tanks. Flow rates are calculated by processing data records with a rainfall-discharge model. the simulator gives good agreement between the calculated and observed sulphate concentrations.
Key Wordsflooded mine, modelling, groundwater quality, ePanet
Introduction
in lorraine (France), industrial mining began in the 19th century and reached a peak in the 1960s, followed by a decline that had finally led to mines closure and flooding in the 1990s-2000s. the total volume of the flooded mines voids is about 450 million cubic meters. However, the quality of this water was lowered during the mine flooding, making it inappropriate for human consump-tion. in order to manage the water resources of this region, in the past supplied to a large extent by dewatering, it is necessary to predict its long-term quantitative and qualitative evolution.
However, in most of cases, the complexity of the mine structure and the lack of information on its hydrodynamic parameters make classic groundwater modelling insuitable for predicting the impact of mining activities on groundwater quality (Wolkersdorfer 2008). to overcome this limita-tion, Collon et al. (2006) use lumped parameter models, also known as “box” models; the method consists in dividing the complex mine workings into hydraulically connected homogeneous hydro-logical units. Hamm et al. (2008) use physically-based distributed flow and solute-transport models, considering that flow and transport takes place only in channel or pipe networks. Brouyère et al. (2009) consider interactions between the porous media and the flooded mine workings through coupling continuum porous media with a box model. adams et al. (2001) use a similar approach, but the porous media is coupled to a pipe-network model used for modelling flow through mine galleries. in this paper, we consider a flooded mine as a network of pipes and tanks, each of these el-ements of the model representing an homogeneous group of mine workings. the software used for simulating flow and reactive transport in the network is the ePanet 2 code (Rossman 2000), ini-tially designed for modelling flow and simulating water quality in water-supply networks.
Site description
the lorraine iron basin is located along the eastern edge of the Paris Basin (France). it covers an area that is 30 km long (northsouth) and 10 km wide, and it is subdivided in three main flooded basins. our modelling was carried out on the so-called South Basin (fig. 1). the lorraine iron-bearing deposit (10–65 m thickness) dates from the aalenian (Jurassic) and is formed of ferruginous limestone (min-eralised layers) with marly intercalations. Five min(min-eralised levels were mined in the South Basin. the iron-bearing succession is overlained by Bajocian micaceous marls (5–25 m thickness), which are themselves overlained by the dogger limestone aquifer formation (40–80 m thickness).
Conceptual model of the South basin
the South Basin was mined using the room and pillar method, and it is still possible to distinguish gallery zones, where the pillars are still standing, from collapsed zones, where the pillars have
Sydney, NS “Mine Water and Innovative Thinking” IMWA 2010
Wolkersdorfer & Freund (Editors) 317
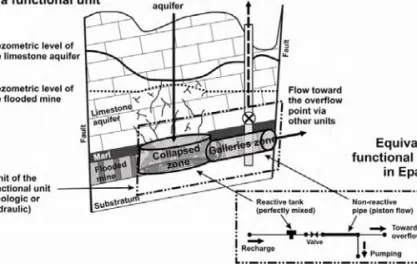
been pulled – these zones represent approximatively 50% of the mine workings area. due to frac-turation and partial destruction of the Bajocian impermeable micaceous marl, collapsed zones enabled water from the dogger limestone aquifer to infiltrate into the mine galleries (fig. 2). dur-ing the last twenty years of mindur-ing activity, between 3.3 and 19.4 million cubic meters of this in-filtrating water was pumped monthly in the mine workings of the south basin. this mine was closed in 1995 and dewatering was stopped. this led to the flooding of the mine workings and of the base of the dogger formation. in october 1998 water has started flowing out at one overflow point. infiltrating rainwater recharges the karstic dogger aquifer, which is now drained by the net-work of mine galleries via the collapsed zones.
in four mine shafts and one overflow point, quantitative and qualitative groundwater mon-itoring, during and after the mine flooding, shows that water has become highly enriched in dis-solved So₄ (up to 1.6 g/l) and in other disdis-solved compounds like Ca, na, Mg, K, Mn and B. interestingly, water has a neutral pH. the degradation of the mine water quality relatively to sul-phate is of main interest, because the measured sulsul-phate concentrations are far beyond the drink-ing water quality standard of 250 mg/l. Previous comprehensive chemical and mineralogical studies (Collon et al. 2006) permit us to explain the rise of sulphate concentration, at the begin-ning of the flooding, by a simplified two-step scenario (Hamm et al. 2008). the first step corre-sponds to the cutting of the mine galleries, when pyrite oxidation and neutralisation by carbonates produce mainly gypsum at the surface of rock fractures in contact with the air. the second step starts with the flooding of the abandoned workings and is characterised by the dis-solution of the gypsum, giving rise to high sulphate concentrations. groundwater flow rate through the mine system is too rapid for thermodynamic equilibrium to be reached; and the flooded mine water is generally undersaturated with respect to gypsum. gypsum is mainly lo-cated in the fractures of the blasted rocks in the collapsed zones. as recharge water of the flooded mine flows through theses zones, we therefore can assimilate all the collapsed zones with reactors where the dogger water is in contact with gypsum.
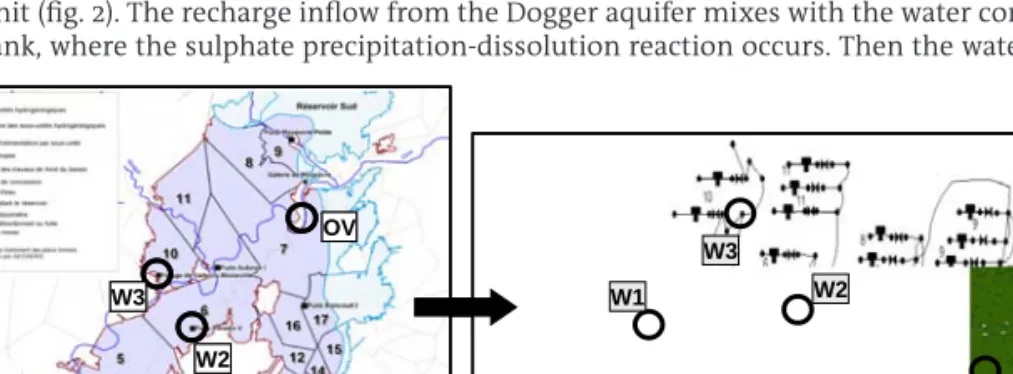
a cartographic analysis of the 75 available mine plans led us to divide the flooded area of the South Basin into 33 functional units, 6 of them including one of the monitoring points of the basin (wells or overflow). a functional unit is defined as a sector of the flooded mine considered independant from its neighbours from an hydraulic point of view. indeed it is separated from ad-jacent units by unexploited bearing-ore zones, faults or collapsed zones regarded as hydraulic barriers (fig. 2). each functionnal unit contains the two types of workings: collapsed zones and galleries zones. it is connected to some neighbours units by a small number of galleries, so that the network of the fonctional units make it possible to represent the entire flooded mine (fig. 1).
Development of the numerical simulator
a unit can be modelled as a chemical reactor (a tank in ePanet), representing all the collapsed zones of the unit, connected to a chemically non-reactive pipe, representing all the galleries zones of the unit (fig. 2). the recharge inflow from the dogger aquifer mixes with the water contained in the tank, where the sulphate precipitation-dissolution reaction occurs. then the water flows
IMWA 2010 “Mine Water and Innovative Thinking” Sydney, NS
Wolkersdorfer & Freund (Editors) 318 W1 W2 W3 OV W1 W2 W3 OV W1 W2 W3 OV W1 W2 W3 OV W1 W2 W3 OV W1 W2 W3 OV W1 W2 W3 OV
Figure 1Map of South basin, and its equivalent network in EPAnet (labels of wells W1, W2, W3 and
of the overflow point OV correspond to labels on figure 3)
through the non-reactive pipe, and finally mixes at the outlet junction of the unit with water flow-ing from other connected units.
For each ore-bearing layer, the galleries zones and the collapsed zones were digitized with Mapinfo® from mine plans. the distribution of the total exploited surface area in each unit gives an estimation of the distribution of the exploited rock volumes and, thus, of the water volume in each sector. the overall calculated volume is 230 million m³, which is in accordance with the 200 million m³ estimated by the mining company.
inflow rate was calculated using the teMPo® computer code based on signal-processing methods (Pinault et al. 2001). this code calculates the impulse response relating effective rainfall data with overflow discharge records over the period when such data were measured (1998–2009). From this, we calculate the mine’s post-flooding recharge rate over the 2009–2018 period using a mean effective rainfall calculated by a stochastic method. We assume that each functional unit receives a part of this recharge proportional to its relative area. the model takes into account pumpings and local inflows from known karstic losses.
the governing equations for water quality in the ePanet code include advective transport in the pipes coupled with kinetic reactions and mixing processes at the pipe junctions. to take the solid sulphate dissolution–precipitation reaction into account, specific reaction rates are added to the ePanet water-quality solver (Hamm et al. 2008). For the water-quality simulation, each tank is characterised by kinetic dissolution and precipitation constants and by an initial solid sulphate mass. the model considers that all the pipes and tanks are saturated with water at the beginning of the simulation. this implies that the simulation begins at the post-filling phase when overflow begins, and does not include the filling process itself.
Simulation results
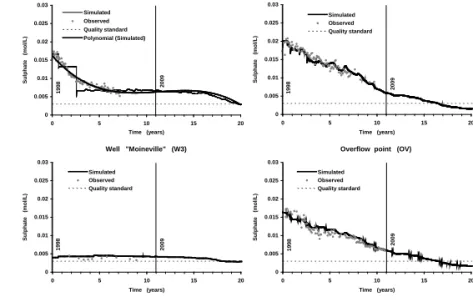
in order to calibrate the model, we adjusted the global initial available mass of solid sulphate and the global apparent kinetic precipitation constant of reaction; and we fixed an initial sulphate concentration in water for each tank and pipe. Simulated sulphate concentrations are then com-pared against measurements at 3 pumping wells and at the overflow point, for the first 10 years after the beginning of the mine overflow (fig. 1). the simulated concentrations are in good agree-ment with the observed evolution of sulphate (fig. 3). the well Paradis v (W2) and the overflow point (ov) present the same general behaviour, a quasi-linear decrease followed by a slight slow-down. the well droitaumont ii (W1) shows a sharp decrease followed by a stabilization around the 8th year. the well Moineville (W3) shows a low initial sulphate concentration stable during the overall simulation: this is due to the characteristics of this functionnal unit, which is related with a well known karstic stream loss and thus has a high recharge, and which is almost discon-nected from the main part of the flooded mine.
Sydney, NS “Mine Water and Innovative Thinking” IMWA 2010
Wolkersdorfer & Freund (Editors) 319
Figure 2Conceptual model of the South basin: a functional unit and its equivalent unit in EPAnet
Conclusions
the lorraine iron-ore basin is a complex hydrogeological system, formed by the superposition of a fractured and karstic limestone strongly connected to the flooded mine. the lack of both hy-drological data and chemical data make classic modelling methods unsuitable. We thus tried to simulate the long-term evolution of groundwater’s quality using a reactive transport pipe network model. We first analyse 75 mine plans of the South basin flooded-mine, which led us to divide the mine workings into 33 functional units, then we built the numerical simulator with epanet. the simulator gives good agreement between the calculated and observed sulphate concentrations in water. this kind of pipe network model can provide information on flow and chemical behav-iour (dissolved sulphate concentrations, remaining mass of solid sulphate) in the network.
Acknowledgements
the authors wish to acknowledge financial support of the agence de l’eau Rhin-Meuse and the Conseil Régional lorraine. this work forms part of the research program carried out by the giSoS Research group for the impact and Safety of Underground Works.
References
adams R, younger Pl (2001) a strategy for modeling groundwater rebound in abandoned deep mine systems. ground Water, 39(2):249—261
Brouyère S, orban P, Wildemeersch S, Couturier J, gardin n, dassargues a (2009) the hybrid finite ele-ment mixing cell method: a new flexible method for modelling mine ground water problems. Mine Water environ, 28:102—114
Collon P, Fabriol R, Buès M (2006) Modelling the evolution of water quality in abandoned mines of the lorraine iron Basin. J Hydrology, 328:620—634
Hamm v, Collon-drouaillet P, Fabriol R (2008) two modelling approaches to water-quality simulation in a flooded iron-ore mine (Saizerais, lorraine, France): a semi-distributed chemical reactor model and a physically based distributed reactive transport pipe network model. J Contaminant Hydrol-ogy, 96(1—4):97—112
Pinault Jl, Plagnes v, aquilina l, Bakalowicz M (2001) inverse modelling of the hydrological and the hy-drochemical behaviour of hydrosystems: characterisation of karst system functioning. Water Re-sources Research 37(8):2191—2204
Rossman la (2000) ePanet 2 users manual. Water Supply and Water Resources division, national Risk Management Research laboratory, Cincinnati, oH, 45268, 200 pp
Wolkersdorfer C (2008) Water management at abandoned flooded underground mines: fundamentals, tracer tests, modelling, water treatment. Springer-verlag, Heidelberg, 465 pp
IMWA 2010 “Mine Water and Innovative Thinking” Sydney, NS
Wolkersdorfer & Freund (Editors) 320
Well "Droitaumont II" (W1)
0 0.005 0.01 0.015 0.02 0.025 0.03 0 5 10 15 20 Time (years) S ul pha te ( m ol /L) Simulated Observed Quality standard Polynomial (Simulated) 1998 2009 Well "Paradis V" (W2) 0 0.005 0.01 0.015 0.02 0.025 0.03 0 5 10 15 20 Time (years) S ul pha te ( m ol /L) Simulated Observed Quality standard 1998 2009 Well "Moineville" (W3) 0 0.005 0.01 0.015 0.02 0.025 0.03 0 5 10 15 20 Time (years) S ul pha te ( m ol /L) Simulated Observed Quality standard 1998 2009
Overflow point (OV)
0 0.005 0.01 0.015 0.02 0.025 0.03 0 5 10 15 20 Time (years) S ul pha te ( m ol /L) Simulated Observed Quality stardard 1998 2009
Figure 3Results of the simulation