HAL Id: hal-03137422
https://hal.archives-ouvertes.fr/hal-03137422
Submitted on 10 Feb 2021
HAL is a multi-disciplinary open access
archive for the deposit and dissemination of
sci-entific research documents, whether they are
pub-lished or not. The documents may come from
teaching and research institutions in France or
abroad, or from public or private research centers.
L’archive ouverte pluridisciplinaire HAL, est
destinée au dépôt et à la diffusion de documents
scientifiques de niveau recherche, publiés ou non,
émanant des établissements d’enseignement et de
recherche français ou étrangers, des laboratoires
publics ou privés.
Preparatory neural networks are impaired in adults with
attention-deficit/hyperactivity disorder during the
antisaccade task
Rebecca Hakvoort Schwerdtfeger, Nadia Alahyane, Donald Brien, Brian Coe,
Patrick Stroman, Douglas Munoz
To cite this version:
Rebecca Hakvoort Schwerdtfeger, Nadia Alahyane, Donald Brien, Brian Coe, Patrick Stroman,
et al..
Preparatory neural networks are impaired in adults with attention-deficit/hyperactivity
disorder during the antisaccade task.
Neuroimage-Clinical, Elsevier, 2013, 2, pp.63-78.
Preparatory neural networks are impaired in adults with
attention-de
ficit/hyperactivity disorder during the antisaccade task
Rebecca M. Hakvoort Schwerdtfeger
a, Nadia Alahyane
a, Donald C. Brien
a, Brian C. Coe
a,
Patrick W. Stroman
a,b,c, Douglas P. Munoz
a,d,e,f,⁎
a
Centre for Neuroscience Studies, Queen's University, Kingston, Ontario, Canada
b
Department of Diagnostic Radiology, Queen's University, Kingston, Ontario, Canada
c
Department of Physics, Queen's University, Kingston, Ontario, Canada
d
Department of Biomedical and Molecular Sciences, Queen's University, Kingston, Ontario, Canada
eDepartment of Medicine, Queen's University, Kingston, Ontario, Canada f
Department of Psychology, Queen's University, Kingston, Ontario, Canada
a b s t r a c t
a r t i c l e i n f o
Article history: Received 7 June 2012
Received in revised form 23 October 2012 Accepted 25 October 2012
Available online 2 November 2012
Keywords: ADHD Saccade fMRI Preparation Inhibition
Adults with attention-deficit/hyperactivity disorder (ADHD) often display executive function impairments, particularly in inhibitory control. The antisaccade task, which measures inhibitory control, requires one to suppress an automatic prosaccade toward a salient visual stimulus and voluntarily make an antisaccade in the opposite direction. ADHD patients not only have longer saccadic reaction times, but also make more di-rection errors (i.e., a prosaccade was executed toward the stimulus) during antisaccade trials. These deficits may stem from pathology in several brain areas that are important for executive control. Using functional MRI with a rapid event-related design, adults with combined subtype of ADHD (coexistence of attention and hyperactivity problems), who abstained from taking stimulant medication 20 h prior to experiment onset, and age-match controls performed pro- and antisaccade trials that were interleaved with pro- and anti-catch trials (i.e., instruction was presented but no target appeared, requiring no response). This method allowed us to examine brain activation patterns when participants either prepared (during instruction) or executed (after target appearance) correct pro or antisaccades. Behaviorally, ADHD adults displayed several antisaccade deficits, including longer and more variable reaction times and more direction errors, but saccade metrics (i.e., duration, velocity, and amplitude) were normal. When preparing to execute an antisaccade, ADHD adults showed less activation in frontal, supplementary, and parietal eyefields, compared to controls. However, activation in these areas was normal in the ADHD group during the execution of a correct antisaccade. Interestingly, unlike controls, adults with ADHD produced greater activation than controls in dorsolateral prefrontal cortex during antisaccade execution, perhaps as part of compensatory mechanisms to optimize antisaccade production. Overall, these data suggest that the saccade deficits observed in adults with ADHD do not result from an inability to execute a correct antisaccade but rather the failure to properly prepare (i.e., form the appropriate task set) for the antisaccade trial. The data support the view that the exec-utive impairments, including inhibitory control, in ADHD adults are related to poor response preparation.
© 2012 The Authors. Published by Elsevier Inc.
1. Introduction
Attention-deficit/hyperactivity disorder (ADHD) is one of the most common psychiatric disorders of childhood. Approximately 50–60% of
youths diagnosed with ADHD have symptoms that persist into adulthood (Barkley et al., 2002), and recent epidemiological data indicate that ADHD affects approximately 2–4% of adults (Kessler et al., 2006). ADHD is characterized by three core symptoms— inattention, hyperactivity, and impulsivity. These define three subtypes of ADHD: 1) inattentive; 2) hyperactive/impulsive; and 3) combined (symptoms of both inatten-tion and hyperactivity/impulsivity), with the combined subtype being the most common (Wolraich et al., 1996; Hurtig et al., 2007).
Adults with ADHD often have difficulty performing a wide range of tasks that comprise a series of complex behaviors classified as ‘executive functions’ (Gallagher and Blader, 2001; Boonstra et al., 2005; Seidman, 2006). Executive functions include filtering out distracting stimuli, inhibiting automatic responses, working memory, and planning to carry out goal-directed behavior. Response inhibition
⁎ Corresponding author at: Centre for Neuroscience Studies, Queen's University, Kingston, Ontario, Canada K7L 3N6. Tel.: +1 613 533 2111; fax: +1 613 533 6840.
E-mail addresses:[email protected](R.M. Hakvoort Schwerdtfeger), [email protected](N. Alahyane),[email protected](D.C. Brien), [email protected](B.C. Coe),[email protected](P.W. Stroman),
[email protected](D.P. Munoz).
2213-1582 © 2012 The Authors. Published by Elsevier Inc. http://dx.doi.org/10.1016/j.nicl.2012.10.006
Contents lists available atScienceDirect
NeuroImage: Clinical
j o u r n a l h o m e p a g e : w w w . e l s e v i e r . c o m / l o c a t e / y n i c l
Open access under CC BY-NC-SA license.
deficits are particularly widespread in ADHD. Many behavioral and brain imaging studies have assessed inhibitory control in children with ADHD (seeDoyle, 2006; Quay, 1997; Willcutt et al., 2005; for review); however, very few studies have been conducted examining the impact of inhibitory control deficits in adults with ADHD (see
Ossmann and Mulligan, 2003; Schneider et al., 2006; Seidman, 2006). Here, we used interleaved pro and antisaccade tasks (described below), combined with simultaneous eye-tracking and blood oxygen-level dependent (BOLD) functional magnetic resonance imaging (fMRI), to investigate specific inhibitory control deficits in adults with ADHD and their underlying neural correlates. The antisaccade task is a simple, yet elegant tool to measure inhibitory control because it requires participants tofirst inhibit an automatic, visually-guided eye movement toward a suddenly appearing target (a prosaccade), and in-stead produce a voluntary saccade in the opposite direction of the target (an antisaccade) (Hallet, 1978; Munoz and Everling, 2004). Therefore, to properly perform an antisaccade, participants are required not only to execute a saccade in the correct direction, but they must also suf fi-ciently prepare themselves to inhibit the unwanted prosaccade during the instruction period (i.e., establish a task set), prior to target appear-ance. The antisaccade task therefore enables investigation of processes relating to response preparation and execution, and how they speci fi-cally contribute to deficits in inhibitory control.
The cortical and subcortical regions that are involved in the suppression and/or generation of saccadic eye movements include
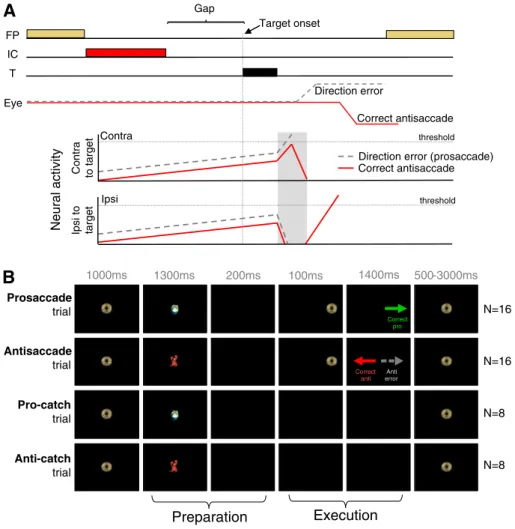
regions in the parietal and frontal cortices, basal ganglia, and superior colliculus (SC) based on research using monkey neurophysiology (Wurtz and Goldberg, 1989; Munoz and Everling, 2004; Leigh and Zee, 2006; Watanabe and Munoz, 2011a). Briefly, when a target ap-pears in the visualfield, many saccade-related neurons in both the frontal eyefields (FEF) and SC (on the contralateral side of the brain relative to target location) discharge a burst of action potentials (Mohler and Wurtz, 1976; Bruce and Goldberg, 1985). These same neurons then discharge a motor burst to drive the eyes to the visual target. During antisaccade trials, the excitability of these neurons must be suppressed, prior to target onset, so that the visual response does not trigger a saccade. Instead, saccade neurons in the FEF and SC on the other side of the brain, ipsilateral to the target, need to be activated to drive the voluntary antisaccade (Everling et al., 1999; Everling and Munoz, 2000). Accumulator models can be used to explain the neural contributions of the oculomotor network during antisaccade trials (Munoz and Everling, 2004; Munoz et al., 2007). During antisaccade trials (Fig. 1A), two processes race toward a threshold, and a saccade is triggered once neuronal activity surpasses this threshold. Thefirst process is set into action by the appearance of the target, initiating a rise in activation (contralateral to the target) that is associated with a movement toward that target (i.e., an auto-matic prosaccade), while the other process is initiated (on the ipsilat-eral side of the brain) by the inversion of the target vector to initiate a voluntary antisaccade. To perform an antisaccade correctly, processes
Direction error
A
FP T Gap Correct antisaccade Eye Contra to target Ipsi to target thresholdNeural activity
thresholdDirection error (prosaccade) Correct antisaccade IC Target onset Contra Ipsi Prosaccade trial 500-3000ms N=16 N=8 N=8 N=16 Antisaccade trial Pro-catch trial Anti-catch trial
Preparation
Execution
1000ms 1300ms 200ms 100ms 1400msB
Anti error Correct anti Correct proFig. 1. (A) Accumulator model of antisaccade task performance. When neural activity crosses the saccade threshold, a saccade is triggered. Neural activity of saccade-related neurons in su-perior colliculus on correct antisaccade trials (solid red line) and antisaccade direction error trials (dashed gray line). On correct trials, activity is reduced prior to target onset to prevent target-evoked activity from crossing the threshold. During error trials, this reduction is absent, resulting in target-evoked activity to cross the threshold. FP =fixation point. IC = instruction cue. T = target. (B) Illustration of stimuli and timing of events for the 4 trial types.
related to the initiation of the automatic prosaccade (Fig. 1A; dashed gray line) must be inhibited to allow time for the voluntary antisaccade response (Fig. 1A; solid red line) to accumulate toward the threshold. Therefore, saccade-related neurons that specifically code automatic prosaccades must be inhibited prior to target onset to prevent the initiation of direction errors. Mechanisms for this pre-target inhibition are present in several structures, including FEF (Everling and Munoz, 2000), supplementary eye fields (SEF;
Amador et al., 2004; Schlag-Rey et al., 1997), dorsolateral prefrontal cortex (DLPFC;Johnston and Everling, 2006), and caudate nucleus (CN;Watanabe and Munoz, 2010a, 2011a) of the basal ganglia. The parietal eyefields (PEF) and anterior cingulate cortex (ACC) are also involved in antisaccade production, particularly in the transformation of sensory signals to motor signals and error detection and/or moni-toring, respectively (Gottlieb and Goldberg, 1999; Zhang and Barash, 2000; Medendorp et al., 2005; Johnston et al., 2007; Nyffeler et al., 2007).
Studies examining antisaccade control in humans have reported differential activation of key oculomotor areas between antisaccade and prosaccade generation (Sweeney et al., 1996; Matsuda et al., 2004; Ettinger et al., 2008). Furthermore, recent event-related fMRI experiments have demonstrated increased BOLD activity during the preparatory, pre-target phase of the antisaccade task, as compared to the prosaccade task, in FEF, SEF, DLPFC, and ACC (Connolly et al., 2002, 2005; Ford et al., 2005; Brown et al., 2007), suggesting that components of the oculomotor network are recruited differently when preparing for either an antisaccade or prosaccade, with more preparatory activity requirements during antisaccade trials.
Adults with ADHD have difficulties exerting voluntary control over saccade generation: they not only have slower and more vari-able saccadic reaction times (SRTs), but also make more direction errors during antisaccade trials (i.e., a prosaccade was erroneously executed toward the target), more anticipatory eye movements (reaction timesb90 ms), and more express saccades (reaction times between 90 and 140 ms) (Munoz et al., 2003; Feifel et al., 2004; Carr et al., 2006). Yet saccade metrics (i.e., duration, peak velocity, and amplitude) in this group are typically normal to near-normal (Munoz et al., 2003; Feifel et al., 2004), suggesting that saccade de fi-cits in ADHD participants stem from an inability to establish the appro-priate task set rather than the execution of the saccadic motor response itself. This hypothesis has never been explicitly investigated and is the aim of the current study. We predict that antisaccade deficits produced by ADHD adults may arise from reduced activity of fronto-striatal areas that are responsible for suppressing saccade-related neurons prior to target onset.
2. Methods
All experiments were approved by the Research Ethics Board of Queen's University and were conducted in accordance with the prin-ciples of the Canadian Tri-council Policy Statement on Ethical Conduct for Research Involving Humans.
2.1. Participants
A total of 49 adult participants (28 ADHD and 21 controls) with normal or corrected-to-normal vision were recruited for this study via newspaper advertisements and posters displayed in doctor's of-fices. Twenty participants were subsequently excluded for several reasons. Twelve participants (8 ADHD and 4 control) were excluded because of excessive movement in the MRI scanner (> 3 mm ment in any of the 3 translational dimensions and/or >3 deg move-ment in any of the 3 rotational dimensions), 6 participants (4 ADHD and 2 control) because the eye tracking was unable to reliably detect the pupil, one control participant because of an incidentalfinding, one ADHD participant because she took stimulant medication within 20 h
of the MRI appointment, and one ADHD participant because of dental artifacts. Approximately 1.5 times more adults with ADHD were ex-cluded due to motion artifacts compared to controls (30% of adults with ADHD and 19% of adult controls), which was expected, particu-larly when ADHD participants were off medication during the scan-ning session. The final group of participants included 14 adults diagnosed with the combined subtype of ADHD (9 males, mean age 29.5 ± 9.4 years) and 14 age- and gender-matched controls (mean age 29.6 years ± 9.6 years). Participants with ADHD provided docu-mentation of a recent diagnosis (within 5 years) meeting DSM-IV criteria for ADHD, combined subtype. The documentation was provid-ed by a licensprovid-ed professional (either a psychologist or psychiatrist). Relying on ADHD diagnoses from community practitioners only is not ideal; however, we are confident that all participants in our ADHD group have been given an accurate diagnosis, given that the behavioral deficits exhibited by this group are in-line with those ob-served in other studies (Munoz et al., 2003; Feifel et al., 2004; Carr et al., 2006). Upon screening for neurological, developmental and current or past psychiatric disorders, two ADHD participants, who were included in the study, reported a current diagnosis of depression. ADHD participants were asked to abstain from taking stimulant medication for at least 20 h before the MRI session.
Table 1outlines the pharmacological treatments for each participant. Control subjects were screened (via telephone interview and a follow-up questionnaire) for absence of neurological, developmental, and previously diagnosed psychiatric disorders, and no family history of ADHD. All participants gave their written and informed consent and received free parking and $20/h as compensation for their participation.
2.2. Paradigm
An interleaved, rapid event-related design was employed for two reasons. First, trials were randomly interleaved to increase the dif fi-culty of the task, eliciting higher antisaccade error rates. Secondly, trials were presented at a rapid rate to enable the presentation of dif-ferent trial types in a reasonable time period. Two-thirds of all trials consisted of full pro or antisaccade trials aimed at examining both the preparatory and execution components of saccades (Fig. 1B, top 2 rows), and one-third of all trials consisted of‘preparation’ only trials (i.e., catch trials) that exclusively measured preparatory actions (Fig. 1B, bottom 2 rows). Participants were asked tofixate on a central fixation stimulus (a ‘gold coin’) that appeared for 1000 ms at the center of the screen to start each trial. The symbol used as afixation
Table 1
Clinical information for ADHD participants.
Patients Sex Age (years) Medication
1 M 39 2a F 23 3 M 38 4a F 19 Strattera, Doxepin 5 M 27 6 M 19 Ritalin 7 M 20 Ritalin 8 M 27 9 F 19 Concerta, Ritalin 10 M 28 Ritalin 11 M 20 12 F 32 13 M 24 Strattera 14 F 32 Ritalin M = male; F = female. a
stimulus, and its color, was then changed to indicate either the instruc-tion to make a pro or an antisaccade. The symbols used were colored cartoon images: a green turtle indicating that a prosaccade was re-quired or a red crab indicating that an antisaccade was rere-quired. Col-ored cartoon symbols were chosen because the experiment was conducted across various patient groups that included child-aged par-ticipants, and this made the task easier for children to learn.
Following presentation of the instructional cue, which remained present for 1300 ms, a 200 ms gap period occurred in which the par-ticipant was presented with a black screen. The gap period was intro-duced to enable participants to generate more‘automatic’ saccades, inducing shorter SRTs and more antisaccade direction errors and express prosaccades (Munoz and Corneil, 1995; Fischer and Weber, 1997; Munoz et al., 1998). On saccade trials, a peripheral target (gold coin) was thenflashed for 100 ms to the left or right of central fixation, at eccentricities of either 6° or 7° in separate trials. Partici-pants were instructed to execute a prosaccade (look toward the tar-get location) or antisaccade (look away from the tartar-get in the opposite direction) based on the colored instruction cue. The central fixation stimulus (gold coin) reappeared 1400 ms later, and partici-pants were required to re-establish centralfixation to initiate the next trial. On catch trials, the instruction cue was presented and disappeared to initiate the gap period, but the peripheral target did not appear to signal a saccade; subjects were instead required to maintain centralfixation for 1700 ms without generating a saccade response. Since participants did not know whether or not the periph-eral target would appear, the instruction cue would always elicit preparation for a pro or antisaccade. Full saccade and catch trials were therefore both 4500 ms in length. The inter-trial interval was jittered, usingfixation periods that spanned 1 repetition time (TR) (1.5 s; 8 times), 2 TR (3.0 s; 4 times) and 3 TR (4.5 s; 4 times) to in-crease the statistical efficiency and power in the rapid event-related design (Dale, 1999). Prior to commencing the task, participants were instructed to make a correction saccade if they generated errors. Runs consisted of 48 trials that included 8 pro-catch trials, 8 anti-catch trials, 16 prosaccade trials, and 16 antisaccade trials (Fig. 1B). Each participant performed 5–9 runs (depending on eye tracking success), with each run lasting 277.5 s. Each run started with an additionalfixation period of 3 s, while MR images were ac-quired, to allow the MR signal to reach a steady-state, and ended with a 16.5 sfixation period to allow the hemodynamic response to return toward baseline. Trial types were pseudorandomly interleaved, and pro and antisaccade trials were balanced for right and left presentation in each run. Both groups did not differ in terms of the number of com-pleted runs: the mean number of runs administered to the control and ADHD groups was 6.5 (±1.4) and 6.1 ± (1.4), respectively; groups did not differ in terms of the number of runs they completed (one-way ANOVA: F(1, 26) = 0.66, p = .42).
2.3. Visual display and eye tracking
Visual stimuli were generated and controlled using E-PRIME soft-ware (Psychology Softsoft-ware Tools Inc., Pittsburgh, PA, USA) on a per-sonal computer. Images were back-projected onto a high-contrast rear projection screen (DA-LITE), positioned at the head end of the MRI system, using a NEC LT265 DLP video projector (Tokyo, Japan) with a refresh rate of 60 Hz and resolution of 1024 × 768. Participants viewed the screen via a mirror attached to the head coil (described below). Using DQW software v1.10X, the right eye was tracked using an ISCAN ETL-400 camera (Burlington, MA, USA) that sampled eye position at 120 Hz. To ensure synchronization, the MRI sequences directly triggered the E-PRIME software using a trigger signal from the scanner. An infraredfiber-optic illuminator, which was fixed to the head coil, was used to illuminate the right eye for tracking. After the anatomical scan, the eye tracker was calibrated using a nine-point array that covered most of the visualfield. Analysis of
the eye movement data was performed off-line using custom-made MATLAB programs.
2.4. Imaging protocol
All imaging data were acquired using a Siemens 3 T Magnetom Trio system (Erlangen, Germany) fitted with a 12-channel receive-only head coil located at the Queen's University MRI facility. High-resolution T1-weighted whole-brain structural scans were performed on each
participant using a MPRAGE sequence (TR=1760 ms, TE=2.2 ms,flip angle=9°, 256×256 mm field-of view, and 256×256 matrix size providing 1 mm isotropic voxels). Functional data were collected using a T2*-weighted EPI acquisition (TR=1500 ms, TE=30 ms,flip angle=
72°, 211×211 mmfield-of-view, 64×64 matrix size, 3.3 mm isotropic voxel resolution, 185 volumes) for blood oxygenation-level dependent (BOLD)-based imaging (Ogawa et al., 1990). Twenty-four slices were ac-quired, positioned to include all regions of interest (ROI: FEF, SEF, PEF, DLPFC, ACC, and CN) extending from the top of the brain to the ventral striatum.
2.5. MRI pre-processing
All functional imaging runs were preprocessed using Brain Voyager 1.9 (Maastricht, the Netherlands). Thefirst two volumes of each func-tional time series were removed before any pre-preprocessing to allow the MR signal to reach a steady state. To correct for between-scan movements, all volumes were realigned to thefirst volume of each functional run. Slice scan time correction was conducted to adjust for time differences due to multi-slice imaging acquisition using cubic spline interpolation based on the TR and order of slice scanning (ascending interleaved). 3D spatial smoothing was then performed using a 4 mm full-width at half-maximum Gaussian filter on the volumes, and each run was filtered to remove linear drift using a high-passfilter with the upper cut-off frequency corresponding to 3 cy-cles over the run's length. Finally, all functional data were superimposed onto 3D anatomical images, resampled into 3 × 3 × 3 mm cubic voxels, aligned to the anterior commissure–posterior commissure axis, and transformed into Talairach space (Talairach and Tournoux, 1988).
To ensure that there were no significant between-group move-ment differences, which may have led to apparent BOLD contrast dif-ferences, we compared the groups' average displacement from the mean head position in six dimensions (translation in x, y, and z, and rotation around the x, y, and z axes) for the 14 participants selected per group. The total absolute movement of the ADHD group was 0.104 mm, 0.096 mm, and 0.175 mm for translation in the x, y, and z axes, respectively and 0.119 deg, 0.050 deg, and 0.082 deg for rota-tion in the x, y, and z axes, respectively. For the control group, it was 0.074 mm, 0.088 mm, and 0.135 mm for translation in the x, y, and z axes, respectively and 0.097 deg, 0.039 deg, and 0.065 deg for rota-tion in the x, y, and z axes, respectively. Adults with ADHD did not sig-nificantly differ from control participants on any translational or rotational measure (t-test, p > .05 for all measures).
2.6. Statistics and data analyses 2.6.1. Behavioral analyses
Behavioral data were analyzed using custom-written scripts in MATLAB 7.4 (The MathWorks Inc., Natick, MA, USA). Saccadic reac-tion time (SRT) was measured as thefirst saccade away from fixation after stimulus onset, when the velocity exceeded the mean + 3 × the SD of the background velocity. The velocity had to remain above this threshold for 5 sample points for it to be classified as a saccade. Saccades with SRTb110 ms were considered anticipatory and thus were excluded from analysis. This value was selected because it was the point at which errors in prosaccade trials were no longer executed at chance (50% correct: incorrect). Therefore, 110 ms was the earliest
time at which detection of the visual target could influence behavior. Express saccades, which are the shortest visually-triggered saccades, have typically been calculated as saccades with SRTs between 90 and 135 ms (Fischer et al., 1993; Munoz et al., 1998); however, the boundaries of this epoch change according to the participant age and stimulus conditions (Bell et al., 2006; Peltsch et al., 2011). In the current study, the express saccade epoch was measured between 110 and 140 ms, where 140 ms was the latency at which both groups made more correct responses than errors during antisaccade trials (data not shown). Prosaccade direction errors corresponded to sac-cades executed away from the target in prosaccade trials; antisaccade direction errors were prosaccades executed toward the target loca-tion during antisaccade trials. ADHD participants made 12.03% prosaccade errors and 23.08% antisaccade errors, while control partic-ipants made 5.21% prosaccade errors and 6.25% antisaccade errors. To ensure that direction errors were attributable to insufficient inhibito-ry control, rather than to inattention, distraction, or guessing of the cue location, we only examined errors that were corrected by the partici-pants. ADHD participants corrected 69.8% of prosaccade and 75.8% of antisaccade errors, while control participants corrected 80.3% of prosaccade and 90.6% of antisaccade errors; group differences in prosaccade (F(1, 26) = 0.75, p = .39, d =−0.32) and antisaccade (F(1, 26) = 2.37, p = .14, d =−0.56) error correction were not signif-icant. Direction error rate was calculated by dividing the total number of errors by the total number of valid trials (error + correct). Intra-subject variability for SRT was calculated using the coefficient of variation (CV) for correct trials (SD / mean× 100).
Valid trials consisted of all trials except for those that included: 1) failure tofixate during fixation trials; 2) failure to fixate during the instruction period of a full pro or antisaccade trial; 3) failure to execute a saccade during the response period; 4) execution of multiple saccades during the response period; 5) saccades executed during catch trials; 6) antisaccades executed during prosaccade trials; 7) failure to correct an antisaccade direction error; and 8) trials in which eye-tracking was unsuccessful. These aforementioned excluded trials were modeled sep-arately as‘invalid trials’ in the functional MRI analysis described below. Importantly the proportion of valid trails that were analyzed was simi-lar between the two groups. The range of valid trials for ADHD partici-pants was 22–63 for anti-catch trials, 18–64 for pro-catch trials, 33–108 for correct antisaccade trials, 21–128 for correct prosaccade tri-als, and 5–47 for antisaccade error trials. For control participants, valid trials ranged from 22 to 64 for anti-catch trials, 31 to 64 for pro-catch trials, 38 to 122 for correct antisaccade trials, 56 to 125 for correct prosaccade trials, and 5 to 18 for antisaccade error trials.
Independent-measures ANOVAs were conducted to examine ‘prepa-ratory’ differences in behavior between the control and ADHD groups for mean SRTs, SRT coefficient of variation, mean percentage of express saccades, and mean percentage of direction errors in anti and prosaccade trials. Group differences on saccade measures were not observed for left-ward versus rightleft-ward saccades and 6° versus 7° eccentricities (p>.05); therefore, these responses were pooled together. Furthermore, one-way ANOVAs were also used to measure between-group differences of saccade metrics, including pro and antisaccade duration, amplitude, and velocity. Paired t-tests (non-directional) were conducted to compare behavior within each experimental group. The effect sizes for all compar-isons were measured using Cohen's d.
2.6.2. fMRI analyses
In the rapid event-related design we employed, events occurred in rapid succession so that the BOLD signal recorded at any given point in time was the sum of the BOLD response from several preceding task events. Consequently, the measured BOLD time-series for each voxel was deconvolved with the canonical hemodynamic response function (HRF) in order to estimate the underlying time-course of neural activ-ity. The HRF was modeled with a 13-point time-series with a temporal resolution of 1.54 s. The result of this process demonstrates the
responses to each individual trial, without overlap in time. Events were modeled separately in the design matrix and pertained to trial type, including: 1) correct anti-catch trials; 2) correct pro-catch trials; 3) correct antisaccade trials; 4) correct prosaccade trials; 5) corrected antisaccade direction errors; and 6) invalid trials. Fixation trials were used as an implicit baseline.
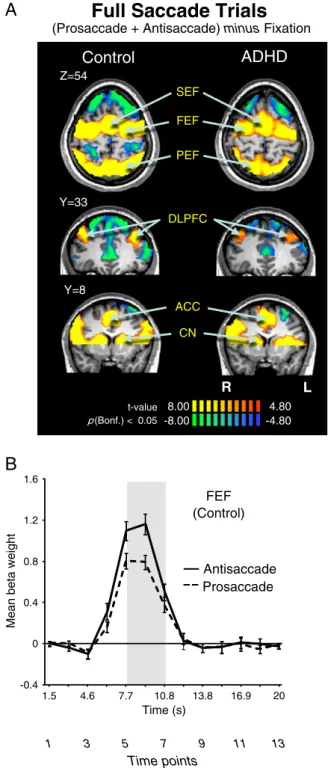
Several statistical parametric maps were computed for each group, with the statistics reflecting the significance of the consistent response of each voxel to each trial type, as defined above. First, to en-sure that the saccade task recruited all of our ROIs, we looked at full antisaccade trials and full prosaccade trials over time points 5–7 (7.7, 9.3, and 10.8 s from trial onset,Fig. 3B) that spanned the time in-terval from the presentation of the instruction cue to the execution of the saccade. Further, we computed contrast maps looking at both antisaccade preparatory (anti-catch minusfixation) and prosaccade preparatory (pro-catch minusfixation) activations (Fig. 4A), taken from time points 5 and 6 after trial onset (Fig. 5B). This interval was chosen as it corresponded to the peak of the hemodynamic response curve. To examine brain areas related to the execution of a saccade, contrasts examining antisaccade execution (full antisaccade minus anti-catch) and prosaccade execution (full prosaccade minus pro-catch) (Fig. 4B) were computed for the 6th and 7th time points after trial onset (Fig. 6B). Time points for the execution contrast were shifted by 1.5 s to include the 6th and 7th time points because the onset of the peripheral target occurred 1.5 s (one time point) after the appearance of the instruction cue. Finally, we computed con-trast maps examining correct antisaccade trials (antisaccade minus fixation) versus erroneous antisaccade trials (corrected antisaccade direction errors minusfixation), taken from the 5th to the 7th time point after trial onset (Fig. 7). We were unable to examine differences in preparation or execution during erroneous saccades because there were no saccades on catch trials; thus, we were unable to separate catch trials into those that led to correct versus erroneous antisaccades. We used a mixed-effects analysis based on studies conducted by
Brown et al. (2007). More precisely, group analysis was conducted using afixed-effects general linear model (GLM) with separate sub-ject predictors. This method was chosen (rather than constructing a single map for all participants using a random-effects analysis) as it ensures that every ROI was activated by both groups. Each statistical parametric map was Bonferroni corrected for multiple comparisons at pb.05 and cluster-size corrected at pb.05 (using a cluster threshold of nine contiguous voxels). Beta weight values (estimates of the BOLD signal change) were extracted from each individual after correcting for serial correlations, and then averaged across subjects in each ROI, defined as all the voxels within a 7×7×7 cubic cluster centered on the peak of activation, corrected for multiple comparisons. Beta weight values for bilateral structures (i.e., FEF, PEF, DLPFC, and CN) were extracted for both left and right locations and then averaged. ROIs were identified based on previous studies examining the neural correlates of saccades (Ford et al., 2005; Brown et al., 2007; Alvarez et al., 2010). One-way ANOVAs were then conducted between groups examining differences in mean beta weight values for all ROIs at each contrast described above.
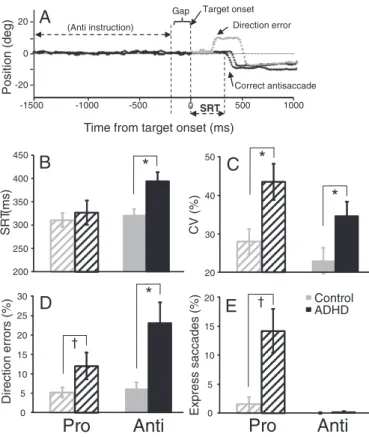
3. Results 3.1. Behavior
Sample eye position traces recorded from a control participant, illustrating two correct antisaccades and one direction error that is corrected, are shown inFig. 2A. Consistent with previous studies (Munoz et al., 2003; Feifel et al., 2004; Carr et al., 2006), adults with ADHD were slower to initiate correct antisaccades compared to con-trols (F (1, 26) = 9.58, pb.005, d=1.20;Fig. 2B), produced more var-iable SRTs for both prosaccades (F (1, 26) = 7.39, pb.05, d=1.05;
and executed a higher percentage of direction errors on antisaccade trials than controls (F (1, 26) = 9.22, pb.005, d=1.18; Fig. 2D). ADHD participants also made more direction errors than control par-ticipants on prosaccade trials, although the difference did not reach significance (F (1, 26)=3.36, p=.08, d=0.67). ADHD partic-ipants tended to make more express saccades during prosaccade trials than controls, although the difference did not reach significance (F (1, 26) = 2.66, p = .115, d = 0.59;Fig. 2E). Both groups did not differ in terms of correct prosaccade SRT (F (1, 26) = 0.31, p = .58, d = 0.22;Fig. 2B). Furthermore, to ensure that there were not any fa-tigue or time-on-task effects on task performance, we correlated the number of runs with several behavioral measures of saccade per-formance. There were no significant correlations between the number of runs and anti SRT (r(26) =−.21, p=.28), antisaccade di-rection errors (r(26) = .01, p = .95), pro SRT (r(26) =−.14, p=.49), prosaccade direction errors (r(26) =−.09, p=.64), or express prosaccades (r(26) =−.08, p=.68). Finally, group differences were not observed for saccade metrics, including prosaccade duration (F (1, 26)= 1.79, p = .28, d = 0.62), velocity (F (1, 26) = 0.74, p = .40, d =−0.44), and amplitude (F (1, 26)=0.14 p=.71, d=0.52) or antisaccade duration (F (1, 26) = 0.96, p = .34, d = 0.68), velocity (F (1, 26)= 0.30, p = .59, d =−0.46), and amplitude (F (1, 26)=0.13, p = .72, d = 0.59). Overall, adults with ADHD showed several impair-ments in saccade control— they made more direction errors during antisaccade trials, produced longer mean antisaccade SRTs, and had more variable SRTs. Thesefindings suggest that the saccade deficits pro-duced by adults with ADHD were not based on a general inability to execute a saccade (because saccade metrics were normal), but rather arose from an inability to‘preset’ the oculomotor network optimally prior to target onset (Fig. 1A), which subsequently led to higher vari-ability in SRT and more direction errors.
3.2. fMRI
3.2.1. The saccade network
The behavioral deficits (Fig. 2B–E) may have occurred because ADHD participants did not recruit key areas of the oculomotor network optimally for saccade control, including SEF, FEF, PEF, DLPFC, ACC, and CN (Connolly et al., 2002, 2005; Ford et al., 2005; Brown et al., 2007).
Fig. 3A depicts the most relevant slices for saccade (i.e., antisaccade plus prosaccade) generation, andTable 2lists the Talairach locations of peak activation for all key regions of interest. We found that both groups recruited all pre-defined ROIs, suggesting that the observed behavioral deficits in the ADHD group likely were attributed to critical differences in sub-processes of pro and antisaccade control (i.e., saccade preparation or execution).
3.2.2. Preparatoryfindings
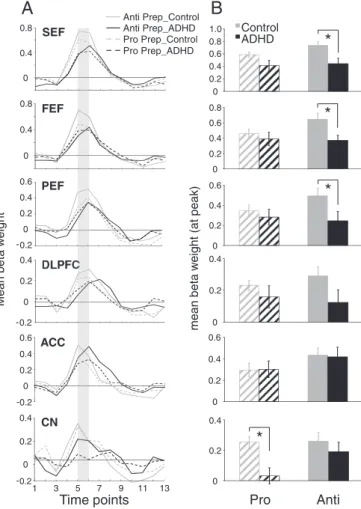
We hypothesized that increased direction errors during antisaccade trials in the ADHD group was attributed to insufficient preparation of the oculomotor network (i.e., inhibition of saccade-related neurons in FEF and SC before the peripheral target appeared;Everling et al., 1998; Everling and Munoz, 2000). For instance, the ADHD group could have made more direction errors in the antisaccade task be-cause they were unable to prepare properly to suppress the automat-ic prosaccade during the pre-target period. Slautomat-ices of the statistautomat-ical map built from the preparation contrasts are displayed inFig. 4A; ‘hot colored’ regions (i.e., orange/yellow) are those that produced a higher BOLD signal change for pro-catch or anti-catch trials, com-pared tofixation. Group comparisons of peak beta weight values at all regions of interest are shown inFig. 5A–B and Talairach locations of the peak activation for each ROI are shown inTable 3. Critically, during the preparatory phase, ADHD adults exhibited less activation (hypoactivation) than controls in all ROIs analyzed. This was most pronounced during antisaccade preparation where significant group differences in SEF (F(1, 26) = 7.78, pb.01, d=−1.11), FEF (F(1, 26) = 7.75, pb.01, d=−1.01), and PEF (F(1, 26)=4.30, pb.05, d=−0.83) emerged, with the control group showing greater activation in these areas. Finally, compared to ADHD participants, controls displayed greater activation in CN during prosaccade prep-aration (F(1, 26) = 11.59, pb.01, d=−1.39).
3.2.3. Executionfindings
Although we hypothesized that antisaccade deficits in the ADHD group likely arise from poor preparation, it was necessary to also ex-amine group differences in activity during saccade execution. Subse-quent analyses explored activation patterns related only to the response components of pro or antisaccades. Slices of the statistical map built from the execution contrasts are depicted inFig. 4B.‘Hot colored’ areas are those that produced more BOLD activation during saccade execution than preparation. Group comparisons of peak beta weight values for each ROI are shown inFig. 6A–B, and Talairach locations of the peak activation for each ROI are listed inTable 4. Overall, there were no differences in execution-related activation between ADHD and control participants. The only difference we observed was in the DLPFC, where ADHD participants exhibited signi fi-cantly greater execution-related activation (hyperactivation) compared to controls for both prosaccades (F(1, 26)=26.15, pb.001, d=1.64) and antisaccades (F(1, 26) =15.38, pb.001, d=2.06). This enhanced DLPFC recruitment may serve as a compensatory mechanism to facilitate or enhance correct saccade execution, given the reduced activation dur-ing the preparatory phase.
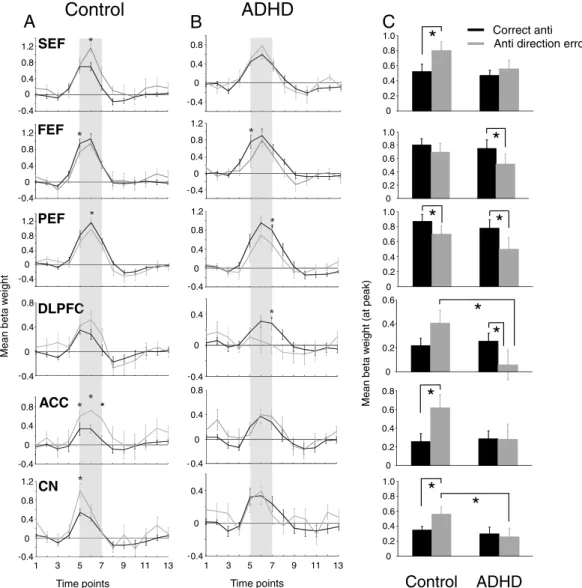
3.2.4. Correct versus incorrect antisaccade trials
Overall, the imaging data suggest that the biggest between-group differences at the contrast level for correct pro- and antisaccade processes occurred at the preparation level, particularly for the antisaccade task. Next, we investigated oculomotor function during
450
Time from target onset (ms)
Position (deg ) 20 0 -20 -1500 -1000 -500 500 1000 Correct antisaccade Direction error 0 (Anti instruction) Target onset SRT
A
Gap Control ADHDD
Dir ection err o rs (%) 0 5 10 15 20 25 30*
Pro
Anti
C
CV (%)*
*
20 30 40 50E
†Pro
Anti
0 5 10 15 20 Ex press saccades (%) SR T( ms)*
200 250 300 350 400B
†Fig. 2. (A) Sample eye traces depicting correct antisaccade trials and an erroneous antisaccade trial (direction error) followed by a correction. (B) Mean saccadic reaction times (SRT) on correct trials. (C) Mean intra subject coefficient of variation (CV) for SRT. (D) Mean percentage of direction errors. (E) Mean percentage of express saccades (110–140 ms). Error bars represent standard error of the mean (SE); *pb.05,†pb.1.
trials in which an antisaccade direction error was produced. Based on accumulator models (Fig. 1A), we hypothesized that the increased antisaccade error rate produced by ADHD adults resulted from reduced activity of fronto-striatal areas that are responsible for suppressing
saccade-related neurons, prior to target onset. Furthermore, inhibitory deficits in ADHD have been linked to deficient ACC activation (see
Fassbender and Schweitzer, 2006for review); therefore, we expected to see reduced ACC activity during error trials in this group. Group com-parisons of peak beta weight values, for activation related to correct ver-sus antisaccade direction error trials, are shown inFig. 7, and Talairach locations of the peak activation for each ROI are shown inTable 5. Between-group differences were only observed in two ROIs: controls displayed higher activation in CN (F(1, 26) = 4.10, pb.05, d=−0.81) and DLPFC (F(1, 26) = 4.57, pb.05, d=−0.85) during antisaccade errors compared to ADHD participants. Furthermore, two-tailed paired-samples t-tests revealed that both control and ADHD partici-pants showed greater activation in PEF (Control: t(13)= 2.30, pb.05,
d = 0.51; ADHD: t(13)= 2.48, pb.05, d=0.59) when performing correct
antisaccades, while greater activity in FEF (t(13)= 2.94, pb.05) and
DLPFC (t(13)= 2.18, pb.05, d=0.46) during correct antisaccade trials
was only observed in the ADHD group. Finally, control participants exhibited more activation in ACC (t(13)=−2.77, pb.05, d=0.88) and
SEF (t(13)=−2.13, pb.05, d=0.75) during antisaccade error trials
ver-sus correct antisaccade trials. This enhanced activation on error trials was absent in ADHD subjects.
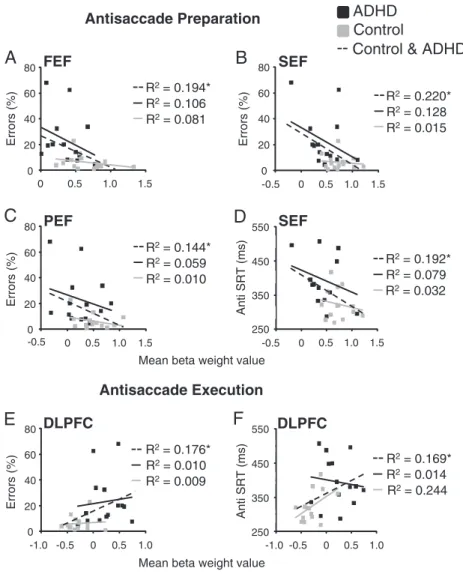
3.2.5. Correlations with antisaccade performance
To examine whether differences in the magnitude of antisaccade preparation activation across subjects correlated to antisaccade perfor-mance, post-hoc analyses were conducted to examine the relationship between behavior (anti SRT and percentage of direction errors) and activation in FEF, SEF, and PEF, areas that were hypoactive in ADHD adults during antisaccade preparation. Significant correlations were only observed when both groups' scores were combined. During antisaccade preparation, activity in FEF (r(26)=−.44, pb.05), SEF (r(26)=−.47, pb.05), and PEF (r(26)=−.38, pb.05) correlated nega-tively with antisaccade direction errors (Fig. 8A–C). Furthermore, anti SRT correlated negatively with activity in SEF (r(26)=−.44, pb.05) (Fig. 8D). Based on ourfindings that ADHD participants additionally
B
Antisaccade
Prosaccade
1.5 4.6 7.7 10.8 13.8 16.9 20 -0.4 0 0.4 0.8 1.2 1.6 1 3 5 7 9 11 13 Time (s)Time points
FEF
(Control)
Mean beta weight
R
Z=54 SEF FEF PEF ACC Y=33 DLPFC Y=8Control
ADHD
8.00 4.80 -8.00 -4.80 t-value p(Bonf.) < 0.05L
CNA
Full Saccade Trials
(Prosaccade + Antisaccade) minus Fixation
Fig. 3. (A) Contrast map of correct prosaccade trials and antisaccade trials added to-gether, cluster size corrected at pb.05 (9 contiguous voxels). Significant BOLD activa-tions are observed in all ROIs (‘hot’ colors), which are labeled. Activaactiva-tions are overlaid on a representative control brain. Coordinate values of planes in Talairach space are given. (B) Representation of mean BOLD signal time course in FEF separately for pro and antisaccade trials in control participants. Shaded bar corresponds to a re-gion of peak activation from trial onset. The three time points (5,6,7) under that shad-ed area were usshad-ed to derive the voxels showing significantly greater activation on saccade trials in A. Error bars represent standard error of the mean (SE). R = right; L = left.
Table 2
Talairach coordinates (X, Y, Z) of peak activation in GLM contrast maps for the antisaccade +prosaccade contrast (Fig. 3A).
Group and region Saccade: prosaccade plus antisaccade
X Y Z t Vol ADHD SEF −3 −7 55 28.52 1460 Right FEF 27 −10 52 25.97 890 Left FEF −27 −16 49 25.08 739 Right PEF 21 −64 49 29.75 1455 Left PEF −24 −61 45 33.97 2177 Right DLPFC 30 40 34 13.40 241 Left DLPFC −33 38 31 12.21 1459 ACC – – – – – Right CN 12 11 16 13.60 32 Left CN 10 5 14 10.41 19 Control SEF 0 −4 55 36.44 1575 Right FEF 24 −10 55 31.08 861 Left FEF −27 −10 49 36.04 1296 Right PEF 15 −70 46 42.62 1758 Left PEF −18 −67 46 49.44 2649 Right DLPFC 36 35 40 11.52 202 Left DLPFC −36 32 34 11.45 184 ACC 1 18 30 14.52 394 Right CN 11 7 12 10.49 35 Left CN −14 10 12 9.96 27
SEF, FEF, PEF, supplementary, frontal, parietal eyefields; DLPFC, dorsolateral prefrontal cortex; ACC, anterior cingulate cortex; CN, caudate nucleus. t = t-value; Vol = volume of cluster (voxel).
recruited DLPFC during the antisaccade response epoch, we also corre-lated antisaccade execution activation with antisaccade direction errors and reaction times. In general, when both groups were combined,
antisaccade response activation positively correlated with antisaccade direction errors (Fig. 8E; r(26) =.42, pb.05) and anti SRT (Fig. 8F; r(26)= .41, pb.05).
Pro Preparation
Pro-Catch minus FixationAnti Preparation
Anti-Catch minus FixationR L
Z=54 SEF FEF Z=54 SEF FEF ACC Y=8 Y=8 Y=33 DLPFC Y=33 DLPFCControl
ADHD
Control
ADHD
PEF PEF
Pro Execution
Prosaccade minus Pro-CatchAnti Execution
Antisaccade minus Anti-CatchZ=54 SEF FEF Z=54 SEF FEF Y=8 Y=8 Y=38 DLPFC Y=38 DLPFC
Control
ADHD
Control
ADHD
PEF PEF
A
B
8.00 4.80 -8.00 -4.80 t-value p(Bonf.) < 0.05 8.00 4.80 -8.00 -4.80 t-value p(Bonf.) < 0.05 8.00 4.77 -8.00 -4.77 t-value p(Bonf.) < 0.05 8.00 4.77 -8.00 -4.77 t-value p(Bonf.) < 0.05 CN ACC CN ACC CN ACC CNR L
R L
R L
R L
Fig. 4. Saccade preparation (A) and saccade execution (B) contrast maps. (A) Contrast map of pro-catch trials or anti-catch trials subtracted fromfixation trials, cluster size corrected at pb.05 (9 contiguous voxels). The 5th and 6th time points, relative to trial onset, were used in subtraction. Locations of oculomotor ROIs are identified. (B) Contrast map of full pro or antisaccade trials subtracted from pro-catch and anti-catch trials, respectively. The 6th and 7th time points were used in subtractions. Activations are overlaid on a representative control brain. R = right; L = left.
4. Discussion
We demonstrated that inhibitory control deficits in adults with ADHD, as measured by the antisaccade task, likely arise from poor preparation rather than difficulties with saccadic execution. We used an interleaved pro and antisaccade task with simultaneous fMRI and eye-tracking to examine the neural substrates of inhibitory control in adults with ADHD. Behaviorally, ADHD adults showed im-pairments in inhibitory control— they had longer antisaccade SRTs, made more direction errors during antisaccade trials, and produced more variable SRTs for both pro and antisaccade trials (Fig. 2B–E), all of which are suggestive of poor preparation. Importantly, the ADHD adults did not differ from controls in terms of the execution of pro or antisaccades because group differences in saccade metrics were not significant. These results suggest that saccade impairments in the ADHD group likely arise from deficits in saccade preparation (i.e., an inability to establish the appropriate task set) rather than the execution of the saccadic motor response. The imaging data support this conclusion: adults with ADHD produced less activity in all ROIs (FEF, SEF, PEF, DLPFC, CN) when preparing a correct antisaccade. Importantly, this hypoactivation was not observed in ADHD adults during antisaccade execution. Instead, they produced greater activation than controls in DLPFC when executing correct antisaccades, perhaps as part of a compensatory mechanism to cope with the challenge produced in the antisaccade task with inad-equate preparatory set. Our data suggest that the deficits observed in ADHD adults do not result from an inability to execute an antisaccade but rather stem from the failure to properly prepare for the antisaccade trial, which requires global top-down inhibition to suppress the automatic prosaccade (Munoz and Everling, 2004). Additionally, unlike control participants, adults with ADHD did not produced elevated ACC activation during antisaccade error trials, suggesting that they made more antisaccade errors because they were not efficiently recruiting the ACC, which is a key structure in-volved in processing and/or monitoring errors (Johnston et al., 2007). Taken together, our results suggest that the antisaccade de fi-cits in ADHD adults stem from poor preparation for inhibiting unwanted responses and/or a reduced ability to adjust behavior based on previously made mistakes.
Mean beta w eight mean beta w eight (at peak) Control ADHD
B
*
0 0.2 0.4 0.6*
0 0.2 0.4 0.6 0.8*
0 0.2 0.4 0.6 0.8 1.0 SEF 0 0.4 0.8 PEF -0.2 0 0.2 0.4 0.6 Anti Prep_Control Anti Prep_ADHD Pro Prep_Control Pro Prep_ADHDA
0 0.4 0.8 FEF 0 0.2 0.4 -0.2 0 0.2 0.4Pro
Anti
0 3 5 7 9 11 13Time points
0 0.2 0.4*
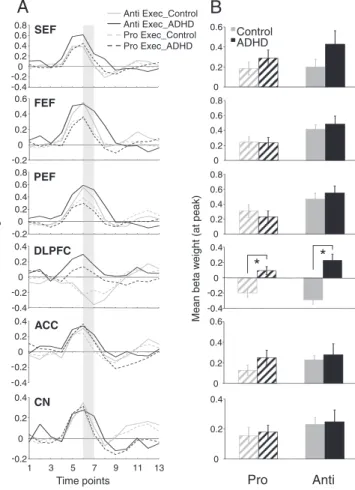
CN -0 0.2 0.4 0.2 1 -0.2 0 0.2 0.4 0.6 ACC 0 0.2 0.4 0.6Fig. 5. Region of interest (ROI) analysis for pro and antisaccade preparation. (A) Repre-sentation of mean BOLD signal time course for pro and anti prep for all ROIs derived fromFig. 4A. (B) Mean beta weight values for the 5th and 6th time points from the BOLD signal time course depicted in panel A (represented by the shaded bar in A). Left and right hemispheres were averaged. In ROIs where significant activation was not observed in one group, thresholds were lowered until beta weights could be obtained. Error bars represent standard error of the mean (SE). *pb.05.
Table 3
Talairach coordinates (X, Y, Z) of peak activation in GLM contrast maps for the prosaccade and antisaccade preparation contrasts (Fig. 4A). Group and region Prosaccade preparation Antisaccade preparation
X Y Z t Vol X Y Z t Vol ADHD SEF 6 2 52 11.49 330 6 2 52 13.65 464 Right FEF 27 −7 52 12.00 235 27 −7 52 12.44 386 Left FEF −30 −16 49 11.44 149 −30 −16 49 12.17 187 Right PEF – – – – – – – – – – Left PEF – – – – – – – – – – Right DLPFC – – – – – – – – – – Left DLPFC – – – – – – – – – – ACC 3 14 34 6.55 14 6 14 40 9.01 12 Right CN – – – – – – – – – – Left CN – – – – – – – – – – Control SEF −3 −4 55 17.32 799 −3 −4 55 21.15 1115 Right FEF 36 −10 49 14.80 539 21 −7 55 18.61 767 Left FEF −27 −10 49 15.61 580 −24 −10 49 19.73 637 Right PEF 27 −67 43 16.69 677 27 −67 43 19.33 980 Left PEF −24 −64 46 21.10 823 −24 −64 46 24.70 1132 Right DLPFC 33 32 40 7.51 41 33 35 43 11.99 187 Left DLPFC −27 38 28 5.61 50 −30 38 36 7.13 24 ACC −3 16 41 10.94 215 4 14 41 12.22 193 Right CN – – – – – 9 8 10 7.66 19 Left CN – – – – – −13 8 12 7.45 12
SEF, FEF, PEF, supplementary, frontal, parietal eyefields; DLPFC, dorsolateral prefrontal cortex; ACC, anterior cingulate cortex; CN, caudate nucleus. t = t-value; Vol = volume of cluster (voxel).
4.1. Behavioral deficits in ADHD
Wefirst confirmed that adults with ADHD showed antisaccade im-pairments in the MRI environment. In particular, they had slower and more variable SRTs and made more direction errors, thereby replicating several behavioral studies measuring antisaccade performance in ADHD adults (Munoz et al., 2003; Feifel et al., 2004; Carr et al., 2006). Impor-tantly, antisaccade deficits in adults with ADHD parallel those observed in other tasks measuring inhibitory control (Aron et al., 2003; Ossmann and Mulligan, 2003; Bekker et al., 2005; Lampe et al., 2007; Dibbets et al., 2009; McLoughlin et al., 2010; Schneider et al., 2010). For example, when required to inhibit an automatic response in a Go/NoGo task, ADHD adults not only produced more commission errors during trials in which no response was required, but also had longer and more vari-able reaction times during trials in which a response was required (Lampe et al., 2007; Dibbets et al., 2009). Given the extensive literature on inhibitory control deficits in ADHD, studies that link these deficits to brain function are important.
4.2. Hypoactivation of oculomotor network during preparation in ADHD Both control and ADHD participants recruited a similar neural net-work during the saccade task (including FEF, SEF, PEF, ACC, DLPFC, and CN). Thus, the antisaccade impairments observed in ADHD adults are not due to an inability to recruit key frontostriatal areas of the oculomotor network, but instead an inability to employ these areas optimally for specific task processes (i.e., preparation versus execu-tion of the saccade).
Successful antisaccade performance requires that recruitment of several cortical and sub-cortical brain regions, including DLPFC (Guitton et al., 1985; Pierrot-Deseilligny et al., 2003), FEF, PEF, and SEF (Connolly et al., 2002; Curtis and D'Esposito, 2003; DeSouza et al., 2003; Ford et al., 2005; Brown et al., 2007) and the basal ganglia (Ford and Everling, 2009; Watanabe and Munoz, 2009, 2010a, 2011a) be activated prior to the appearance of the peripheral target, which presets the motor system to execute the appropriate action (i.e., suppress prosaccade). Most importantly, we found that ADHD adults had less BOLD signal than controls in SEF, FEF, PEF, CN, and
Mean beta w eight Mean beta w eight (at peak) Anti Exec_Control Anti Exec_ADHD Pro Exec_Control Pro Exec_ADHD Control ADHD
B
0 0.2 0.4 0.6 0 0.2 0.4 0.6 0.8 0 0.2 0.4 0.6 0.8 SEF -0.4 -0.2 0 0.2 0.4 0.6 0.8 FEF -0.2 0 0.2 0.4 0.6 PEF -0.2 0 0.2 0.4 0.6 0.8A
Pro
Anti
Time points 1 3 5 7 9 11 13 CN -0.2 0 0.2 0.4 0 0.2 0.4 DLPFC -0.4 -0.2 0 0.2 0.4 -0.4 -0.2 0 0.2 0.4*
*
-0.4 -0.2 0 0.2 0.4 ACC 0 0.2 0.4 0.6Fig. 6. Region of interest (ROI) analysis for pro and antisaccade execution. (A) Repre-sentation of mean BOLD signal time course for prosaccade and antisaccade execution for all ROIs derived fromFig. 4B. (B) Mean beta weight values for the 6th and 7th time points from the BOLD signal time course in panel A (corresponding to shaded bar in A). Left and right hemispheres were averaged. In ROIs where significant activa-tion was not observed in one group, thresholds were lowered until beta weights could be obtained. Error bars represent standard error of the mean (SE). *pb.05.
Table 4
Talairach coordinates (X, Y, Z) of peak activation in GLM contrast maps for the prosaccade and antisaccade execution contrasts (Fig. 4B). Group and region Prosaccade execution Antisaccade execution
X Y Z t Vol X Y Z t Vol ADHD SEF 3 −7 55 8.67 238 −3 −13 52 9.82 253 Right FEF 27 −13 52 7.67 40 27 −10 55 10.27 165 Left FEF −24 −16 49 9.22 167 −24 −16 49 12.35 263 Right PEF 21 −67 49 8.85 117 21 −67 49 14.93 294 Left PEF −18 −67 52 10.32 393 −21 −67 49 15.76 1189 Right DLPFC – – – – – – – – – – Left DLPFC – – – – – – – – – – ACC 3 8 34 6.99 57 0 14 31 7.39 85 Right CN – – – – – 10 8 12 8.71 65 Left CN – – – – – – – – – – Control SEF 0 −10 55 7.80 61 0 −4 55 8.10 55 Right FEF 21 −10 55 8.45 79 24 −13 55 12.27 151 Left FEF −30 −10 51 10.40 309 −24 −10 55 12.37 343 Right PEF 12 −73 46 12.49 309 15 −70 46 18.87 342 Left PEF −9 −73 46 15.43 762 −18 −70 46 19.47 892 Right DLPFC – – – – – 24 41 34 −9.10 86 Left DLPFC – – – – – – – – – – ACC – – – – – – – – – – Right CN 9 5 10 6.84 39 9 6 9 6.41 99 Left CN – – – – – −12 −4 19 7.23 67
SEF, FEF, PEF, supplementary, frontal, parietal eyefields; DLPFC, dorsolateral prefrontal cortex; ACC, anterior cingulate cortex; CN, caudate nucleus; negative t-value denotes catch >saccade. t = t-value; Vol = volume of cluster (voxel).
DLPFC during antisaccade preparation. Failure of the ADHD adults to activate these regions to the same degree as control subjects, particu-larly FEF, SEF and PEF where differences were statistically significant, likely indicates core deficits in the ability to preset frontoparietal cir-cuits critical for optimal task performance.
Anatomical and functional imaging studies examining brain areas as-sociated with inhibitory control in adults with ADHD are limited. There are reports of volume and cortical thickness reductions in several areas involved in inhibitory control, including frontal cortex and parietal lobes (Seidman et al., 2006; Makris et al., 2007). The hypoactivation of frontal and parietal areas in the ADHD group in the present study repli-cates and extends previous imaging studies that have found abnormal (usually less) activity in these brain regions in adults with ADHD when performing tasks that assess executive function (Hale et al., 2007; Cubillo et al., 2010; Karch et al., 2010; McLoughlin et al., 2010). Furthermore, the few studies that examined the neural correlates of in-hibitory control in ADHD adults specifically have found hypoactivation in frontal and parietal areas (Cubillo et al., 2010; McLoughlin et al., 2010), yet hyperactivation in these brain regions has also been reported (Dibbets et al., 2009; Dillo et al., 2010). These conflicting results may be attributed to task difficulty, as studies that reported hyperactivation of frontal and parietal regions used a relatively easier task (Go/NoGo task) that involved selective attention, which is less impaired in ADHD
patients than motor response inhibition (van Mourik et al., 2005). Al-though dysfunctional brain activation during preparation has been ob-served using event-related potentials (ERP;McLoughlin et al., 2010), we are thefirst to report, using fMRI, that inhibitory control deficits in adults with ADHD likely arise from hypoactivation of specific frontal and parietal structures during task preparation, namely, the FEF, SEF, and PEF. This result is not due to motion artifacts because: 1) both groups did not differ in terms of total motion during the MRI session; and 2) hypoactivity was not observed during the execution epoch.
The FEF and SEF are both involved in voluntary saccade genera-tion. Humans with lesions to FEF have longer antisaccade reaction times (Gaymard et al., 1999), and human fMRI (Connolly et al., 2005) and monkey neurophysiology (Everling and Munoz, 2000) studies found that activity in FEF correlates with antisaccade reaction time. The SEF is involved in successful antisaccade performance; for example,Amador et al. (2004) reported that SEF neuronal activity predicted antisaccade success: monkeys generated greater activity in SEF during correct antisaccade trials compared to erroneous antisaccade trials. Interestingly, greater FEF and SEF BOLD signal asso-ciated with antisaccades, more so than prosaccades, is among the most consistentfindings in the human functional neuroimaging liter-ature on antisaccades (e.g.,Curtis and D'Esposito, 2003; DeSouza et al., 2003; Ford et al., 2005; McDowell et al., 2005; Raemaekers et al.,
*
*
*
*
*
*
*
*
Correct anti 0 0.2 0.4 0.6 0.8 1.0 0 0.2 0.4 0.6 0.8 1.0 0 0.2 0.4 0.6 0.8 1.0C
*
0 0.2 0.4 0.6 0.8Control
ADHD
0 0.2 0.4 0.6 0.8 1.0 0 0.2 0.4 0.6 Mean beta w eight (at peak)Anti direction error
ADHD
B
-0.4 0 0.4 0.8 Time points 1 3 5 7 9 11 13 -0.4 0 0.4 -0.4 0 0.4 0.8 1.2 -0.4 0 0.4 0.8*
-0.4 0 0.4 0.8 1.2 -0.4 0 0.4*
Control
Mean beta w eightA
*
SEF
-0.4 0 0.4 0.8 1.2PEF
-0.4 0 0.4 0.8 1.2*
*
ACC
-0.4 0 0.4 0.8 Time points 1 3 5 7 9 11 13CN
-0.4 0 0.4 0.8 1.2*
DLPFC
-0.4 0 0.4 0.8*
FEF
-0.4 0 0.4 0.8 1.2*
*
*
C
*
*
Fig. 7. Region of interest (ROI) analysis for correct and erroneous antisaccade trials. (A–B) Representation of mean BOLD signal time course for correct and erroneous antisaccade trials for all ROIs in control (A) and ADHD (B) participants. (C) Mean beta weight values for the 5th, 6th and 7th time points (represented by the shaded bar in A and B) fromfixed effects analysis of correct and erroneous antisaccade trials for 343 cubic voxels surrounding peak activations in regions showing greater activation on correct antisaccade trials com-pared to erroneous antisaccade trials. Left and right hemispheres were averaged. Error bars represent standard error of the mean (SE). *pb.05.
2006; Ettinger et al., 2008). This increased activation was observed prior to saccade generation (Connolly et al., 2002; DeSouza et al., 2003; Ford et al., 2005; McDowell et al., 2005). It is important to note that human studies using fMRI report increased FEF activation during antisaccade preparation; conversely, saccade neurons in layer V of the FEF in monkeys are less activate during antisaccade preparation (Everling and Munoz, 2000). Recently however,Ford et al. (2009)showed that monkeys had increased BOLD-related activa-tion for antisaccades, implying that the discrepancy with human FEF activation reports may be related to methodological differences between fMRI and extracellular single cell recording rather than dif-ferences between species.
Consistent with the accumulator model (Fig. 1A), the data indicate that the signal to generate a voluntary antisaccade (red solid line,
Fig. 1A) races with the signal to generate the automatic prosaccade (gray dashed line, Fig. 1A), and that increased FEF and SEF BOLD signal prior to antisaccade execution offsets the tendency to produce an automatic prosaccade (i.e., direction error) toward the target. The in-creased occurrence of direction errors in ADHD adults likely results from compromised pre-target suppression signals in FEF and SEF, resulting in the unwanted automatic prosaccade command to reach thresholdfirst. For correct antisaccade responses, the prosaccade signal must be sufficiently suppressed to allow the antisaccade signal time to reach thresholdfirst. Overall, the reduced activity in FEF and SEF during antisaccade preparation may partially account for the longer anti SRTs and/or increased antisaccade error rate produced by ADHD adults, which is further supported by the correlation analyses (Fig. 8A–D).
Compared to controls, adults with ADHD produced hypoactivation in PEF during antisaccade preparation. PEF provides important visual input to the frontal cortical oculomotor areas (Ferraina et al., 2002), and also receives reciprocal inputs from these frontal areas (Lynch and Tian, 2006). Therefore, the reduced activity in PEF in the ADHD adults may have resulted from reduced activation of FEF and SEF. Fur-thermore,Matsuda et al. (2004)reported greater activity in inferior parietal cortex during antisaccade, compared to prosaccade trials, and a similar region showed activity during an inhibitory period pre-ceding antisaccade generation (Ettinger et al., 2008), suggesting that the PEF may participate in presetting the oculomotor network for cor-rect antisaccade generation. Evidence suggests that regions in the
area of the intraparietal sulcus (within parietal cortex) may perform the vector inversion required to specify the correct antisaccade loca-tion (e.g.,Zhang and Barash, 2000; Medendorp et al., 2005; Nyffeler et al., 2007). Therefore, a failure to activate the PEF optimally during antisaccade preparation may make it more difficult for ADHD adults to generate the voluntary saccade, resulting in more direction errors and/or increased SRTs during antisaccade trials.
Interestingly, control participants produced greater activation in CN during prosaccade preparation than ADHD participants. CN is in-volved in controlling prosaccade initiation and suppression (Ford and Everling, 2009; Watanabe and Munoz, 2010b, 2011b). For exam-ple, Watanabe and Munoz (2011b) reported that post-stimulus microstimulation of the monkey CN lengthened pro SRTs, while pre-target microstimulation shortened pro SRTs, possibly by altering excitability via different pathways through the basal ganglia. There-fore, insufficient recruitment of the CN during prosaccade preparation may have reduced the activation of these basal ganglia pathways, possibly explaining the increased variability of pro SRTs in the ADHD group. Furthermore, the CN is also involved in motivational as-pects of prosaccade behavior (Watanabe and Hikosaka, 2005; Ding and Hikosaka, 2006; Hikosaka, 2007; Kobayashi et al., 2007). CN ac-tivity increased during prosaccade preparation when the expectancy of a reward was high (Watanabe and Hikosaka, 2005); moreover, in-jection of a dopamine antagonist into the CN greatly influenced the reward modulation of saccade behavior by reducing SRTs following a high-reward trial (Hikosaka, 2007). Several studies have linked the behavioral deficits of ADHD to a dopamine deficiency (seedel Campo et al., 2011; Krause, 2008; Tripp and Wickens, 2009for re-view). Therefore, the increased occurrence of prosaccade direction er-rors in the ADHD is perhaps related to poor motivation for the task, which may be explained by reduced activation in the CN during prosaccade preparation.
4.3. Adaptive mechanisms
Because ADHD adults exhibited normal saccade metrics, we did not expect to see group differences in activation during the saccade execu-tion period of pro and antisaccade trials. Group differences during exe-cution were only observed in DLPFC. When executing a correct pro or
Table 5
Talairach coordinates (X, Y, Z) of peak activation in GLM contrast maps for the correct and incorrect antisaccade generation contrasts. Group and region Correct antisaccade Antisaccade direction error
X Y Z t Vol X Y Z t Vol ADHD SEF −3 −7 55 26.72 548 3 5 46 14.85 482 Right FEF 27 −10 55 26.84 1890 27 −10 52 14.88 2096 Left FEF −27 −16 49 25.03 760 −30 −11 48 12.73 449 Right PEF 21 −64 49 30.81 1651 21 −64 49 15.01 747 Left PEF −24 −61 43 31.71 2425 −24 −61 46 16.65 876 Right DLPFC 39 23 37 11.09 31 39 26 37 7.21 35 Left DLPFC −33 38 31 12.61 175 – – – – – ACC 2 15 41 12.01 267 1 7 43 9.31 275 Right CN 12 7 13 13.60 32 12 8 12 7.12 35 Left CN −10 6 11 14.59 41 −11 6 10 7.39 48 Control SEF 0 −4 55 34.16 1036 −3 −4 55 14.48 706 Right FEF 24 10 55 32.17 716 24 −10 48 10.00 84 Left FEF −27 −10 49 35.27 1741 −21 −7 49 12.80 407 Right PEF 15 −70 46 45.18 1898 15 −70 46 13.50 596 Left PEF −18 −67 46 50.14 2628 −18 −67 46 15.88 756 Right DLPFC 36 35 40 13.03 250 30 32 40 5.72 10 Left DLPFC −39 32 34 10.45 161 – – – – – ACC 2 16 27 13.54 271 4 19 25 6.14 23 Right CN 11 10 12 9.01 85 9 5 10 8.20 82 Left CN −10 6 13 8.56 74 −12 −1 16 7.81 86
SEF, FEF, PEF, supplementary, frontal, parietal eyefields; DLPFC, dorsolateral prefrontal cortex; ACC, anterior cingulate cortex; CN, caudate nucleus. t = t-value; Vol = volume of cluster (voxel).
antisaccade, ADHD adults exhibited greater activation in DLPFC com-pared to controls. This may reflect some type of adaptive mechanism to deal with the antisaccade conflict, given the deficit during the prepa-ratory epoch. The DLPFC may provide a supplementary, albeit less ef fi-cient (i.e., occurs post-target) signal to help reduce the production of the unwanted prosaccade during antisaccade trials.
Humans with lesions to the DLPFC produce more direction errors in the antisaccade task (Guitton et al., 1985; Pierrot-Deseilligny et al., 2003). Several functional neuroimaging studies have reported greater DLPFC activity during antisaccades compared to prosaccades (e.g., DeSouza et al., 2003; Matsuda et al., 2004; Ettinger et al., 2008) and this enhanced activation of DLPFC during antisaccade trials occurs during preparation, prior to antisaccade generation (DeSouza et al., 2003; Ford et al., 2005; McDowell et al., 2005; Brown et al., 2007). Together, these data suggest that the DLPFC is critically in-volved in suppressing reflexive saccades during the antisaccade task. However studies that used an interleaved, rather than a block, design did not see greater DLPFC in antisaccade trials compared to prosaccade trials (Raemaekers et al., 2002, 2006; O'Driscoll et al., 2005).McDowell et al. (2008)posit that in cases such as these, the DLPFC may instead produce tonic activity during the entire task due to the increased difficulty and more complex response selection
requirements during the interleaved design. Based on this theory, we may not have seen differences in DLPFC activity between pro and antisaccades because we used an interleaved design.
The observation that adults with ADHD generated greater BOLD activity in DLPFC during saccade execution can be interpreted in two ways. First, ADHD participants recruited DLPFC for successful pro and antisaccade execution, perhaps as an‘adaptive strategy’ to in-hibit unwanted automatic saccades (i.e., direction errors during antisaccade trials or express saccades during prosaccade trials). In this case, their longer SRTs may reflect the additional processing time required to recruit the DLPFC. Our correlational analysis (Fig. 8F) supports this view as post-target activity in DLPFC correlated positively with anti SRT. Second, brain activation for pro and antisaccade execution was measured by subtracting activation occur-ring duoccur-ring the saccade preparation epoch from the saccade response epoch. Therefore, it is at least possible that control participants recruited the DLPFC more so during preparation, while ADHD partici-pants recruited the DLPFC more so during execution. As such, saccade deficits in the ADHD group may result from a reduced suppression signal from the DLPFC during the preparation stage, leading to a reduced ability to inhibit prosaccades during antisaccade trials and more express saccades during prosaccade trials. This second suggestion
Antisaccade Preparation
0 20 40 60 80 0 0.5 1.0 1.5 Errors (%)A
FEF
R2= 0.015 R2= 0.128 R2= 0.220*Antisaccade Execution
Mean beta weight value
ADHD
Control
Control & ADHD
Anti SRT (ms)
DLPFC
F
250 350 450 550 -1.0 -0.5 0 0.5 1.0 Errors (%)SEF
B
0 20 40 60 80 -0.5 -0.5 0 0.5 1.0 1.5 R2= 0.081 R2= 0.106 R2= 0.194* Errors (%)PEF
C
80 0 20 40 60 -0.5 0 0.5 1.0 1.5 R2= 0.010 R2= 0.059 R2= 0.144* Anti SRT (ms)D
SEF
250 350 450 550 0 0.5 1.0 1.5 R2= 0.032 R2= 0.079 R2= 0.192* R2= 0.244 R2= 0.014 R2= 0.169* Errors (%)E
DLPFC
0 20 40 60 80 -1.0 -0.5 0 0.5 1.0 R2= 0.009 R2= 0.010 R2= 0.176*Mean beta weight value
Fig. 8. Correlations between antisaccade measures (direction errors and SRT) and BOLD activation during antisaccade preparation (A–D) and execution (E–F) in relevant ROIs. (A–D) Mean beta weight values were extracted from the 5th and 6th time points of thefixed effects analysis of anti preparation for 343 cubic voxels surrounding peak activations from ROIs inFig. 5. (E–F) Mean beta weight values were taken from time points 6 and 7 from a fixed effects analysis of antisaccade execution for 343 cubic voxels surrounding peak activation from ROIs inFig. 6. *pb.05.